In the UK, the CBI Realized Sales index dropped sharply to -24, from 1 in the previous period, against an expected 8. This unexpected decline weighed heavily on the British pound.
In the US, New Home Sales fell to 619K, missing forecasts of 636K and well below the previous 698K, indicating a potential slowdown in the housing market, which in turn impacted the Dollar Index slightly.
Events Ahead
Looking ahead, for the euro, M3 Money Supply and Private Loans data will be released at 7:30, with expected growth rates of 1.5% and 0.3%, respectively.
At 9:00, the Bank of England’s Financial Stability Report will be published, followed by a speech from BOE Governor Bailey at 9:30, along with the FPC Meeting Minutes and Statement. These events will be critical for the GBP/USD.
In the US, key economic data include the Final GDP q/q at 12:30, expected at 1.4%, and Unemployment Claims, forecasted at 236K. Also, Core Durable Goods Orders are expected to rise by 0.2%, with overall Durable Goods Orders predicted to decrease by 0.5%.
Additionally, the Goods Trade Balance is forecasted to show a deficit of $96.0 billion, and Pending Home Sales m/m are anticipated to rise by 0.6%.
The combination of these data points will provide crucial insights into the economic health of these regions and is likely to drive significant movements in the EUR/USD, GBP/USD, and Dollar Index.
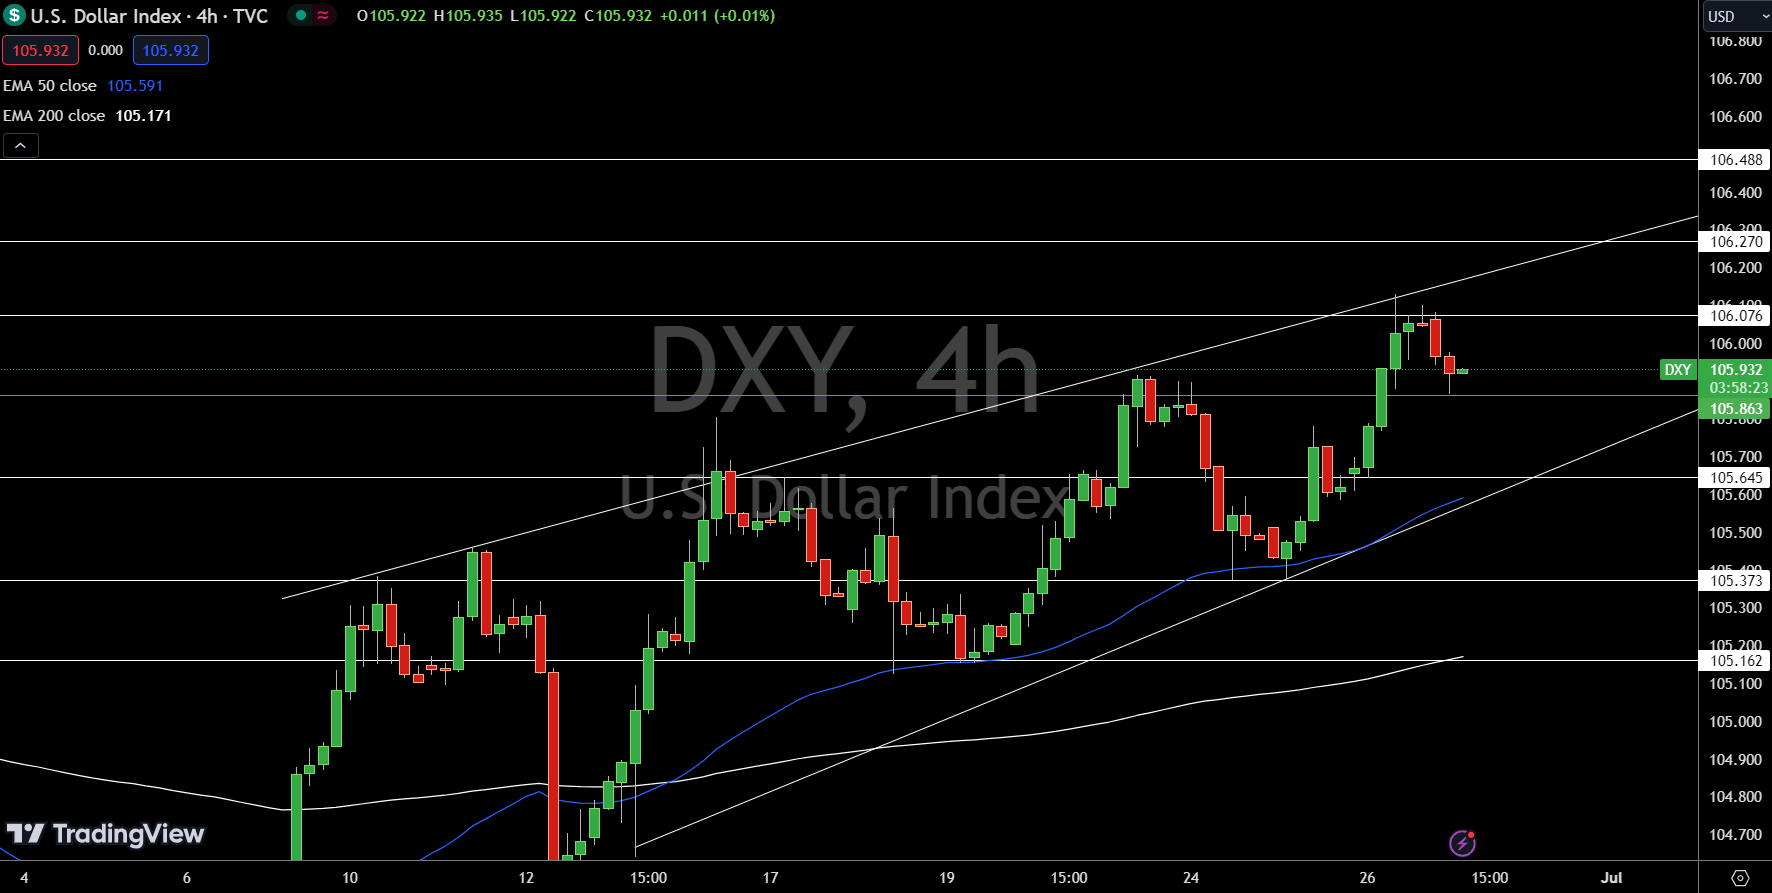
The Dollar Index is trading at $105.932, reflecting a slight decline of 0.08%. The 4-hour chart highlights a pivot point at $105.863, a critical level for determining market direction.
Immediate resistance levels are at $106.076, $106.270, and $106.488, which could cap upward movements unless breached. On the downside, immediate support is positioned at $105.645, followed by $105.373 and $105.162.
The 50-day Exponential Moving Average (EMA) is at $105.591, and the 200-day EMA stands at $105.171, suggesting key support levels near the current price. Overall, the Dollar Index remains bullish above the pivot point of $105.863.
EUR/USD Technical Forecast
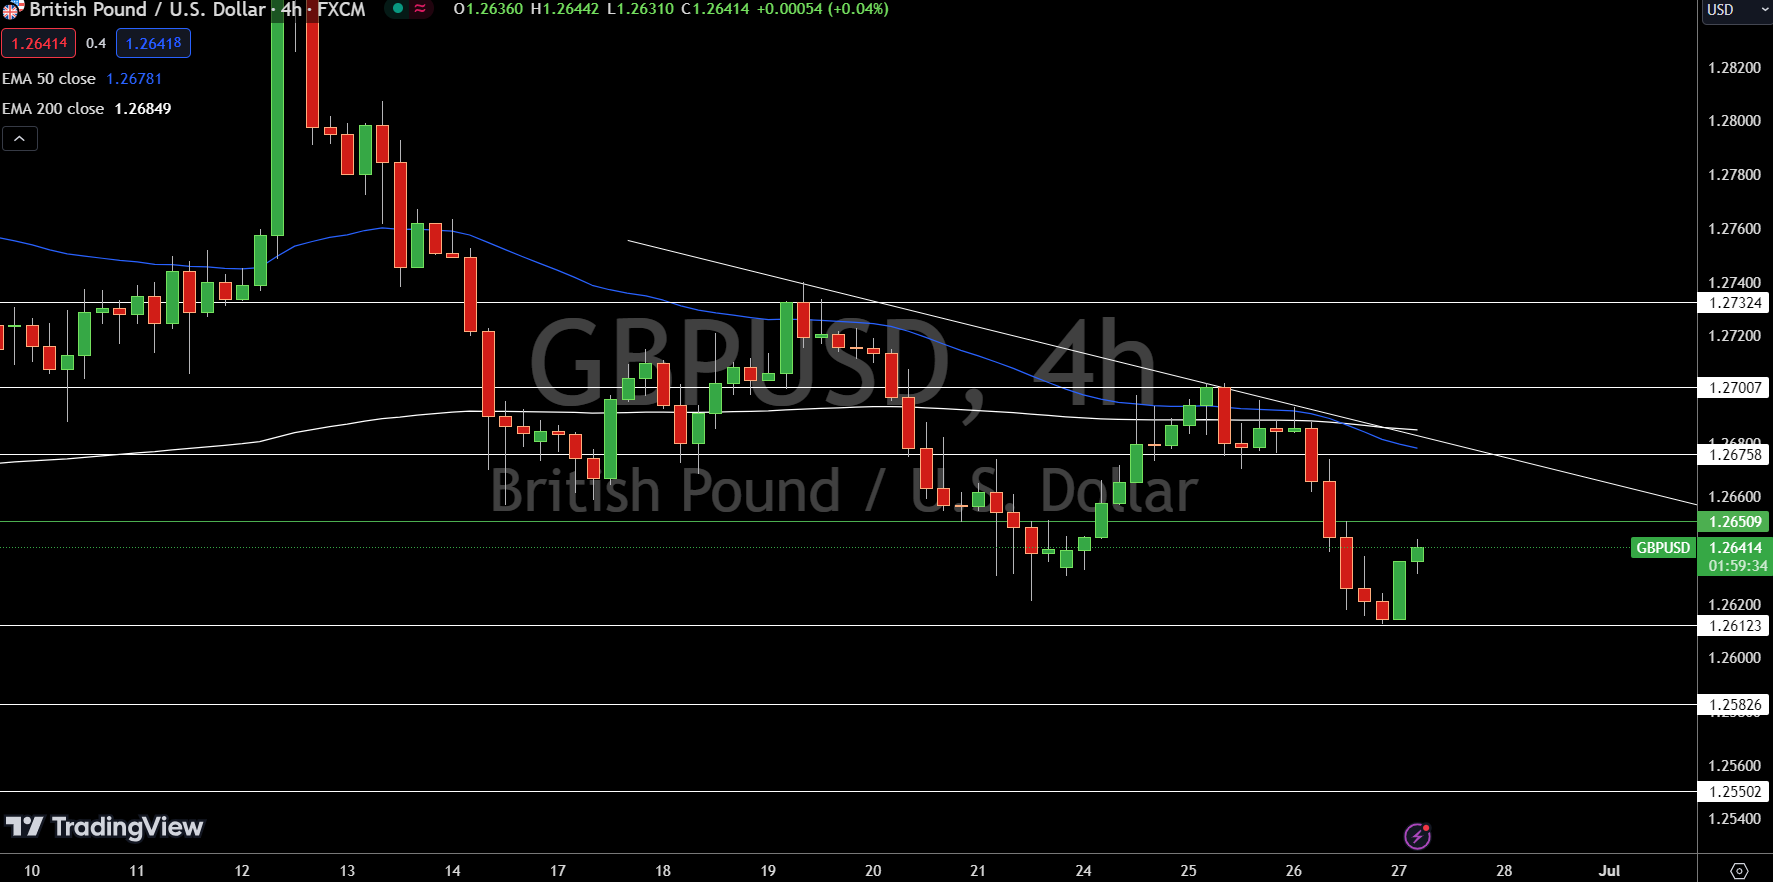
GBP/USD is trading at $1.26414, reflecting a modest increase of 0.06%. The 4-hour chart identifies a pivot point at $1.26509, crucial for gauging market direction. Immediate resistance levels are situated at $1.26758, $1.27007, and $1.27324, which could limit upward movements unless breached.
On the downside, immediate support is found at $1.26123, followed by $1.25826 and $1.25502, indicating key levels that could trigger further declines if violated.
The technical indicators highlight a bearish sentiment, with the 50-day Exponential Moving Average (EMA) at $1.26781 and the 200-day EMA at $1.26849. Overall, GBP/USD remains bearish below the pivot point of $1.26509.