


The EUR/USD is trading nearly flat shortly before the release of the March U.S. Non-Farm Payrolls report. A stronger than expected report is like to drive the Forex pair lower. Traders will also be watching trader appetite for risk. However, they seem to be a little confused about how to play this. Therefore, we could see a volatile two-sided trade.
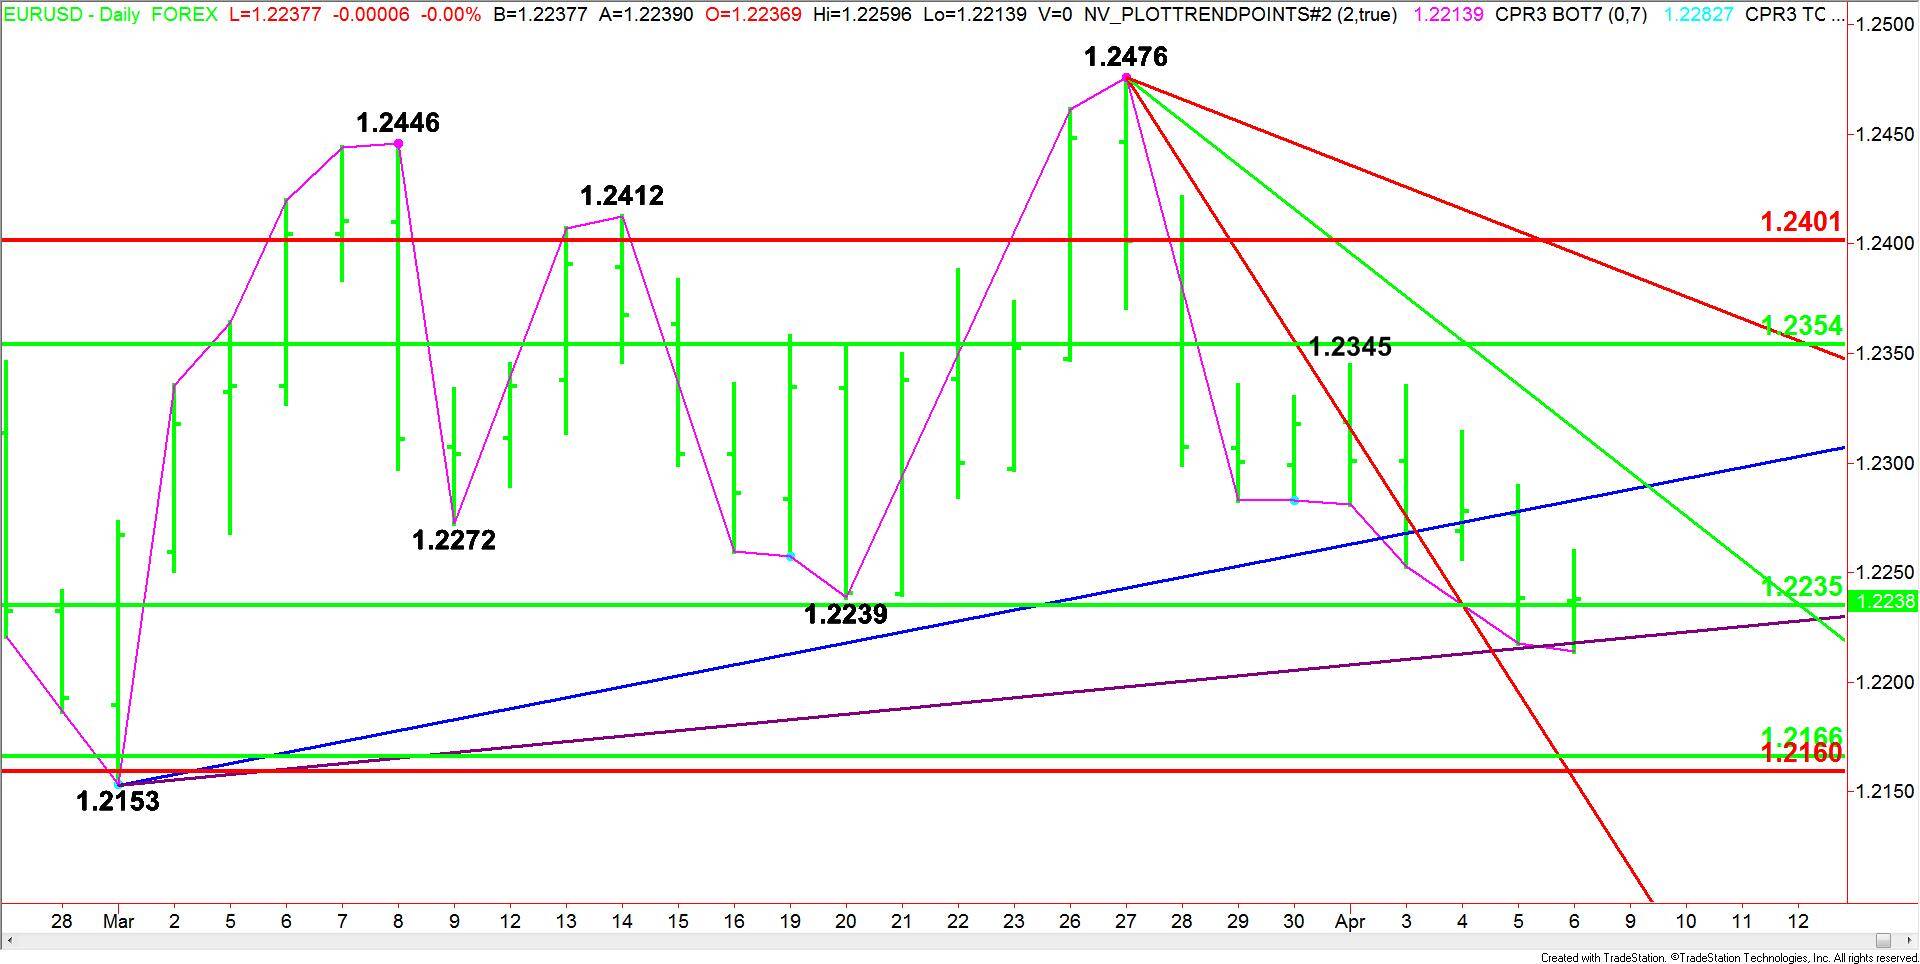
Daily Swing Chart Technical Analysis
The main trend is down according to the daily swing chart. The trend turned down on Thursday when sellers took out 1.2239.
Today’s session also begins with the EUR/USD in the window of time for a potentially bullish closing price reversal bottom. We’ve already had the lower-low, now all we need is the higher close to form this chart pattern. If successful we could see the start of a 2 to 3 day rally.
Support is a major 50% level at 1.2235. Additional support comes in at 1.2166, 1.2160 and 1.2153.
The nearest 50% resistance is 1.2354.
Daily Swing Chart Technical Forecast
Based on the early trade, the direction of the EUR/USD today is likely to be determined by trader reaction to the 50% level at 1.2235.
A sustained move over 1.2235 will indicate the presence of buyers. This could trigger a rally into an uptrending Gann angle at 1.2283. Overcoming this angle will indicate the buying is getting stronger. This could create the upside momentum needed to challenge a downtrending Gann angle at 1.2316.
A sustained move under 1.2235 will signal the presence of sellers. This could lead to a quick move into another uptrending Gann angle at 1.2218. This angle stopped the selling earlier in the session.
The Gann angle at 1.2218 is the trigger point for an acceleration to the downside with the next major targets a support cluster at 1.2166 to 1.2153.