



The Euro is rebounding at the mid-session on Wednesday from 10-month low after reports that Italy’s biggest party would make a renewed attempt to form a coalition government and end months of political reform.
This news seems good enough to fuel a short-covering rally, but if the attempt fails to work then look for a fresh round of selling pressure.
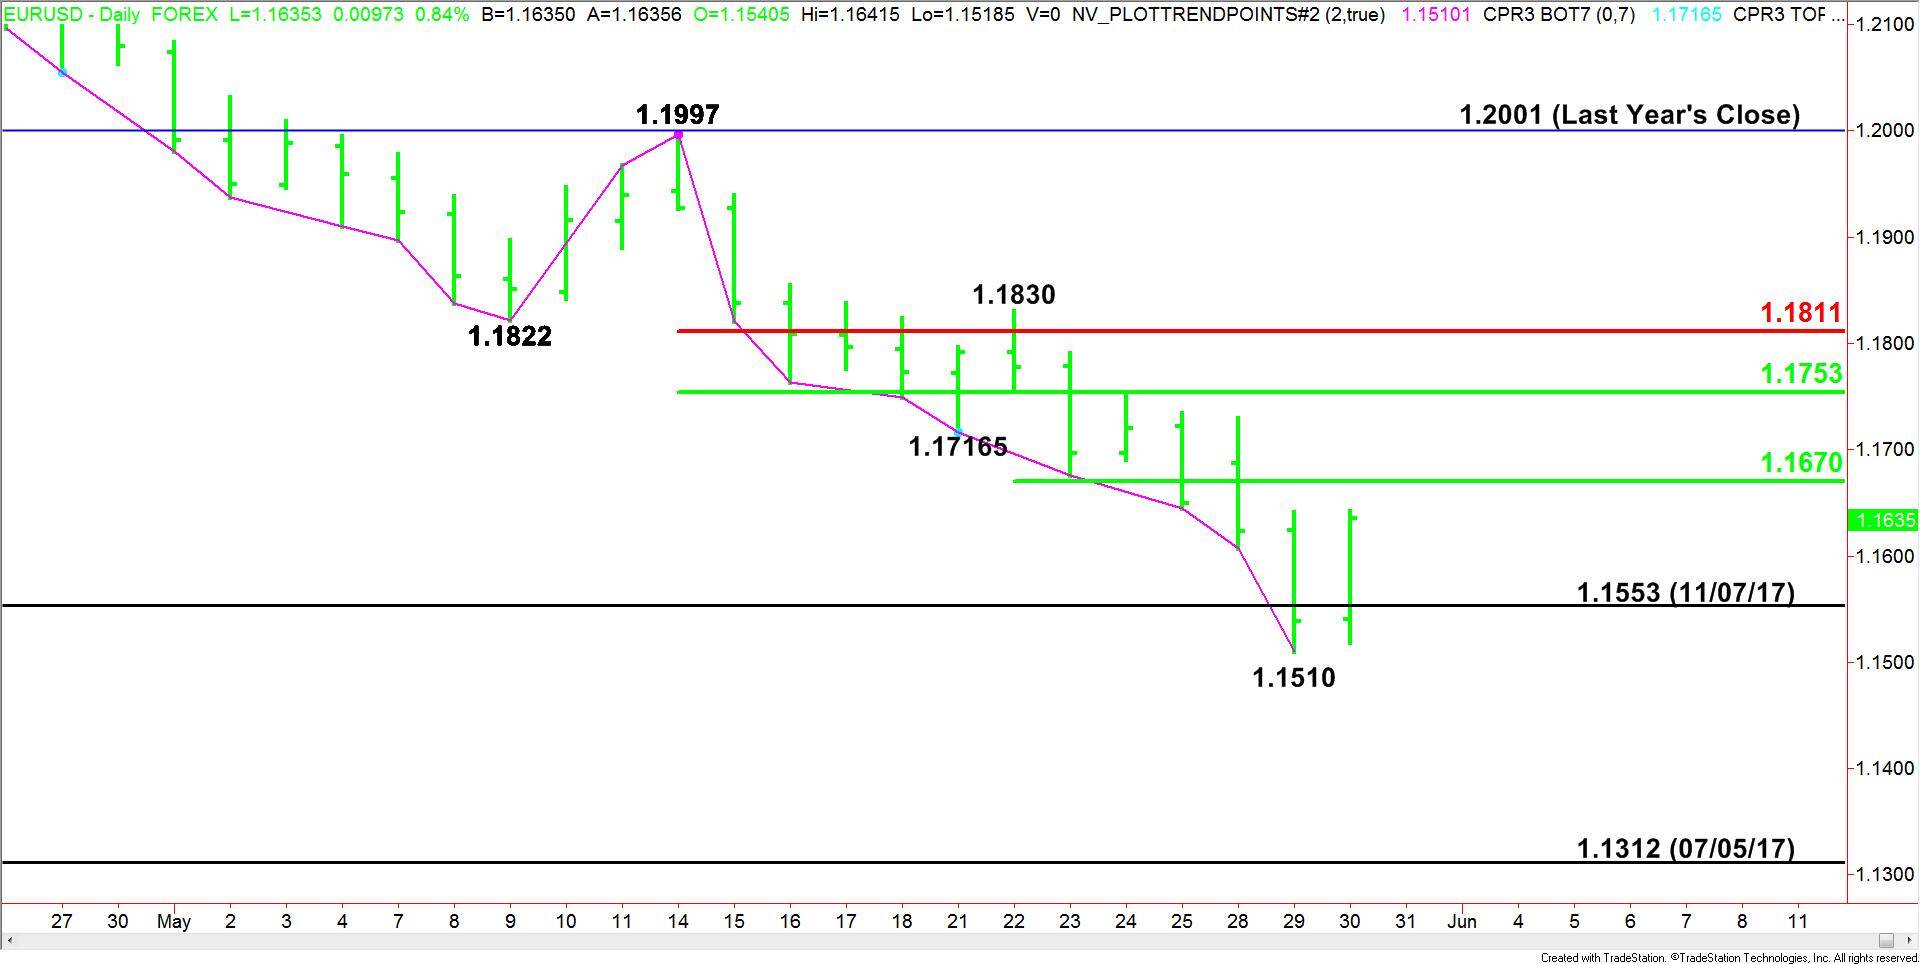
Daily Swing Chart Technical Analysis
The main trend is down according to the daily swing chart. A trade through 1.1510 will signal a resumption of the downtrend. Today’s price action has produced a new minor bottom at 1.1510.
The short-term range is 1.1830 to 1.1510. Its 50% level or pivot at 1.1670 is the first upside target.
The main range is 1.1997 to 1.1510. If the rally continues through the first pivot then look for the rally to extend into its retracement zone at 1.1753 to 1.1811.
Daily Swing Chart Technical Forecast
Based on the early price action, the direction of the EUR/USD is likely to be determined by trader reaction to the pivot at 1.1670.
The inability to overcome 1.1670 will signal the return of sellers. This could trigger a retracement of the rally from yesterday’s low. Currently, that range is 1.1510 to 1.1647. This will make 1.1579 the next likely downside target.
Taking out 1.1670 will indicate the presence of buyers. If this move generates enough upside momentum then watch for a possible extension into 1.1753 to 1.1811.
Since the main trend is down, sellers could show up on a test of any of the retracement levels. So far, all we’re seeing is short-covering. Without a closing price reversal bottom in place, it’s hard to tell if there is any real buying.
Besides the failure to overcome 1.1670, the next sign of selling pressure will be a break back under the old bottom at 1.1553. This could trigger a quick break into 1.1510. The daily chart is wide open under this minor bottom with 1.1312 the next major downside target.