


Bullish Signals Emerge Above Key Support
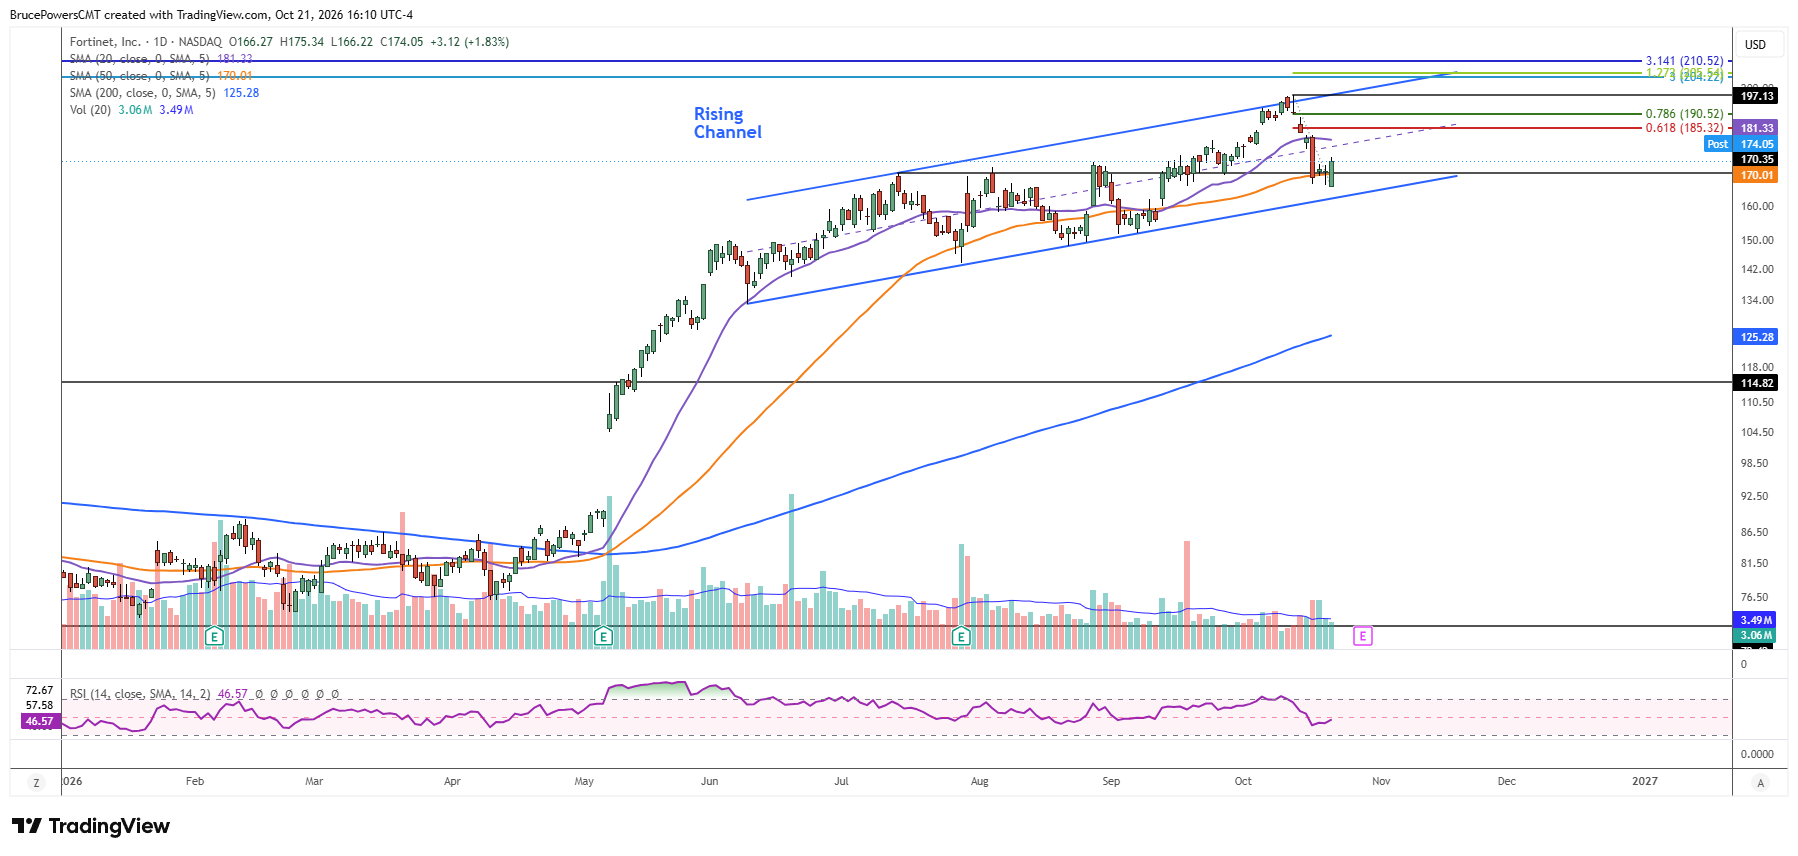
Fortinet, Inc. (FTNT), a cybersecurity company, remains in a strong bullish trend following a pullback to a new low of $166.22 on Wednesday. Buyers took back control from the low resulting in a three-day upside breakout above $171.31 and a reclaim of the 50-day moving average near $170. The day ended with a bullish engulfing candlestick pattern and a daily close above the 50-day moving average and the three-day high. Each sign adds to the bullish technical evidence. Successful tests of support during prior pullbacks also occurred near the same moving average, and a rally followed each time the average was reclaimed after a break below it.
Weekly Chart Reinforces Support Confluence
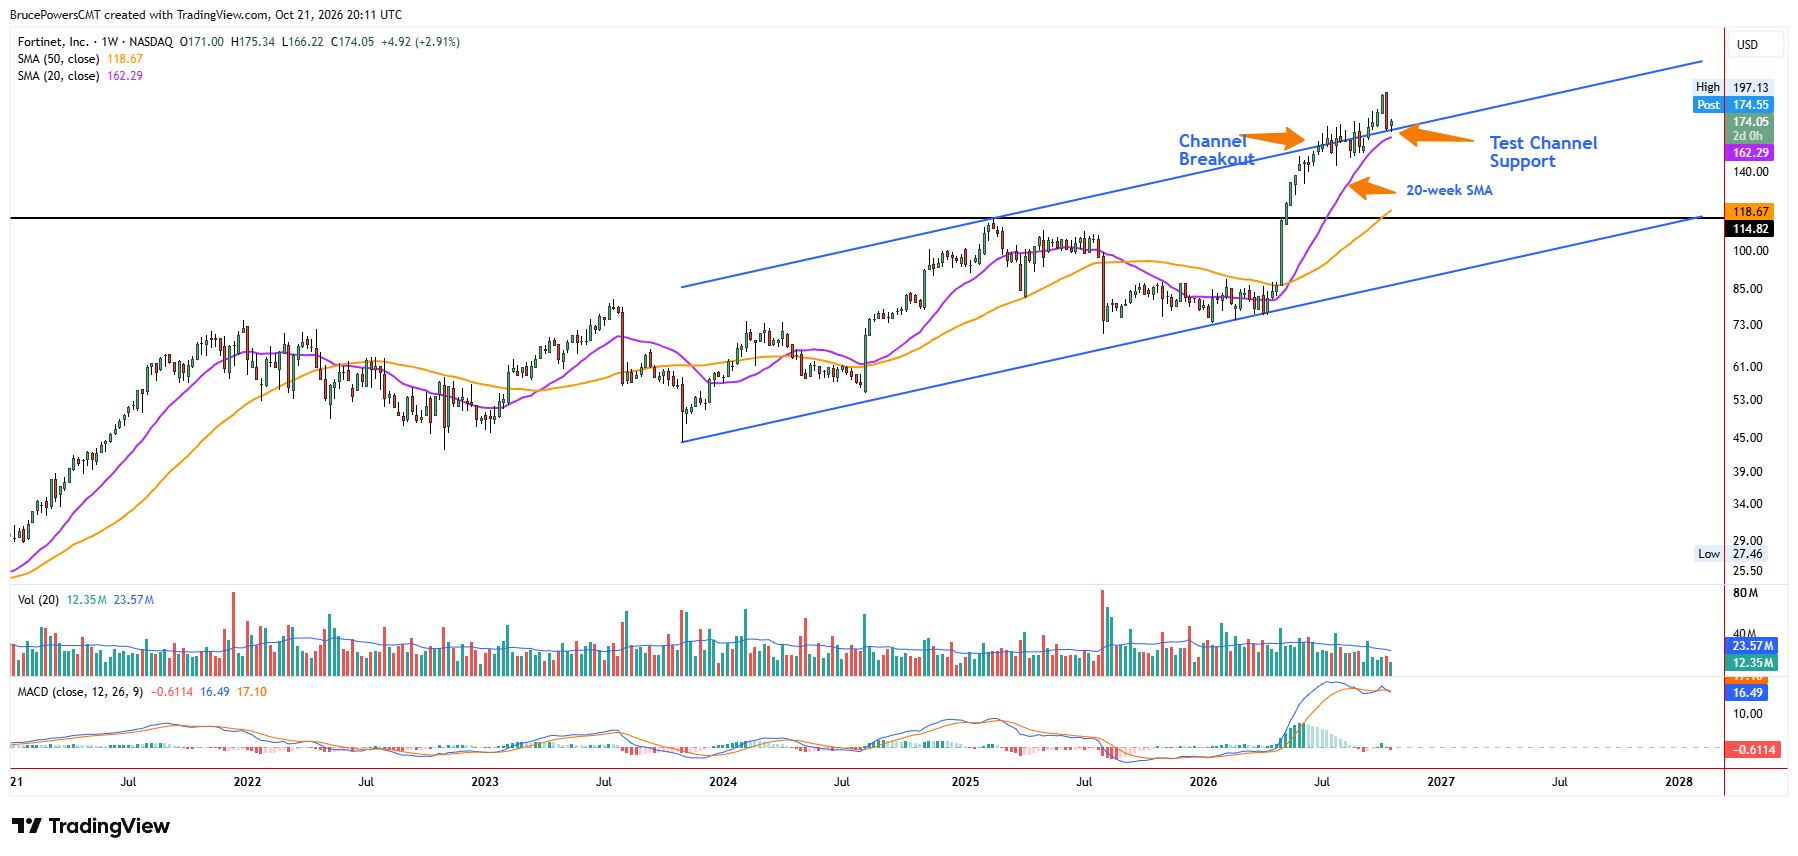
Moreover, support has been found near the initial high of the most recent consolidation base at $170.35. The confluence of support indicators near recent lows was followed by a bullish signal, suggesting that support has held and another leg up in the larger uptrend could begin. Also, the weekly chart adds to the significance of the support zone, as the pullback is testing support at the top boundary of a rising trend channel.
Breakout Risk Cuts Both Ways
An upside breakout began around a month ago before FTNT hit a peak of $197.13 last week, which was followed by the pullback. If support at the prior resistance line continues to act as support, that will be a bullish indication on the weekly timeframe, suggesting a bullish bias on the daily chart. In addition, a break below the level would move the stock back inside the wedge, which could be followed by further downside.
Trend Channel Offers an Upside Target
FTNT’s more recent advance has taken the form of a trend channel, with Wednesday’s low potentially marking the lower boundary of the channel, given the new bullish signs of strength. If the channel progresses an eventual test of resistance may occur near the upper boundary, with the recent peak of $197.13 representing a potential target.