


Earnings Rally Meets Resistance, but Support Holds
Galaxy Digital Inc. (GLXY), a digital-asset financial services and digital infrastructure company, reported its Q3 2026 results last Tuesday, October 27, before the market opened. The company’s stock responded with a sharp two-day rally to a high of $19.50 last Thursday, followed by a pullback that tested resistance near the 20-day moving average, around $17.46 currently and falling.
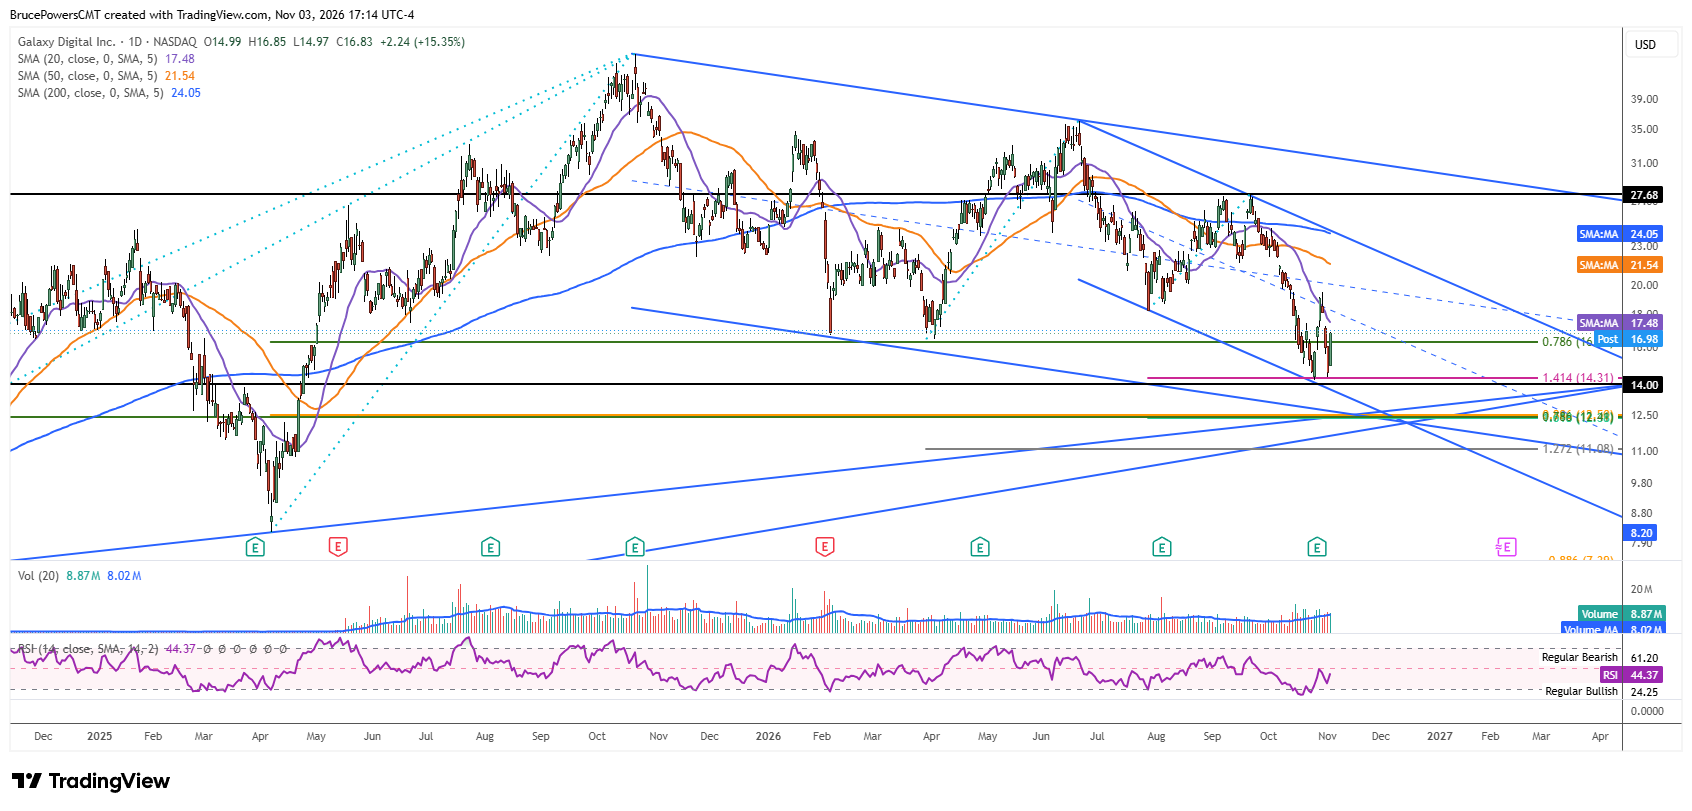
Sellers took control from that high, resulting in a sharp two-day decline to a higher swing low of $14.35 on Monday, relative to the recent corrective low of $14.19 reached a week ago Monday. The ability to hold above that prior low is important to the developing bullish reversal scenario.
Multiple Support Factors Strengthen Reversal Potential
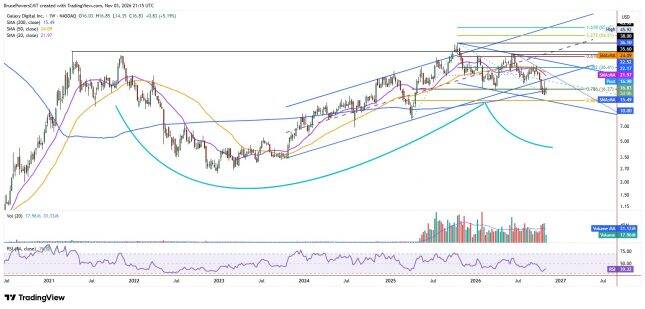
These moves established a potential double bottom in GLXY, provided support at $14.19 continues to hold. However, that pattern will not trigger until last week’s $19.50 high is recovered. Support near the two lows of $14.19 and $14.35 is reinforced by the lower boundary of a small declining channel that has formed inside a larger declining trend channel. There is also a July 2024 swing high that may provide additional support, along with the 141.4% (square-root-two) extension of the prior short-term advance. Also potentially significant is the 200-week moving average on the weekly chart, which defines dynamic support near $15.49.
Undercut-and-Run Pattern Adds to Bullish Case
A one-day bullish reversal signal triggered on Tuesday above Monday’s high of $15.03, further reinforcing the support zone and the potential for further upside to test key resistance levels. Although a rally would be countertrend, strength followed an undercut of the prior consolidation range, whose low of $16.43 may have shaken out weak holders as stops were triggered.
Therefore, a recovery above the $16.43 level would provide a bullish signal and indicate that a bullish undercut-and-run pattern may be developing. Tuesday’s close at $16.83 confirms the recovery of that level, strengthening the bullish implications of both the undercut-and-run pattern and the potential double bottom.
$19.50 Breakout Remains Key to Larger Recovery
However, if $14.19 fails as support, the next lower support level near $12.50 could be tested, potentially followed by the lower boundary of the larger declining channel. Conversely, if the $19.50 high from last week is recovered, the 200-day moving average, now near $24.05, becomes an upper target, with the possibility of a further advance above that average.
If you’d like to know more about technical analysis and how traders use it, please visit our educational area.