


The US dollar index dropped to 101.30 as early US midterm election results emerged, which created rebound in gold (XAU) prices on Wednesday. However, the gold and silver (XAG) prices still face pressure from the high expectations for the rate hike in December. Oil prices started to correct lower this week, but prices are still high. Any new escalation in the Middle East may further drive prices higher. The uncertainty in the Middle East keeps the oil market volatile.
The market is now watching for ADP jobs report and ISM services survey on Wednesday. The strong hiring and persistent price pressure may increase expectations for high interest rates and keep pressure on both metals. But weak readings may ease these pressures and create rebound from support areas. I think that soft data from the US may help the recovery in gold and silver prices, but strong figures may leave prices under pressure.
Gold Price Forecast: Recovery Faces Resistance at $4,000
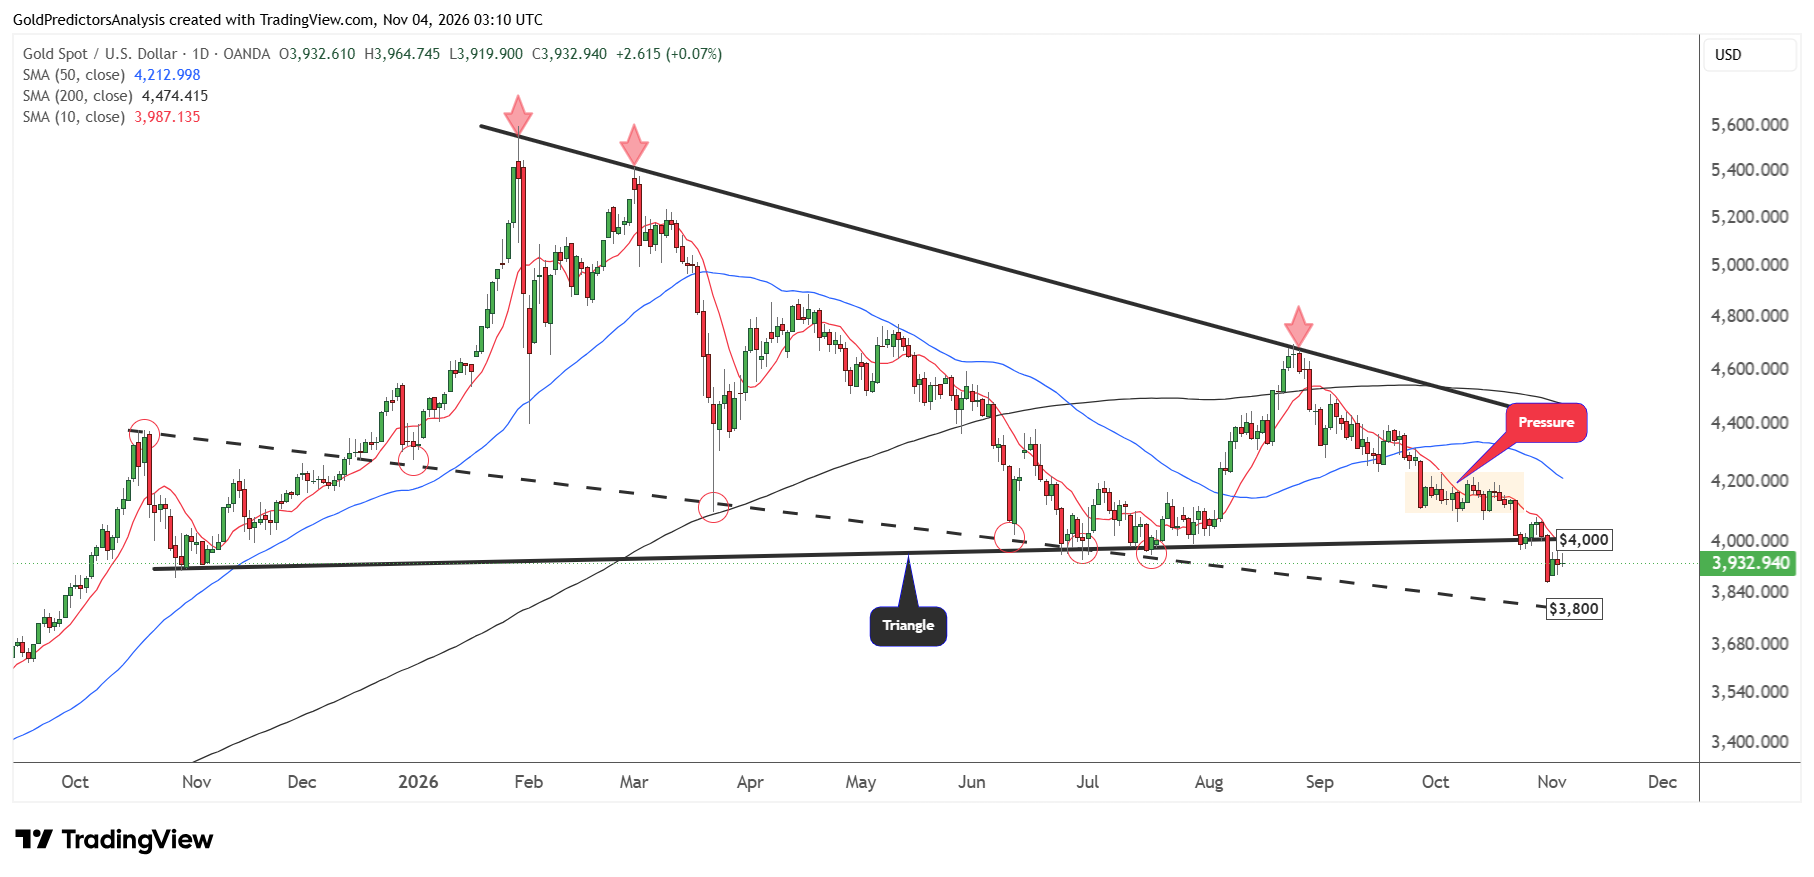
The daily chart for spot gold shows that the price remains under pressure after breaking the triangle pattern at the $4,000 level. The price produced an inside day candle on Tuesday. The price range of this candle was between $3,895 and $3,971.
This suggests that if the price breaks below the $3,895 level on Wednesday, it will likely trigger deeper correction. But a break above the $3,971 level may push the price towards the $4,000 area.
The immediate support in the gold market remains at $3,800. A break below $3,800 may push prices further down towards the $3,500-$3,600 area. On the other hand, a recovery above $4,000 may open the way for further upside towards the $4,200 level.
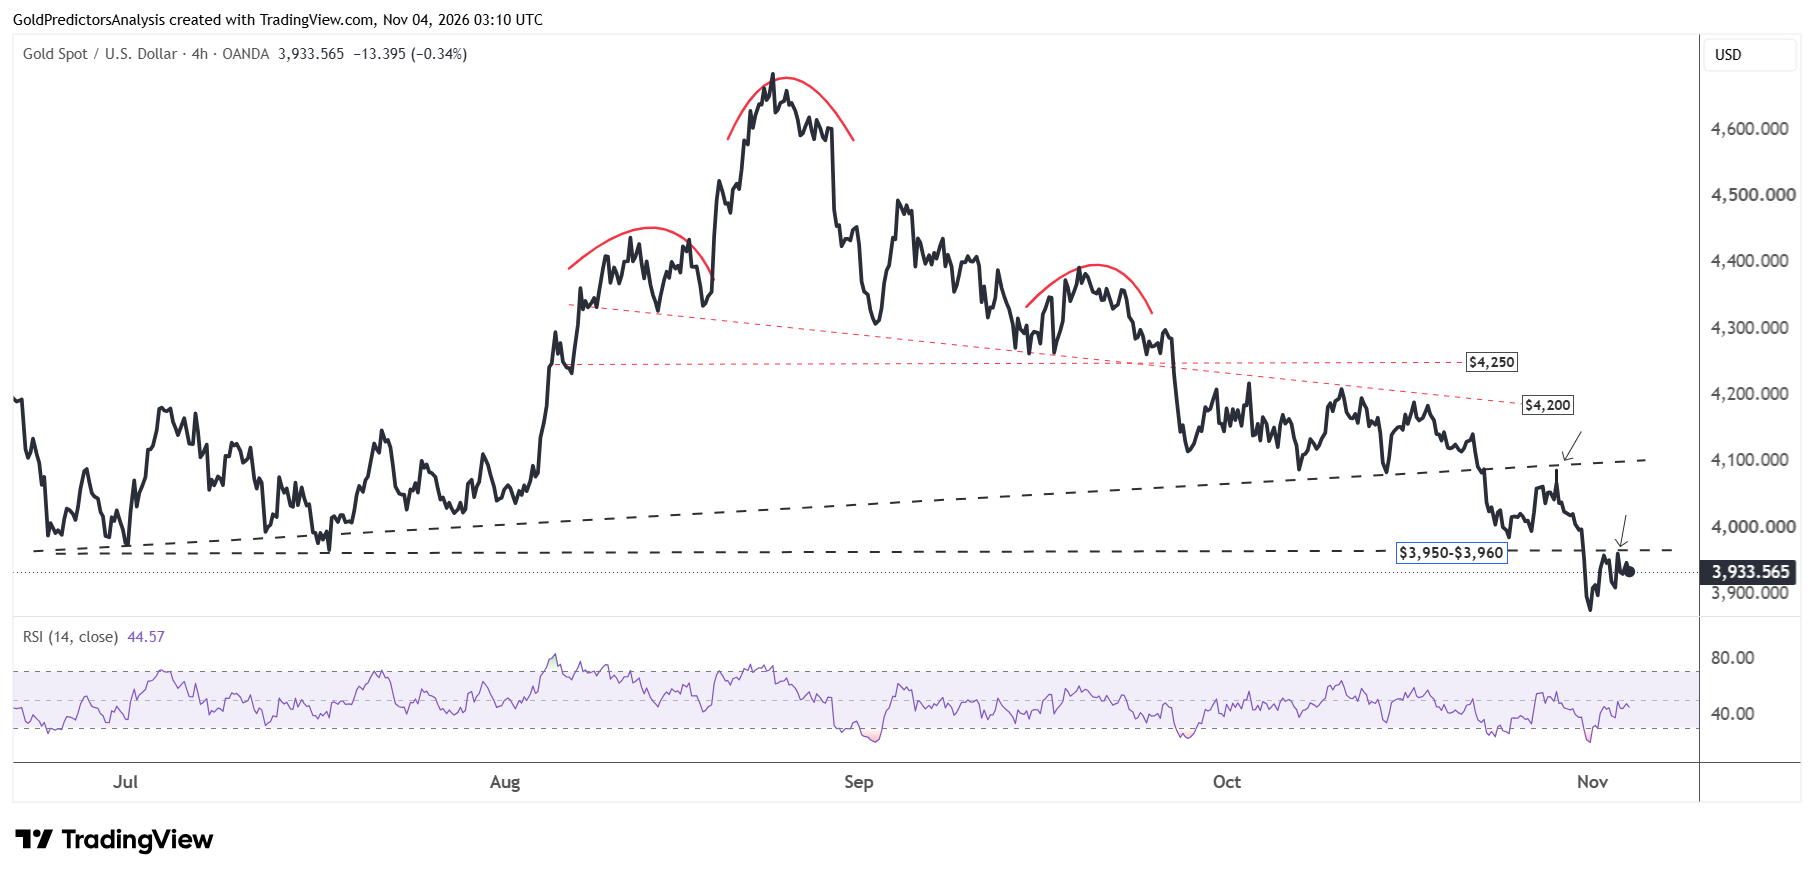
The 4-hour chart for spot gold also shows that the price remains under bearish pressure after breaking below the $3,950 level. The immediate resistance after the breakdown was the $3,960 level. This level was reached on Tuesday.
Now the prices are again consolidating at lower levels and looking for the next move. A break above $3,971 may push the price to the $4,000-$4,100 area. But the formation of negative price action in August and September suggests that the gold price remains within negative trend in the short term.
Gold Price Forecast
Every new Gold analysis as it publishes, today's technical signal and key levels, live price — on one page.
See all Gold forecastsSilver Price Forecast: A Break Below $48 Could Target $45–$46
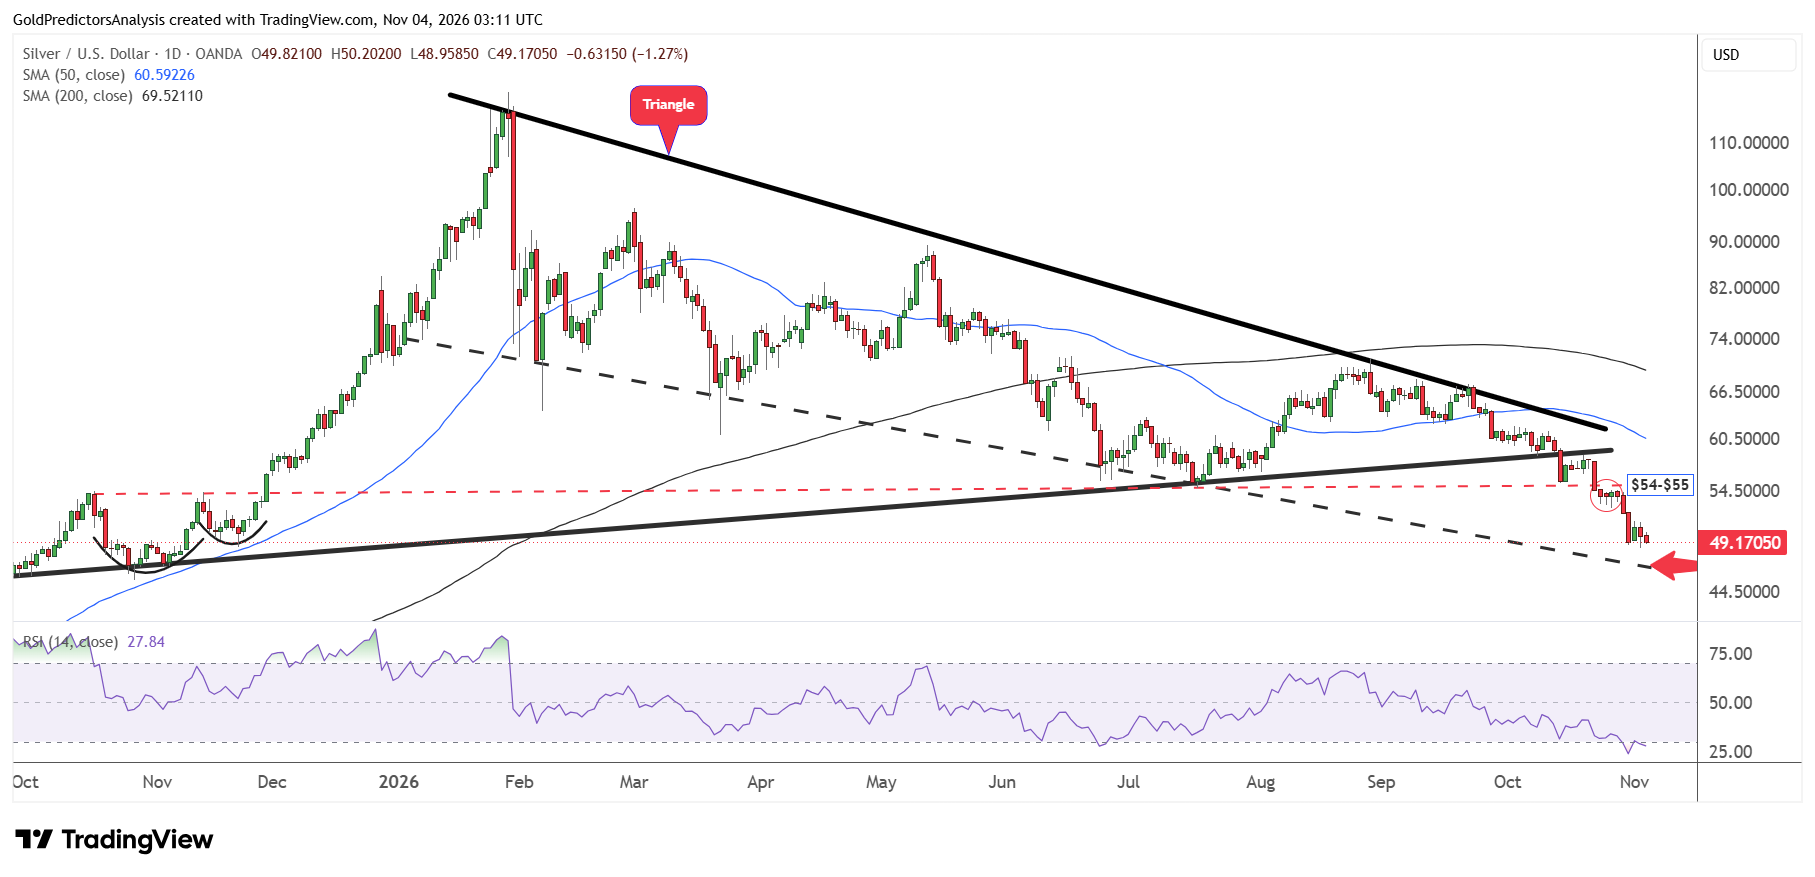
The daily chart for spot silver shows that the price remains under bearish pressure after the breakdown below $54. This breakdown suggests that the price may continue to drop toward the descending trend line at $45-$46.
A break below $45 may trigger deeper correction toward the $40 region. But the price needs to break above $55 to open the way for further upside toward the $60 area. As long as the price remains below $55, the possibility of further downside toward $45 is high.
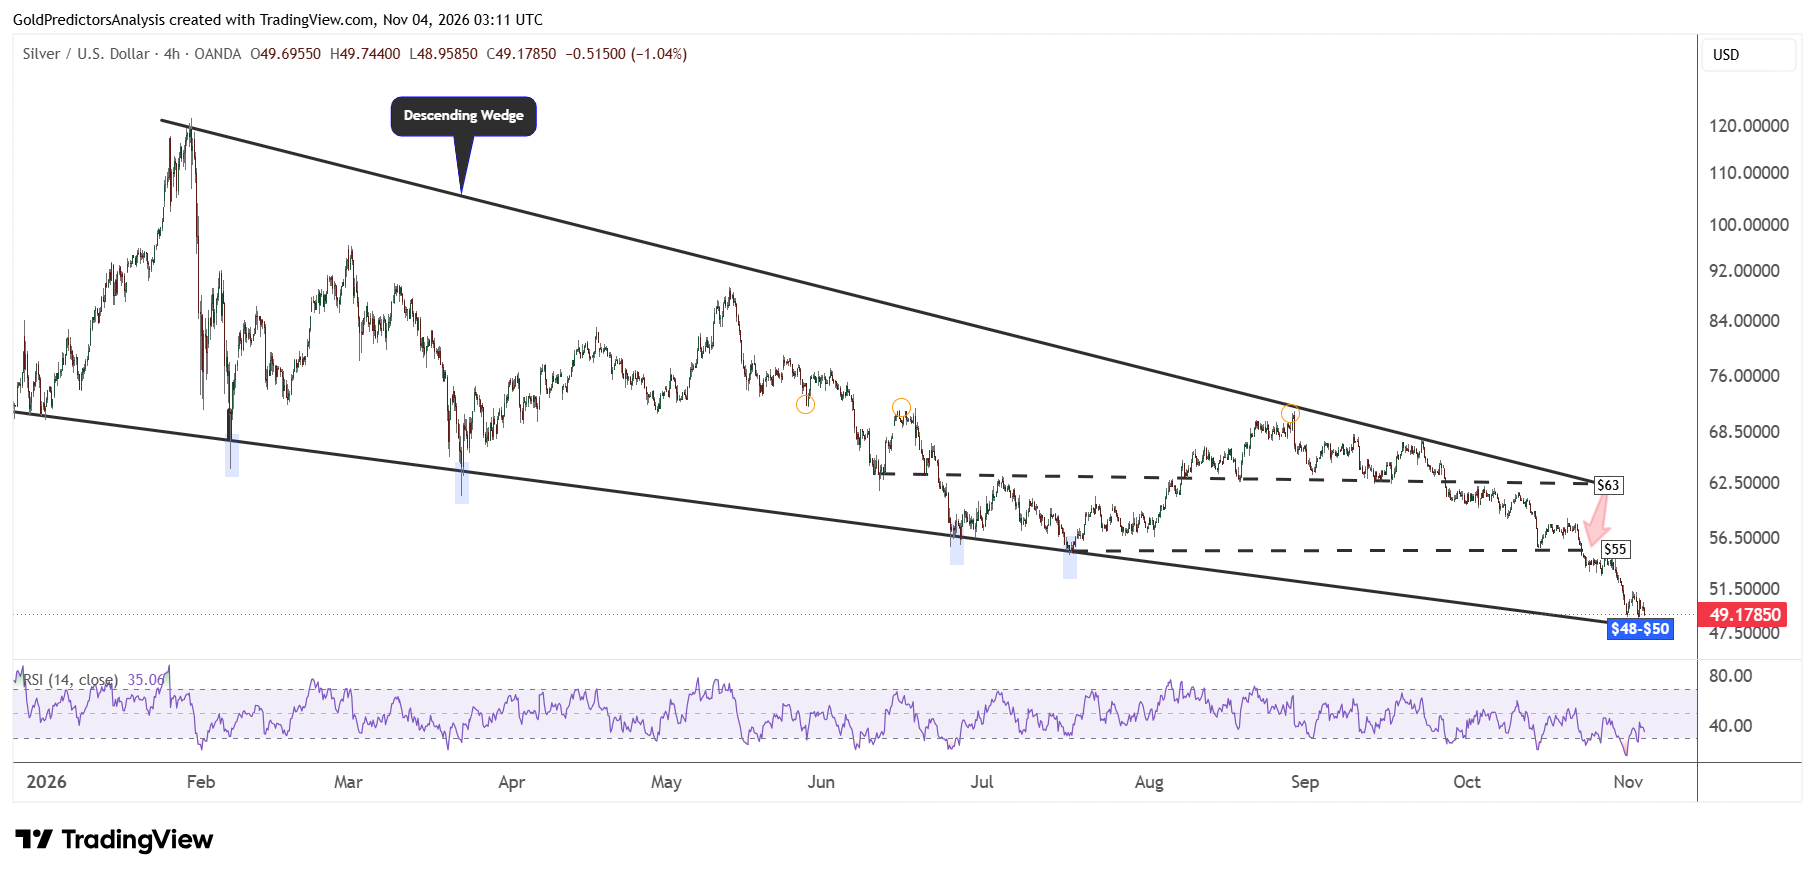
The 4-hour chart shows that the price is now approaching the key support level in the short term near the $48-$49 region. This support is highlighted by descending wedge pattern that stretches from the highs of January 2026.
A break below $48 may trigger deeper correction toward the $45-$46 region. The price needs to recover above $51 to open the way for further upside towards the $55 region.
Gold-to-Silver Ratio: Could a Peak Signal a Bottom for Metals?
The bearish pressure in gold and silver prices is also evident in the gold to silver ratio. The ratio continues to surge toward the key resistance areas which shows that gold is outperforming silver. Historically, the formation of peaks in the gold to silver ratio has been associated with major bottoms in gold and silver prices.
The strong rally in the ratio and bearish pressure in gold and silver prices suggest that when the ratio produces a peak, gold and silver prices may form a bottom.
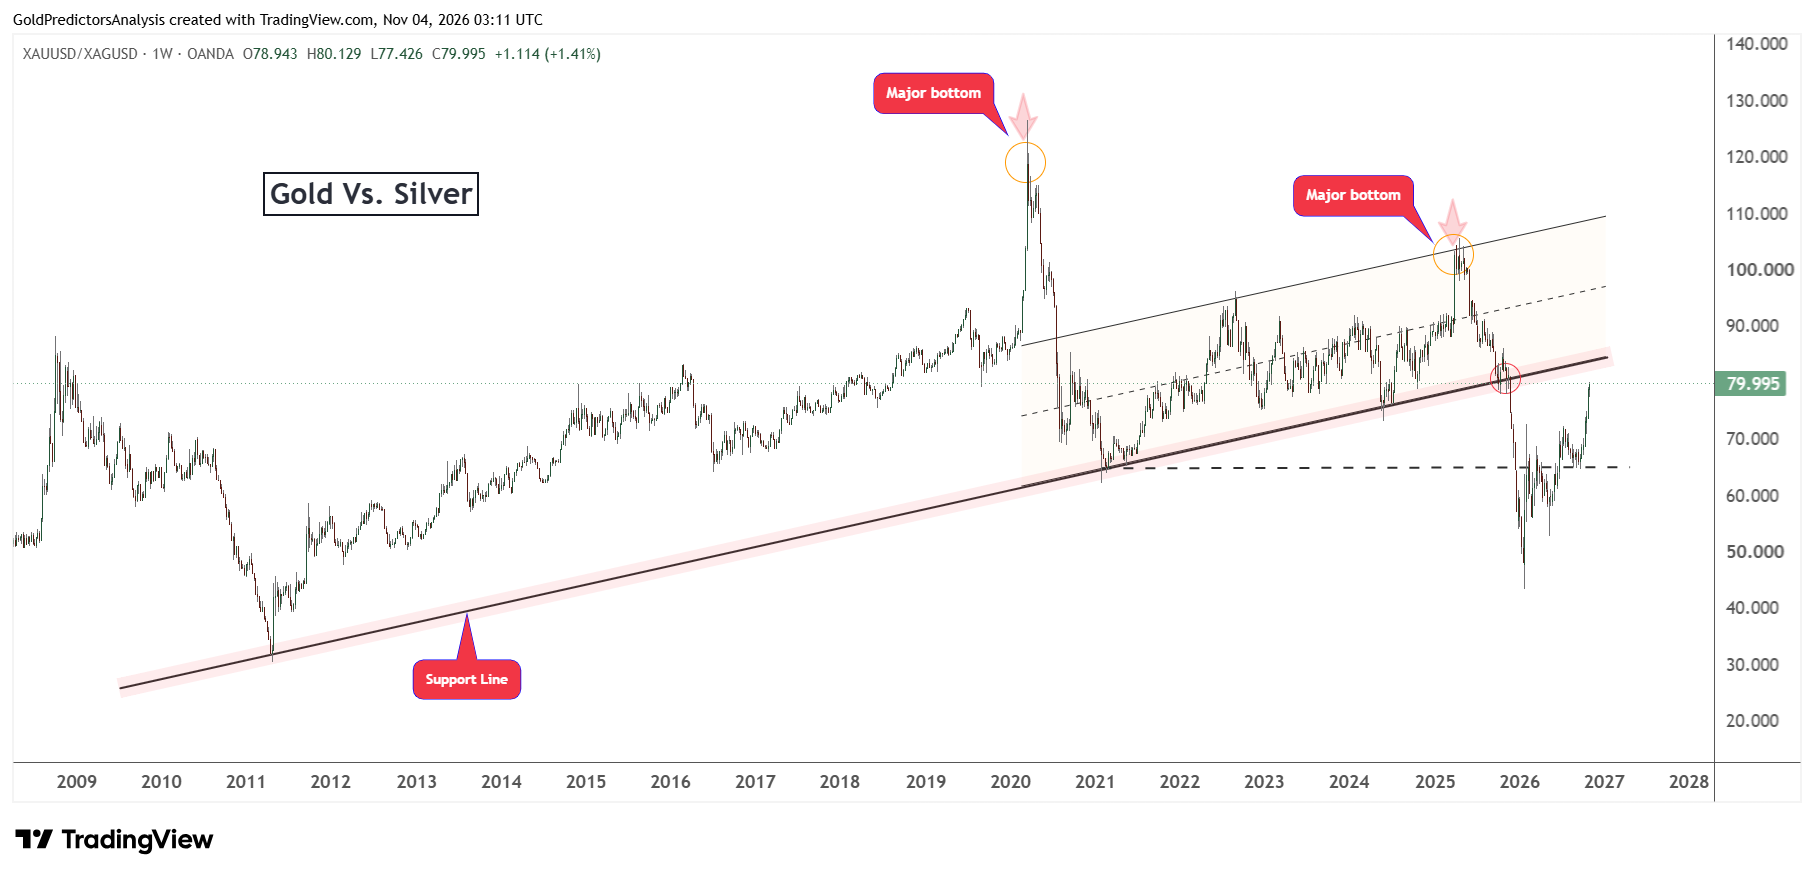
The ratio of gold to silver has the immediate resistance near the 83-84 region. A break above 84 will likely open the way for further upside to the 90 area. But if the ratio produces a peak near 84-85 and drops below the 77 level, it will likely increase the possibility of a peak in the ratio.
What to Watch Next in Gold and Silver
The market still expects the Fed to hike the interest rate in December with a 78% probability despite the correction in oil prices this week. These expectations keep gold and silver prices under pressure below the key support areas.
The market is now watching for the ADP employment change and ISM services PMI on Wednesday. The nonfarm employment data on Friday will likely be the key event of the week. If the US jobs data is soft, the US dollar may continue to drop and support gold prices. But strong data may continue the selling in metals.
In my view, gold and silver prices remain under bearish pressure as long as they remain below $4,000 and $51, respectively.
Read more: Tech Sell-Off Raises Risk of a Drop to $45 in Silver