



Gold (XAU) prices rebounded in early Asian trading on Monday after the strong sell-off on Friday last week. This rebound may have been triggered by the correction in the oil market on Monday due to progress in talks to end the conflict between the US and Iran.
The correction in oil prices can reduce inflation fears and impact expectations for interest rates. But the gold price still remains below the major support level of $4,000, which suggests negative pressure. The market still expects 75% chance of another rate hike by the Fed in December, as per the FedWatch tool.
I think that the correction in oil prices may create rebound in gold prices in the short term, but expectations for further tightening by the Federal Reserve may limit the rebound in the gold market.
Silver (XAG) prices also rebounded on Monday but still remain below the key level of $50. The strong drop in silver prices occurred due to the technology sell-off as investors questioned the returns on AI spending.
In my view, gold and silver prices may rebound from the support areas as the markets are exhausted, but the rebound may be limited in the short term due to bearish pressure.
Gold Price Forecast: Break Below $4,000 Puts $3,800 in Focus
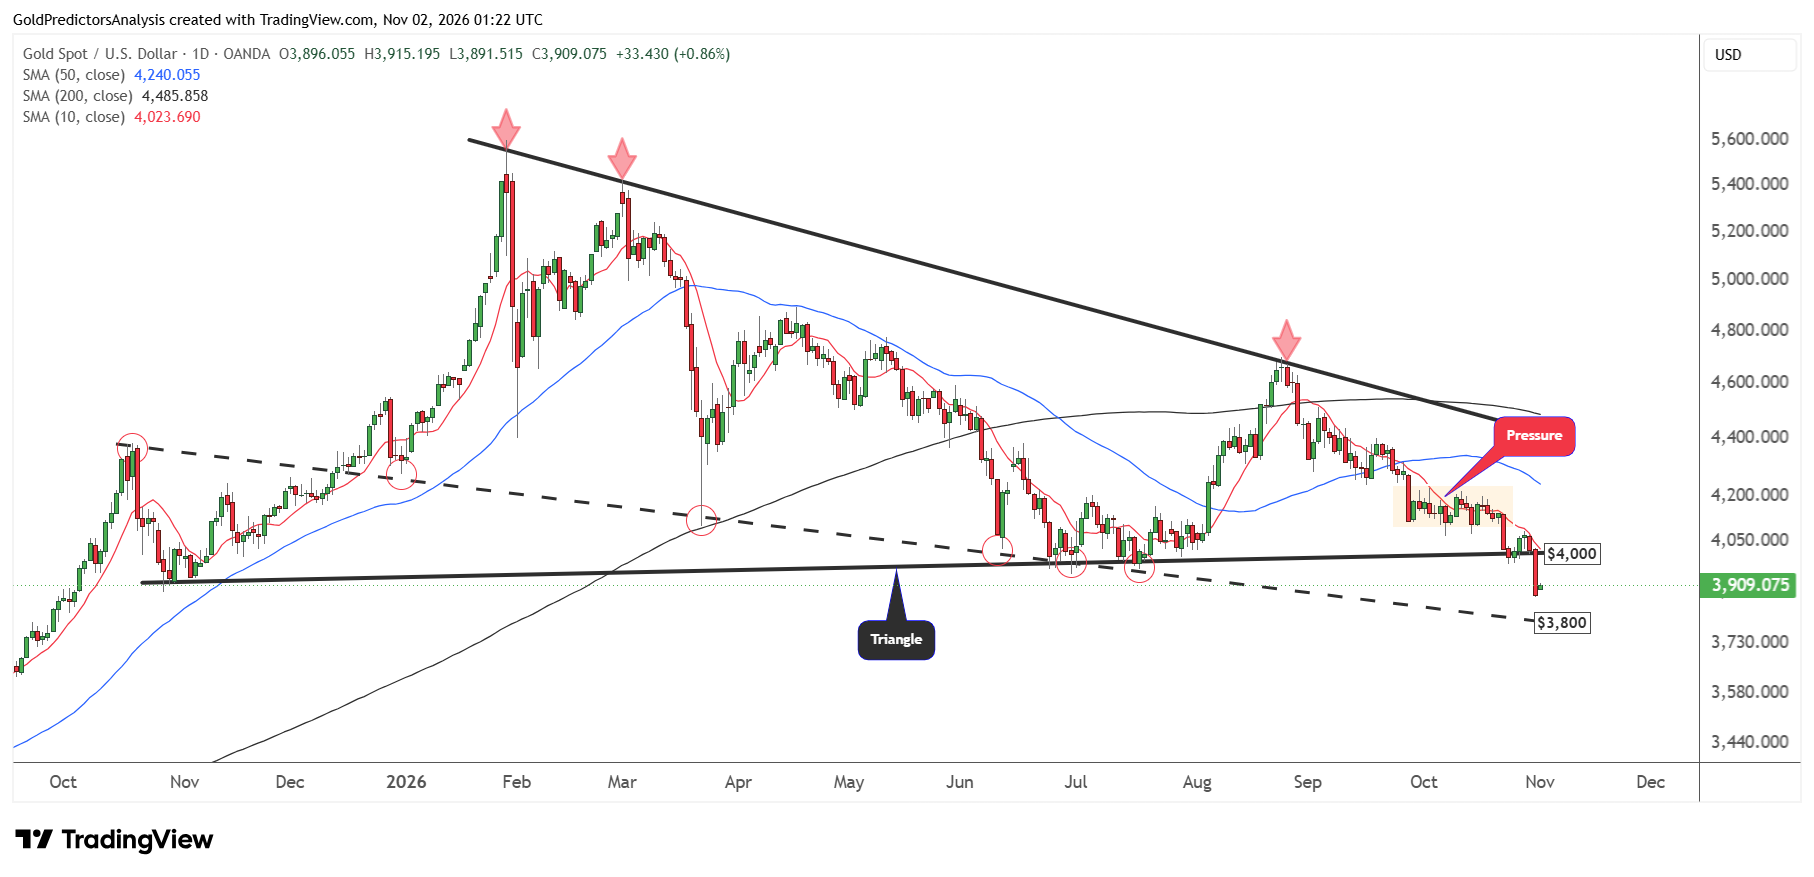
The daily chart for spot gold shows that the price has broken below the $4,000 level and lost 3.60% on Friday. This breakdown suggests that the immediate support for spot gold remains near the $3,800 level. This support is defined by the descending trend line that stretches from October 2025.
A break above $4,100 will likely suggest a recovery toward $4,250. The price needs to break above $4,400 to suggest meaningful bottom and start a rally toward the $5,000 area. But a break below $3,800 will likely suggest a deeper correction toward the $3,500-$3,600 area.
Overall, the breakdown below $4,000 is major and suggests a negative trend in the short term as long as the price remains below $4,100.
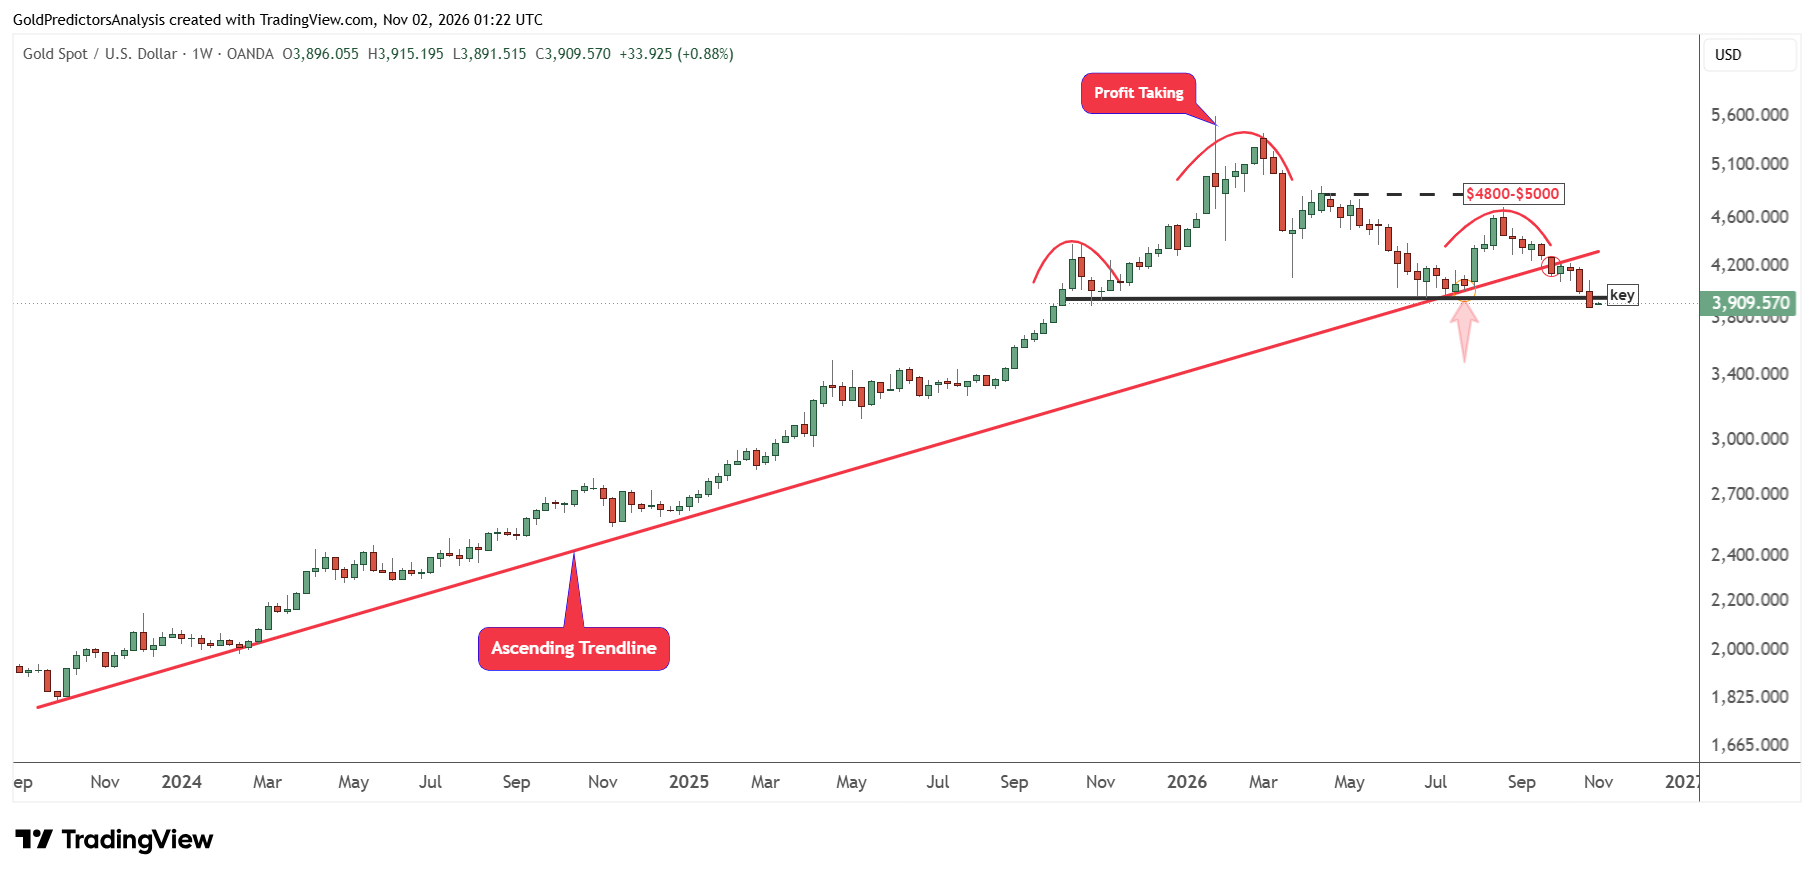
The weekly chart for spot gold shows that the price broke below the ascending trend line in September 2026 that stretches from the lows of October 2023. After breaking this trend line, the price has broken below the $4,000 level, which is considered a key area.
The key level of $4,000 was also the neckline of head and shoulders pattern. This breakdown suggests that the price may continue to drop toward the $3,500-$3,600 area.
Gold Price Forecast
Every new Gold analysis as it publishes, today's technical signal and key levels, live price — on one page.
See all Gold forecastsSilver Price Forecast: Can $48 Support Spark a Rebound?
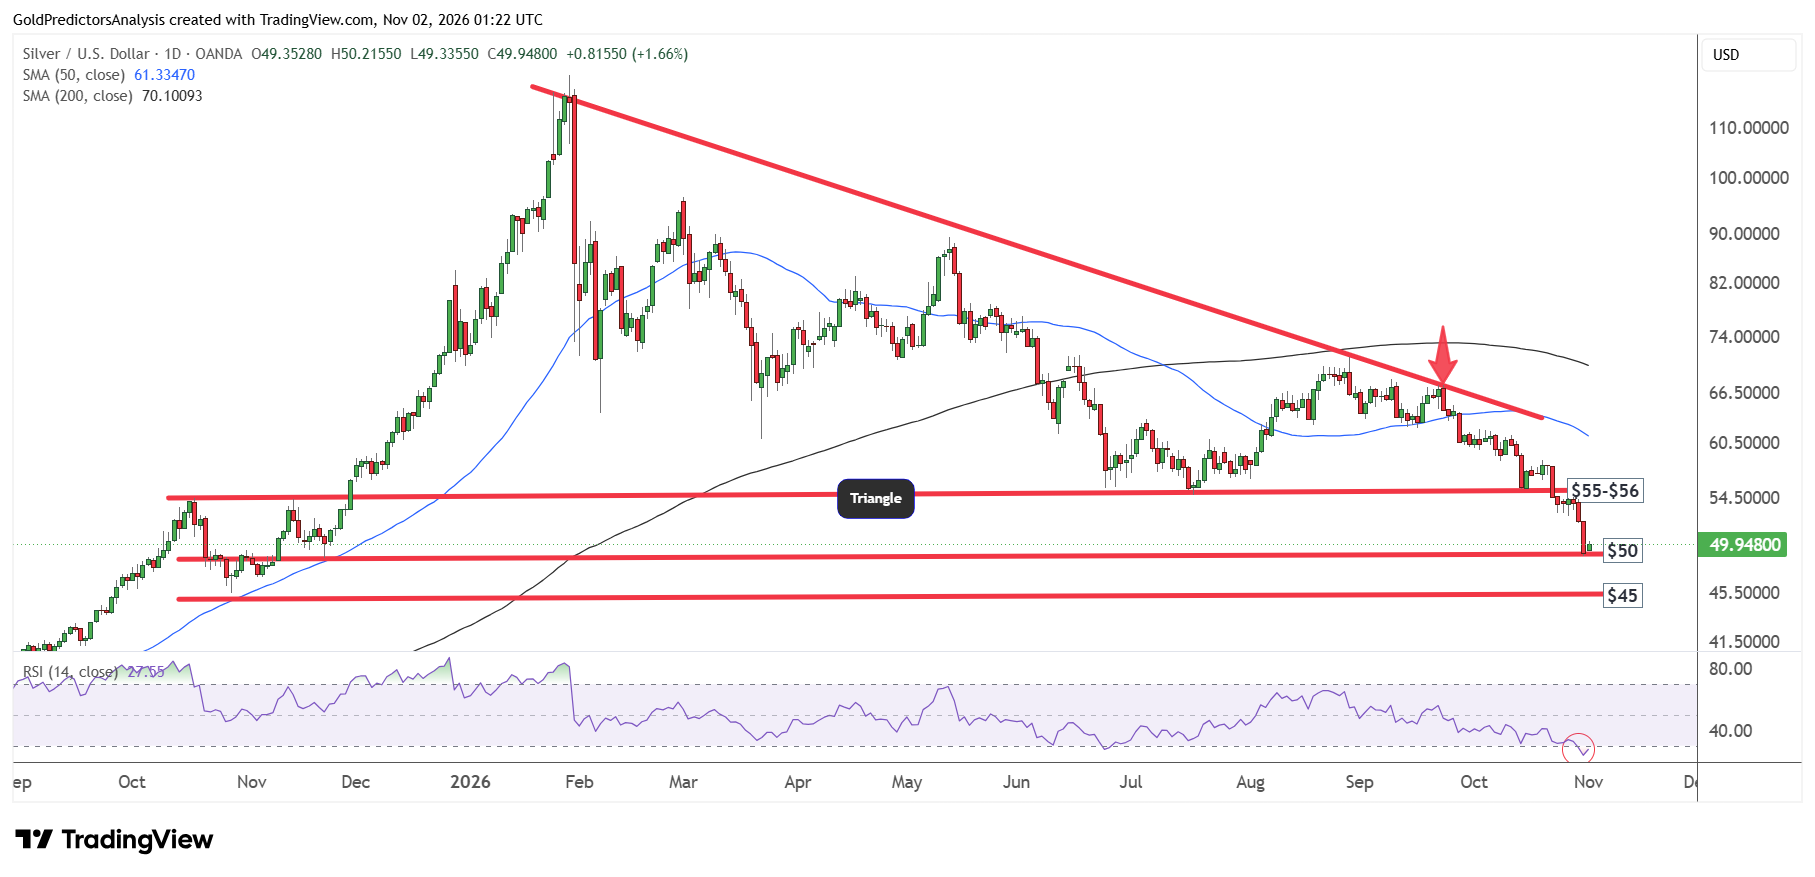
The daily chart for spot silver shows that the price dropped below the key support of $50 after breaking below the $55 area and remains in a strong bearish trend. A break below $49 will likely suggest another drop toward the $45 area.
The RSI indicator shows that the price has now reached oversold levels in the short term and suggests a rebound from current levels. But the monthly, weekly and daily candles for silver suggest continued weakness in the short term.
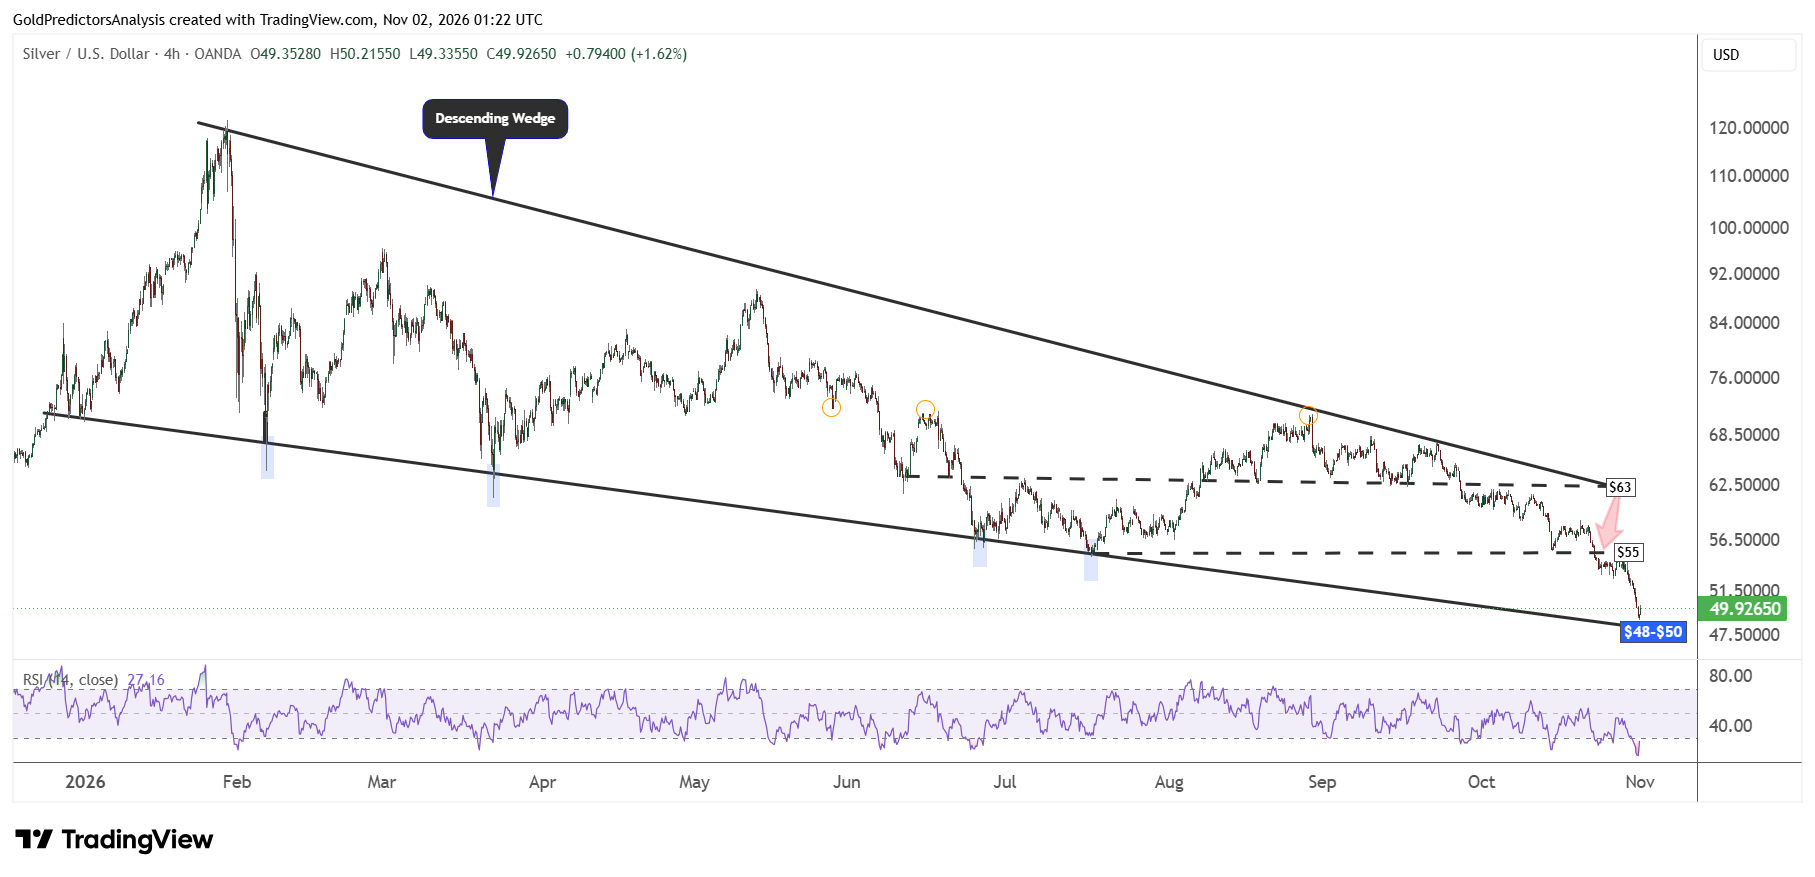
Despite this negative close, the 4-hour chart shows an important support level in the short term. The chart below shows the formation of descending wedge pattern from the highs of January 2026. This support lies in the $48-$50 area.
If the price holds the $48 level, it may rebound toward $55. A confirmed break above $60 will likely confirm bottom and open the way for further upside toward $72.
Bottom Line
Gold and silver prices rebounded on Monday but remain below the key levels despite the correction in the oil market. The expectations of higher interest rates may keep the recovery limited in both gold and silver prices. In my view, the immediate resistance levels in gold and silver remain at $4,100 and $50, respectively. A break below last week’s low may push the gold and silver prices to $3,800 and $48, respectively.
Read more: Tech Sell-Off Raises Risk of a Drop to $45 in Silver