Gold (XAU) rose towards $4,183 in early Asian trading on Monday as US Treasury yields continue to drop. Concerns about AI funding needs and shipping risk in the Middle East pushed investors towards government bonds.
Oil prices also eased after Trump waived some Russian sanctions, but the policy remains under review. However, Brent oil trades above $108 and leaves the cost of energy elevated. In my view, the drop in Treasury yields could support further gains in both metals. But another surge in oil could revive fears of inflation and weaken the recovery.
The rate hikes by the Fed remain the main threat to the gold and silver outlook. US inflation increased to 3.7% in September from 3.4% in August. Gasoline prices jumped 9.1% during the month. The market expects a pause in October, but expectations for a hike in December still remain at 85%.
Fed Chair Kevin Warsh gave no clear signal about the next move. The high rates could strengthen the US dollar and renew pressure on both metals. Silver (XAG) could face additional pressure if the high cost of borrowing weakens industrial demand. This leaves room for a rebound but a strong recovery needs further relief in yields and the US dollar.
Gold Price Forecast: Recovery Faces Resistance at $4,200–$4,250
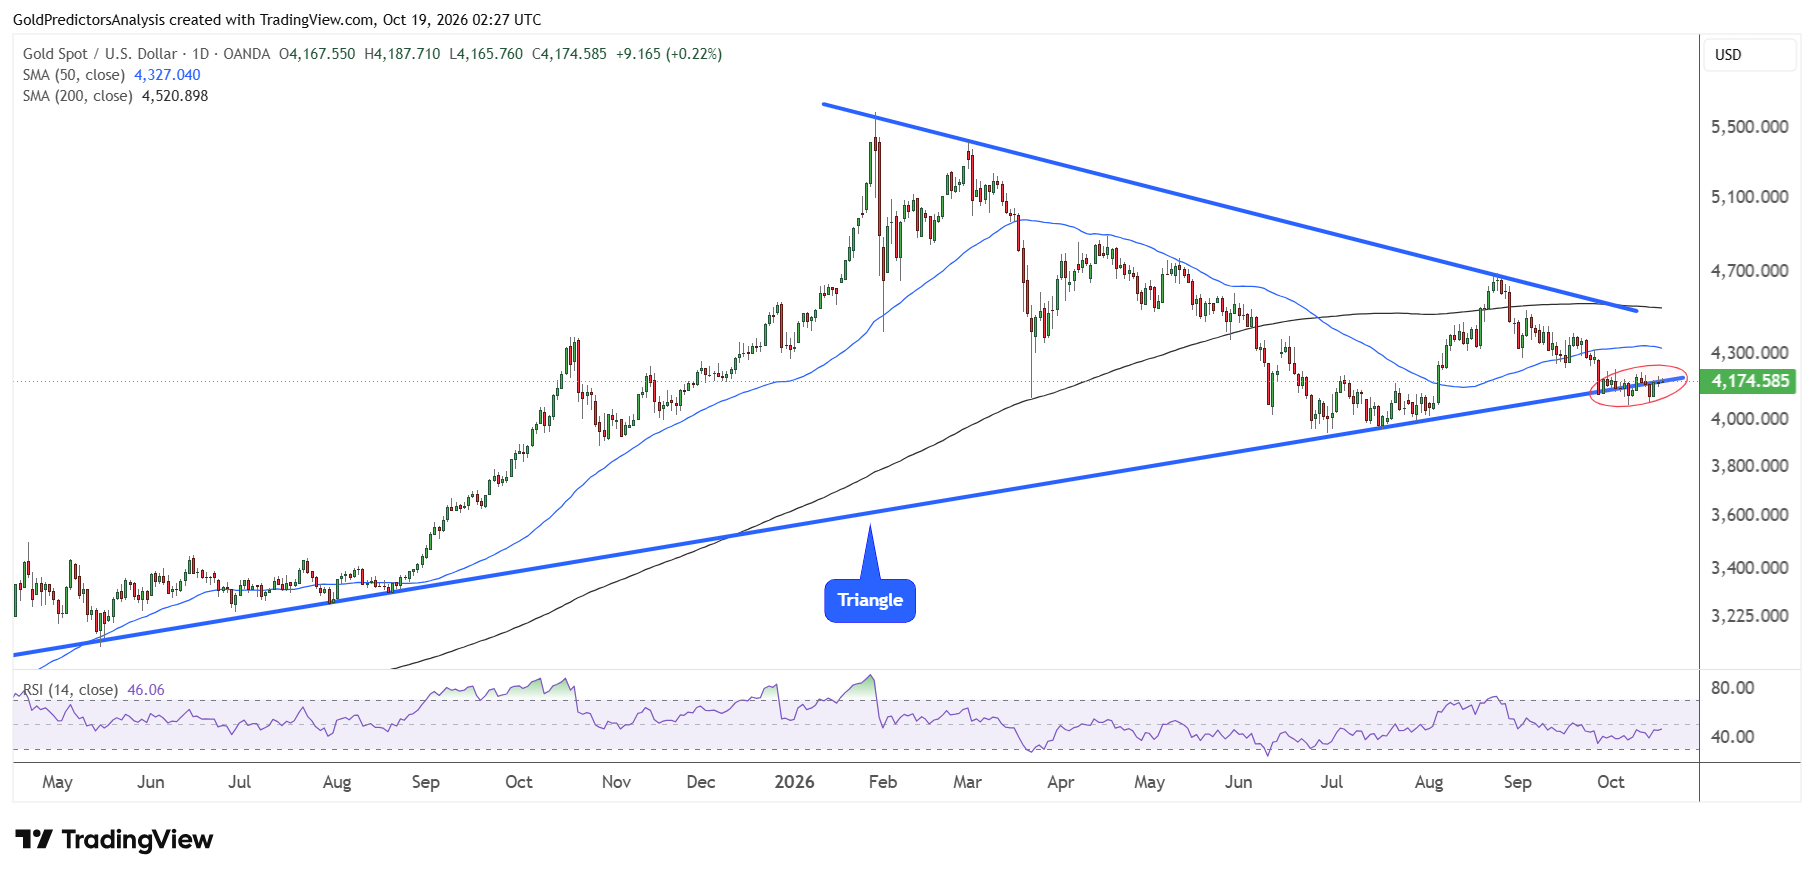
The daily chart for spot gold shows that the price is still trading at the support of the triangle pattern that has been forming since May 2025. The price remains below the 50- and 200-day SMAs, and the RSI remains below the midline. This suggests a negative trend and indicates that prices remain under pressure.
The immediate resistance in the gold price remains the $4,200 region. A break above $4,200 will likely push the price towards $4,330. However, the gold price needs to break above the $4,520 area at the 200-day SMA to indicate that the bottom is in and open the way for a strong rally in the gold market.
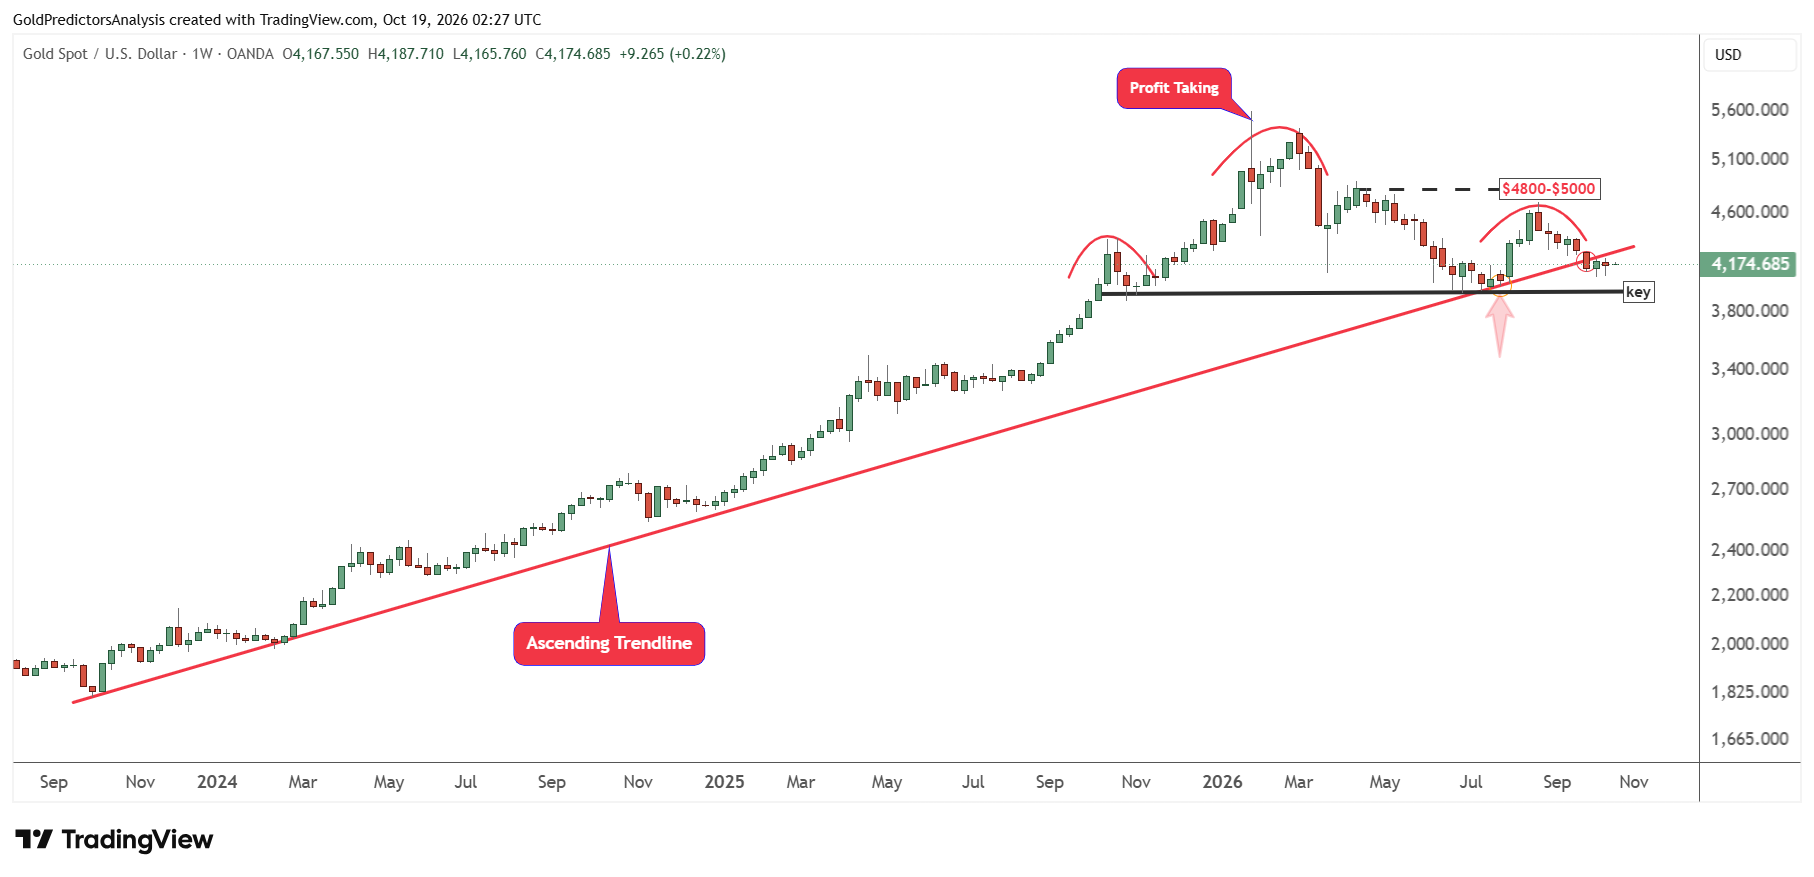
The weekly chart for spot gold also shows that the price is consolidating below the ascending trend line that stretches from the October 2023 lows. However, the price must break below $3,950 to indicate a strong drop and a deeper correction. However, if the price recovers successfully above the ascending trend line at $4,300, it will likely confirm a positive trend and open the way for further upside towards the $5,000 level.
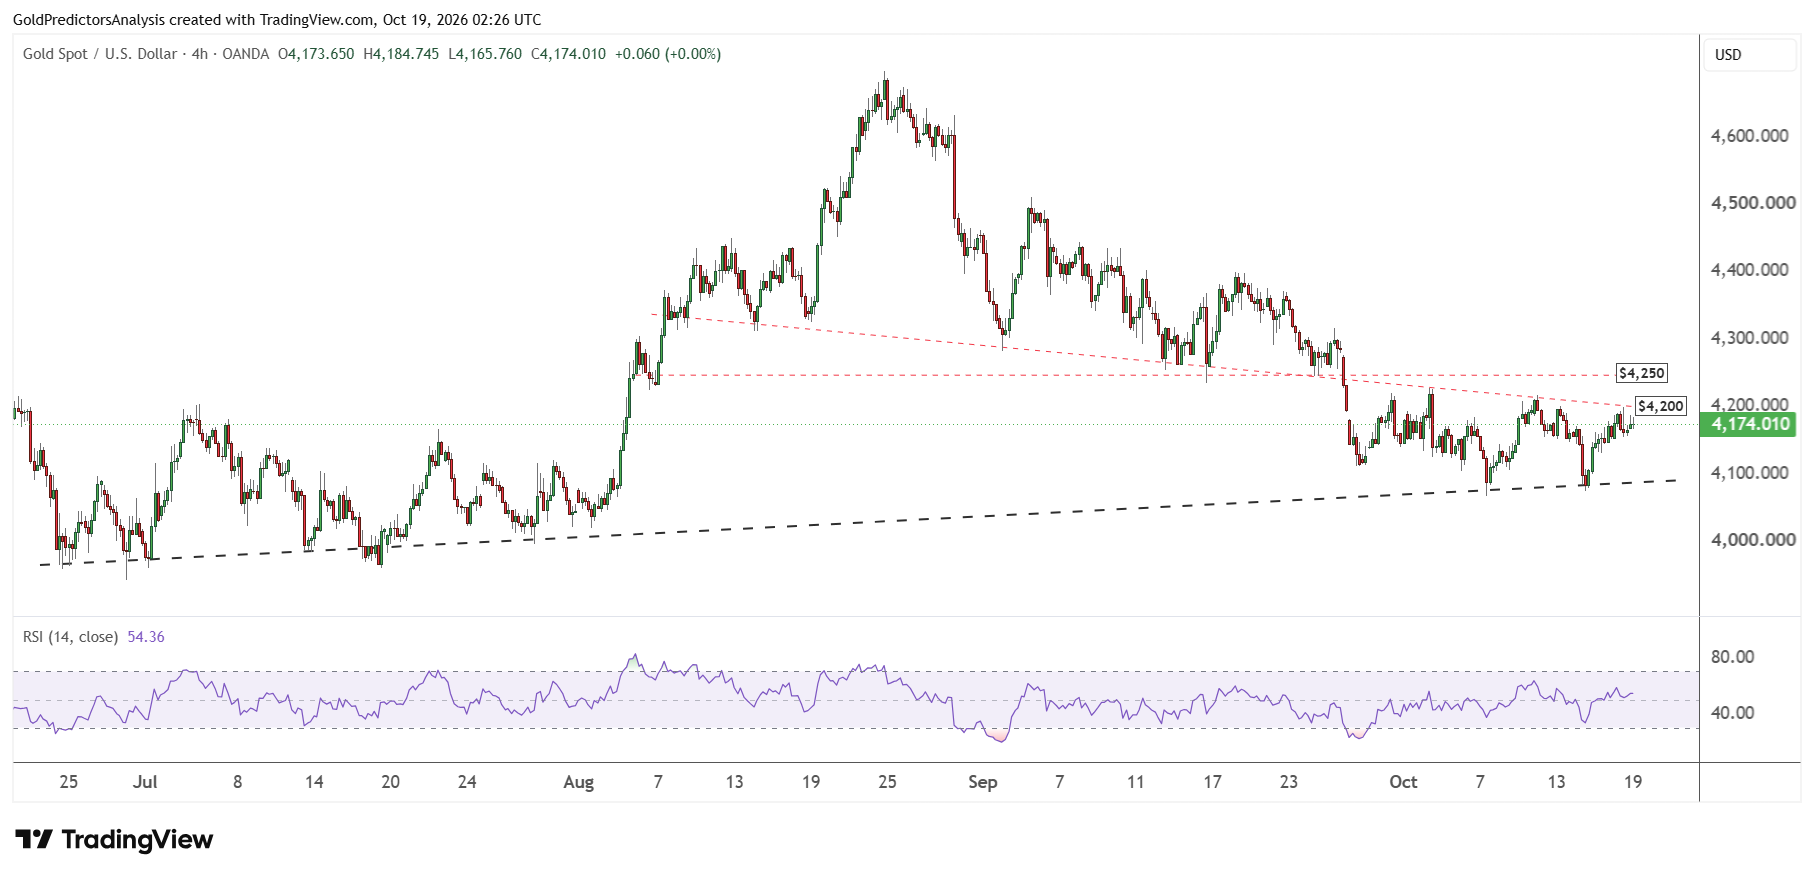
The 4-hour chart for spot gold also shows that $4,200 remains the key resistance in the short term. The price must break above the $4,200-$4,250 zone to signal a recovery in the short term. However, a break below the ascending trend line at $4,070 will likely push prices further down towards the $3,900-$4,000 area.
Gold Price Forecast
Every new Gold analysis as it publishes, today's technical signal and key levels, live price — on one page.
See all Gold forecastsSilver Price Forecast: Break Above $64 Could Open Path to $72
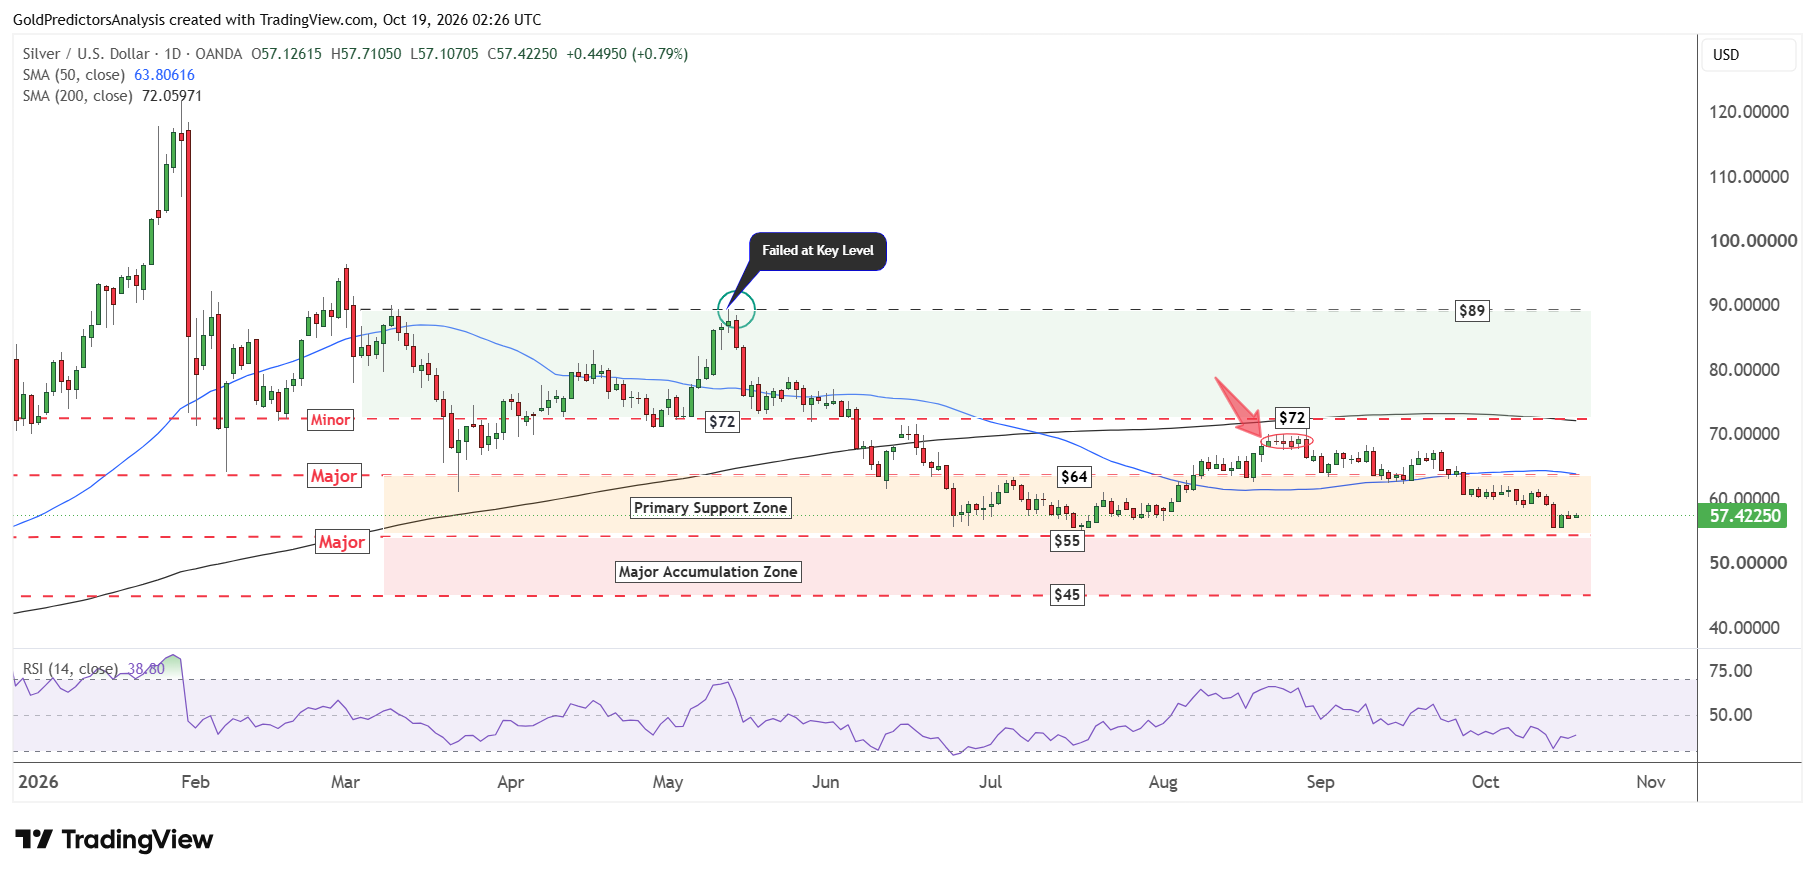
The daily chart for spot silver shows that the price produced a rebound from the $55 support zone. The price must break above the $64 area to open the way for further upside towards the 200-day SMA at $72. A recovery above $72 is required to push prices towards $89.
On the other hand, a break below $55 will open the way for a further drop towards the $45 support area. The RSI also entered oversold territory as the price reached the $55 support. However, a break below $55 will likely push the RSI into oversold territory. If the silver price continues to drop, it will likely mark a long-term bottom at the $45 support zone.
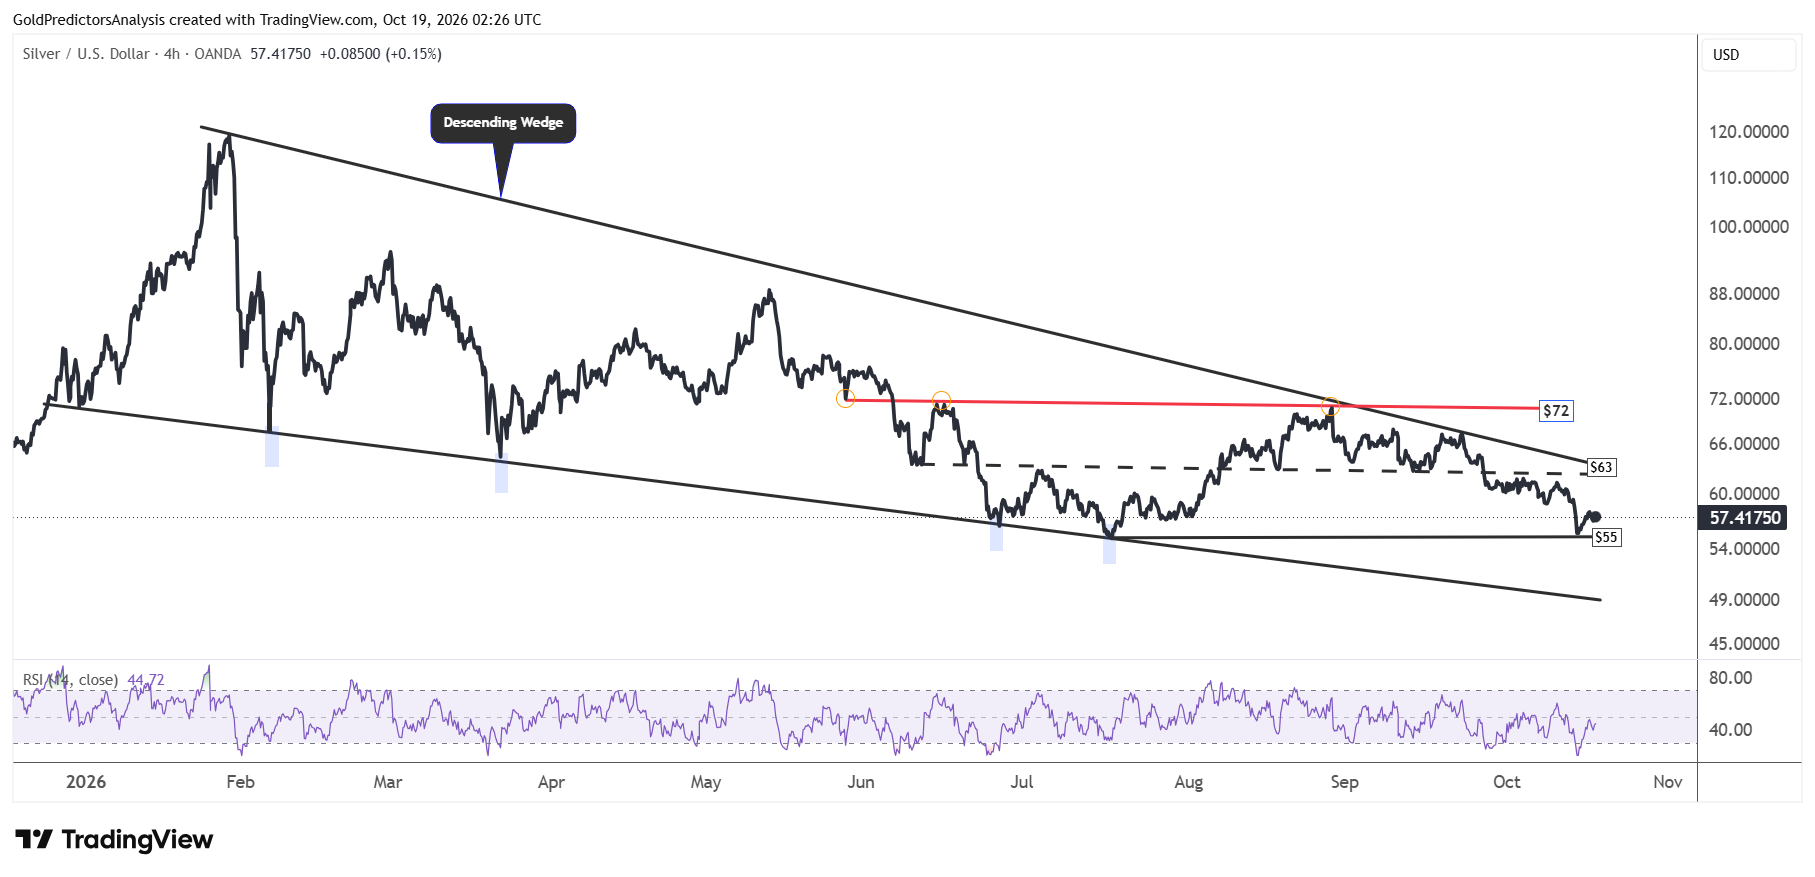
The 4-hour chart for spot silver also shows strong consolidation in prices above the $55 area. The price remains between $55 and $63. A break of either of these levels is required to push prices in the next direction.
A break below $55 may push prices towards the $50 area, as indicated by the lower boundary of the descending wedge pattern. However, a break above $63 is required to push prices up to the $72 region.
What to Watch Next
Gold and silver prices could extend their rebound if Treasury yields continue to drop. However, high oil prices and the risk of further rate hikes by the Fed could limit gains by keeping inflation pressures elevated. Gold needs to break above $4,200-$4,250 to strengthen the recovery, while silver needs to clear $63-$64. On the downside, a break below $3,950 in gold or $55 in silver could open the way for deeper losses. Both metals need further relief in yields and the US dollar to build a stronger recovery.
Read more: Falling Yields Fuel Rebound in Gold and Silver Despite Hot PPI