


Gold (XAU) price dropped on Thursday and lost over 2.80% to reach the key support level of $4,000. Silver (XAG) price also dropped over 5% on Thursday and broke the $55 support. This pressure in gold and silver prices was seen due to the positive movement in oil prices, which have gained after the attacks in Saudi Arabia. This situation raised supply concerns in the Middle East.
The high cost of fuel can keep inflation high and put pressure on the Federal Reserve to maintain the tight policy. The markets expect the Fed to maintain the current target range in October, but the expectation of a rate hike in December still remains high. These expectations keep the pressure on gold and silver prices in the short term.
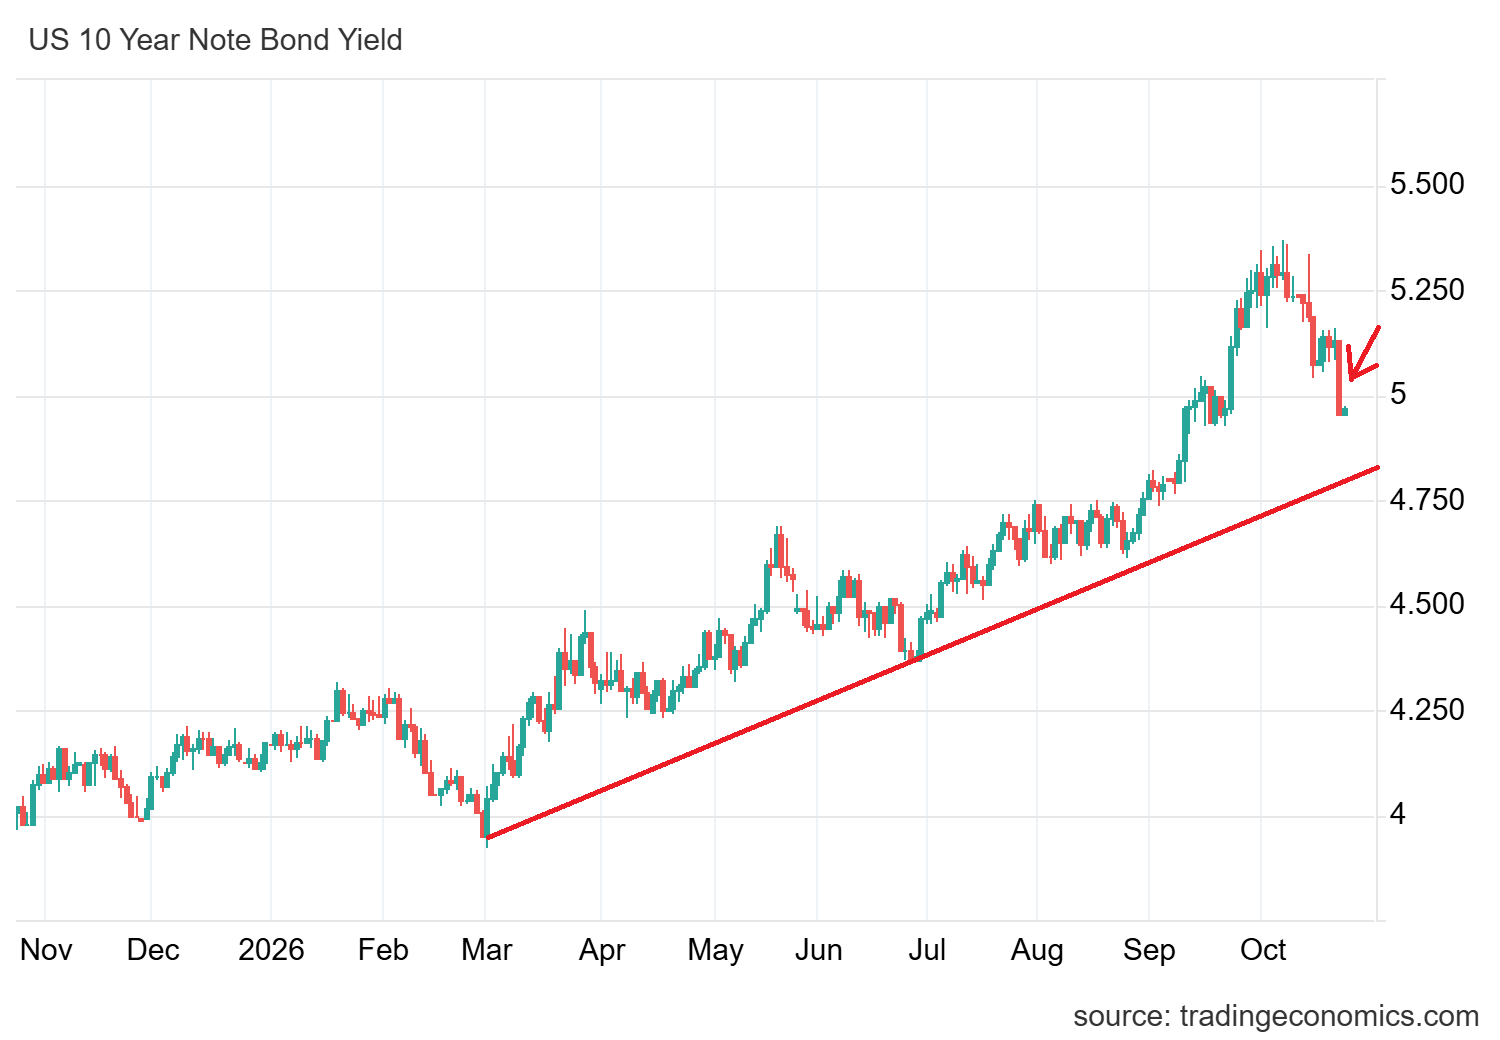
On the other hand, the 10-year US Treasury yields also dropped to 4.95% on Thursday as investors sought safety in bonds. In my view, the correction in oil prices may help a recovery in gold from the $4,000 level. However, if there is further selling across markets, this could limit a recovery ahead of the Federal Reserve meeting next week.
Gold Price Forecast: $4,000 Support Faces Breakdown Risk
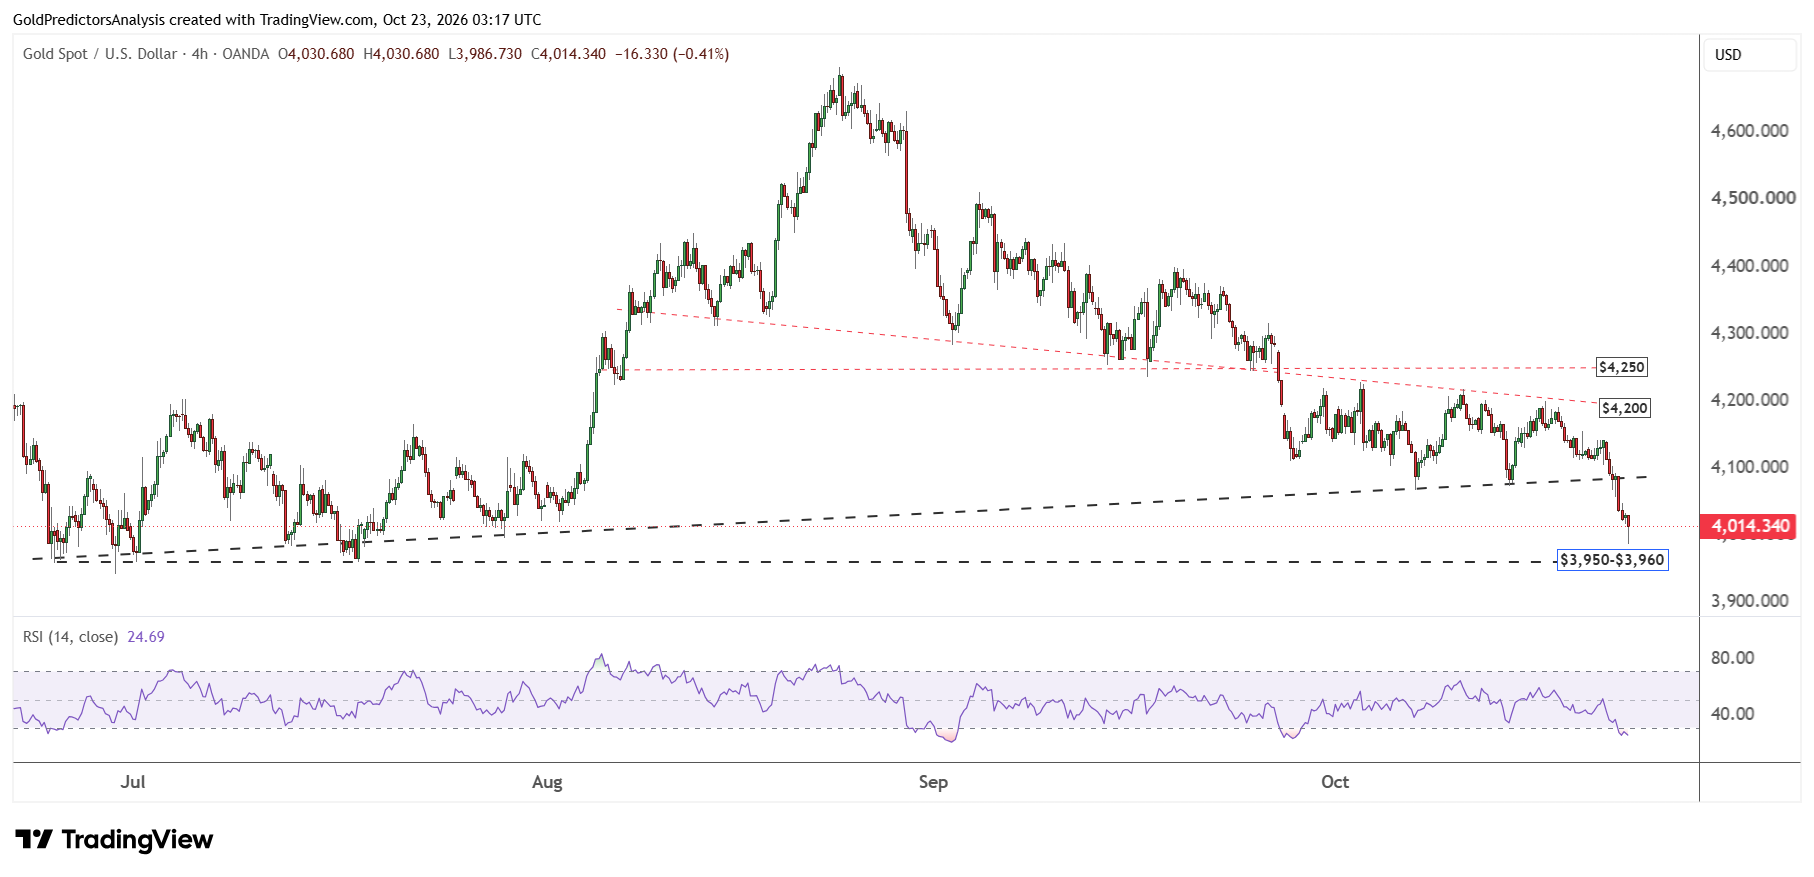
The daily chart for spot gold shows that the price broke below the $4,070 area after a strong price compression between $4,200 and $4,070. This breakout has pushed the price towards the key support zone of the triangle at $4,000. However, the price still remains under bearish pressure and looks to break the support zone.
This support zone lies between the range of $3,950 and $4,000. A break below $3,950 will offer a deeper correction towards the $3,800 region. This support region is defined by the descending trend line that stretches from the October 2024 highs.
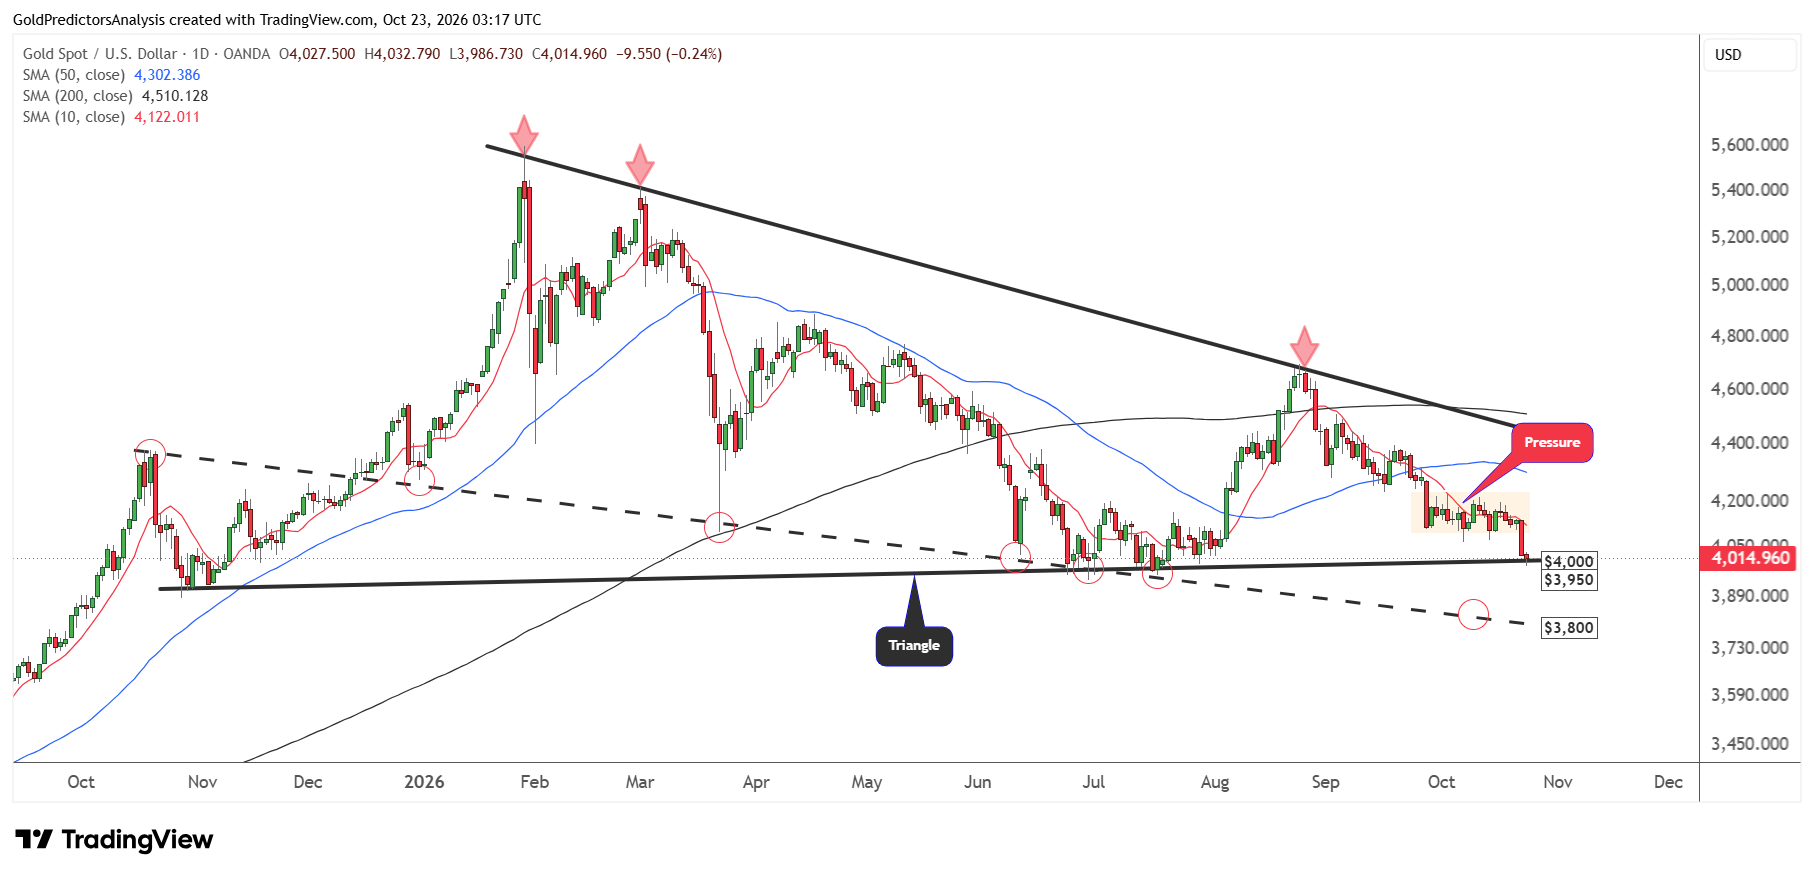
The price remains below the 10- and 50-day moving averages, which suggests strong bearish pressure in the short term.
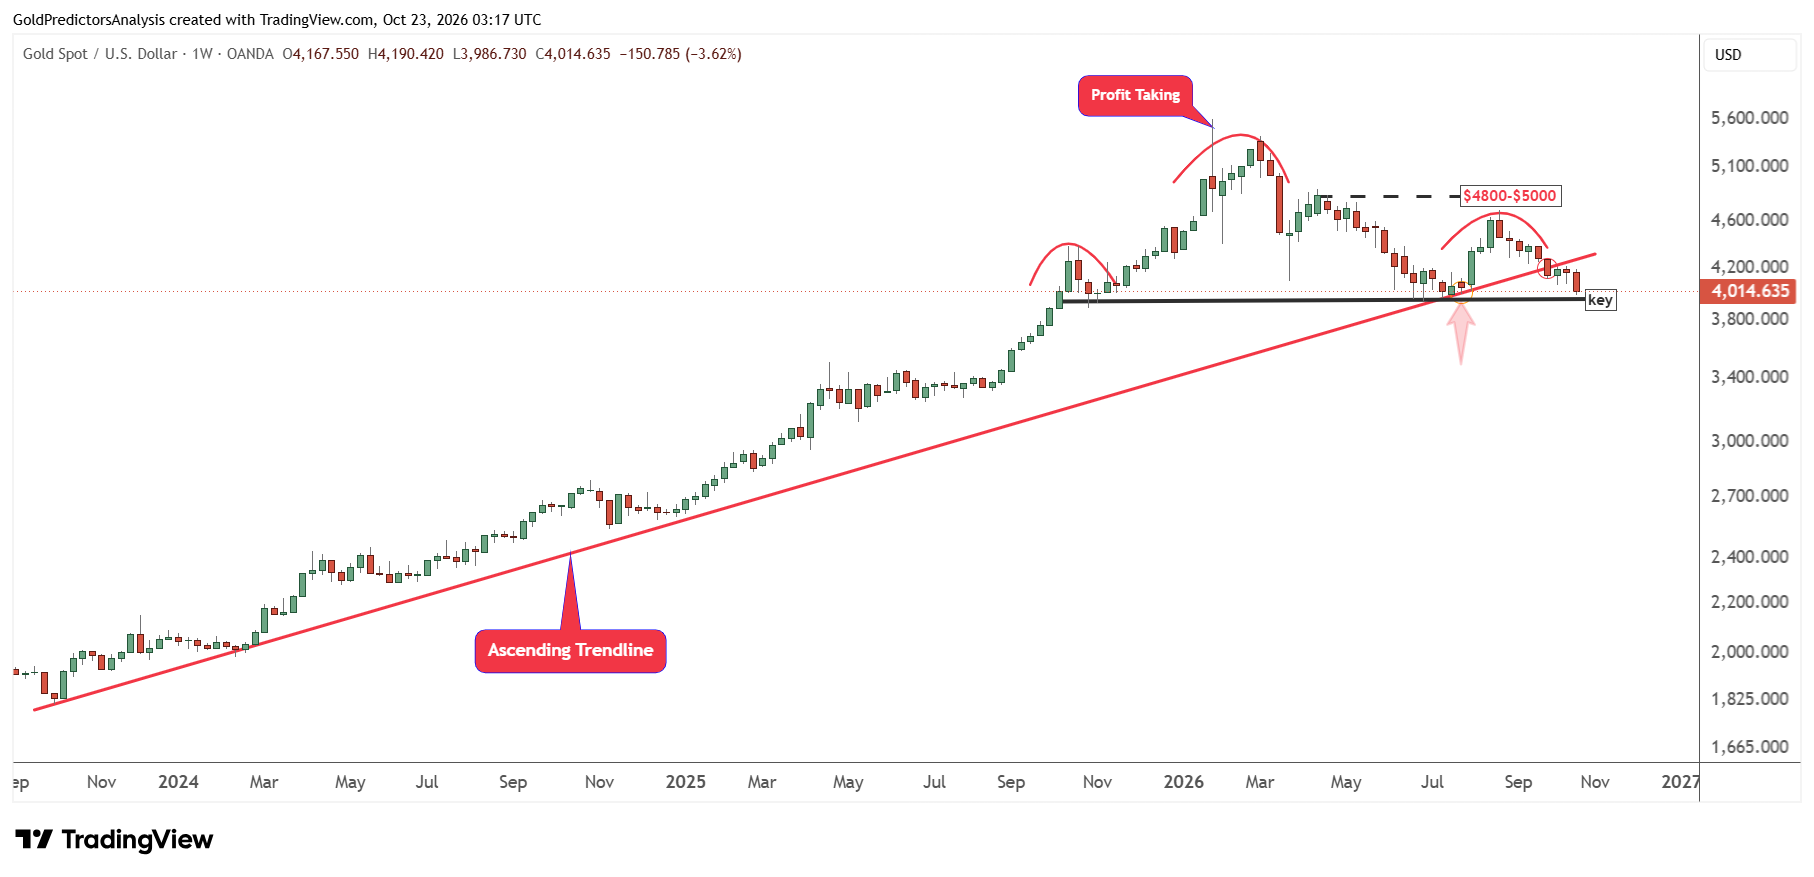
The weekly chart for spot gold also shows that the price broke the ascending trend line that stretches from the October 2023 lows. This breakout has pushed the price towards the key support of the $3,950 to $4,000 area. A break below this key level will likely open the way for a strong drop towards the $3,500.
The 4-hour chart for spot gold also shows that the price broke the ascending trend line at $4,070 and pushed towards $3,950 in the short term. The immediate resistance in spot gold now remains between $4,070 and $4,080. If the price fails to recover above $4,080, it will likely continue to move towards $3,950. A recovery above $4,200 will likely ease the bearish pressure and open the way for further upside towards the $4250 area.
Gold Price Forecast
Every new Gold analysis as it publishes, today's technical signal and key levels, live price — on one page.
See all Gold forecastsSilver Price Forecast: $55 Breakdown Puts $50 in Focus
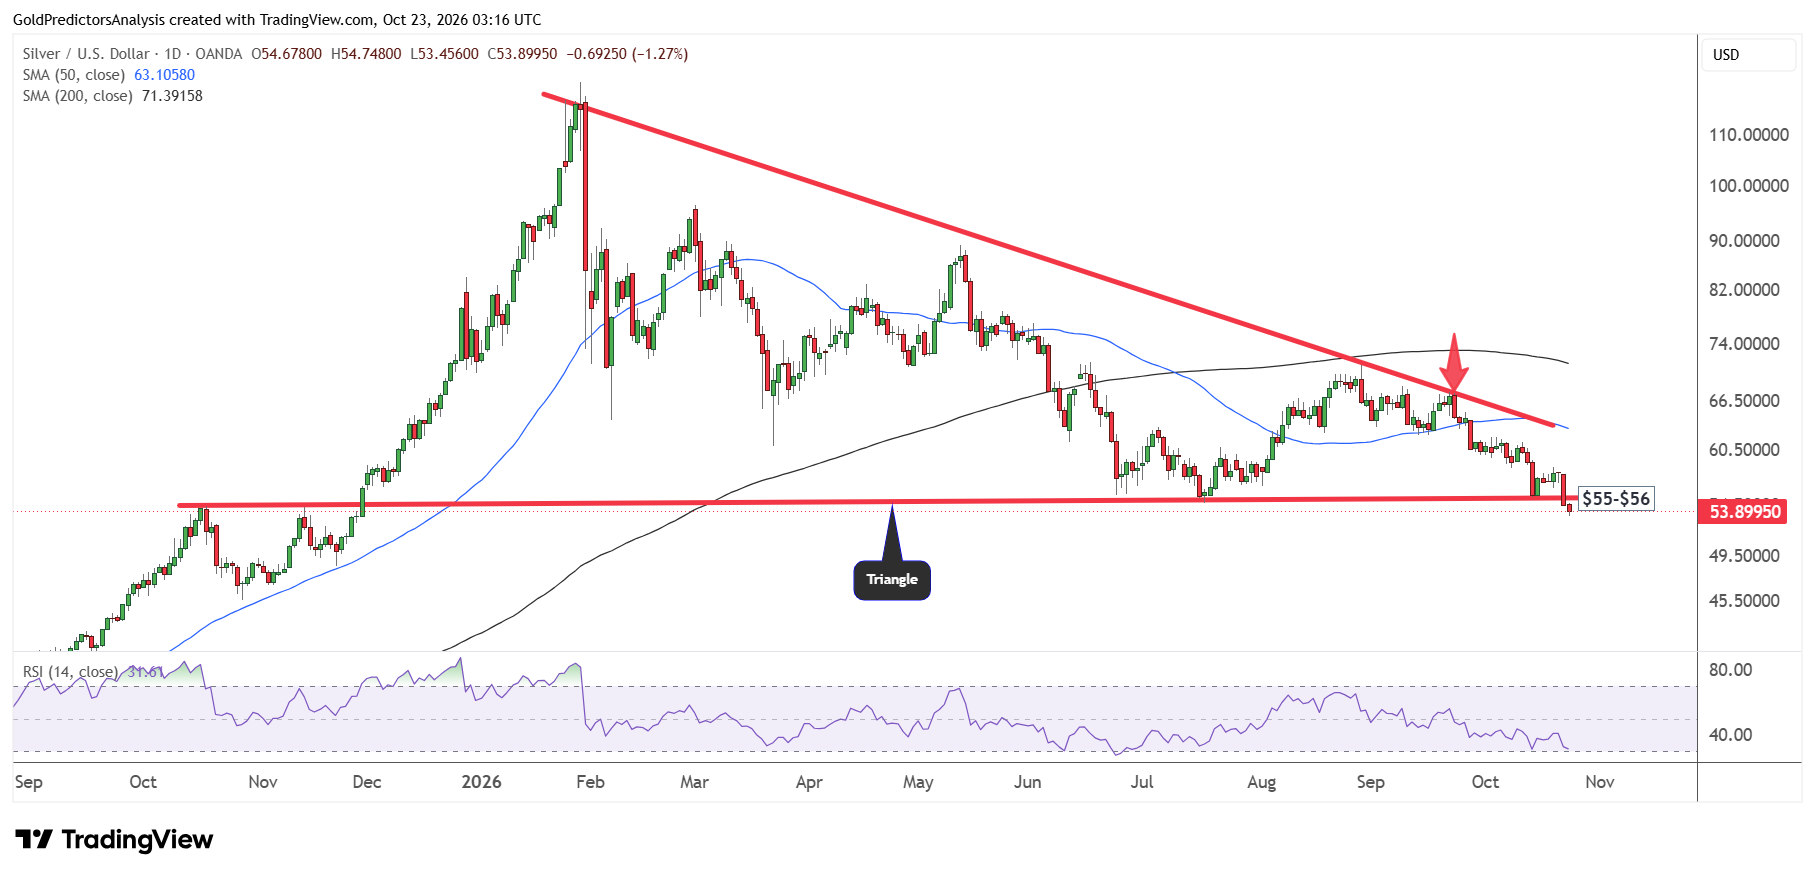
The daily chart for spot silver also shows strong bearish pressure as the price breaks below the $55 region on Thursday. The price continues to show negative price action in the short term. The silver price must break above $60 to ease the negative price action in the short term.
The key resistance in silver remains $63 at the 50-day SMA. A break above this resistance will also break the triangle pattern and push prices higher to $72. However, a break below $55 will increase the possibility of a continued drop to $50.
But the silver price is approaching the oversold levels on the daily chart. This suggests that the next drop might attract buyers. The RSI might range between the 20 and 30 level when the silver price drops to $50.
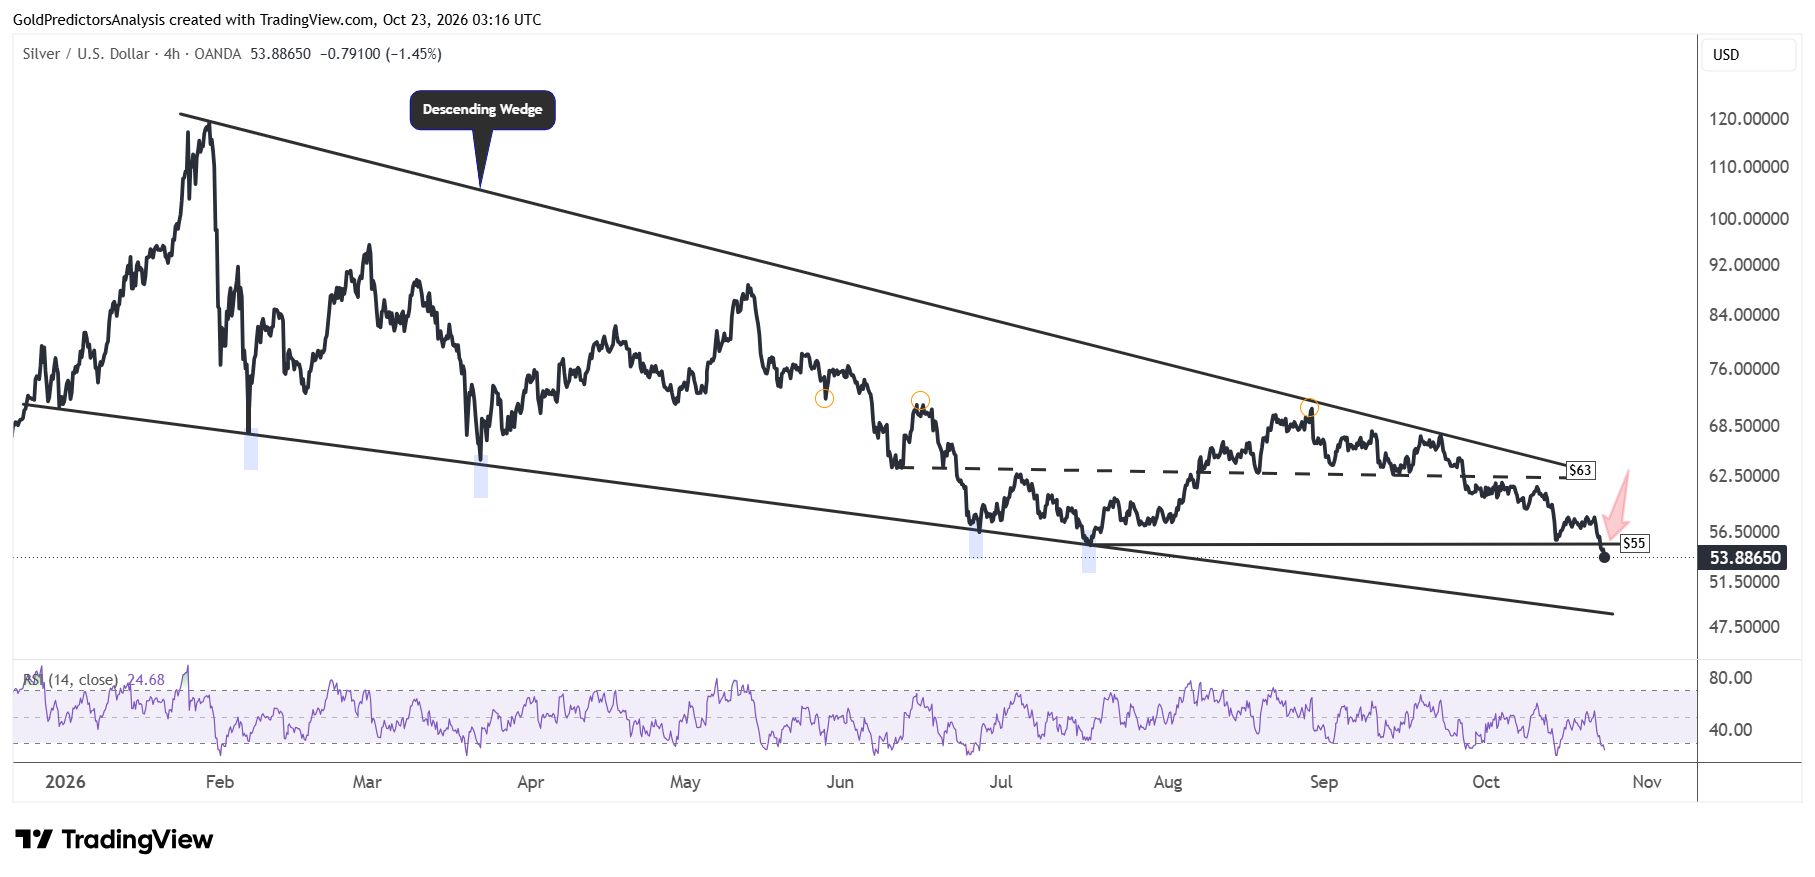
The importance of the current breakout is also seen on the 4-hour chart which shows that the price remains within the descending wedge pattern. A break below $55 will indicate further downside towards the $49-$50 area which is defined by the lower boundary of the descending wedge pattern.
However, if the price successfully recovers above $60, it will indicate another rally towards the $63 region.
Gold-to-Silver Ratio: Break Above 73 Signals Silver Underperformance
The current bearish pressure in the gold and silver prices is also confirmed by the ratio of gold to silver that broke above the $73 level. The gold and silver prices produce a major bottom when the gold to silver ratio produces a top, as per the historical price action.
The weekly chart for the ratio shows that it has broken the ascending channel pattern in November 2025. This breakout has triggered a strong drop in the ratio to mark a low at 43.40 in January 2026.
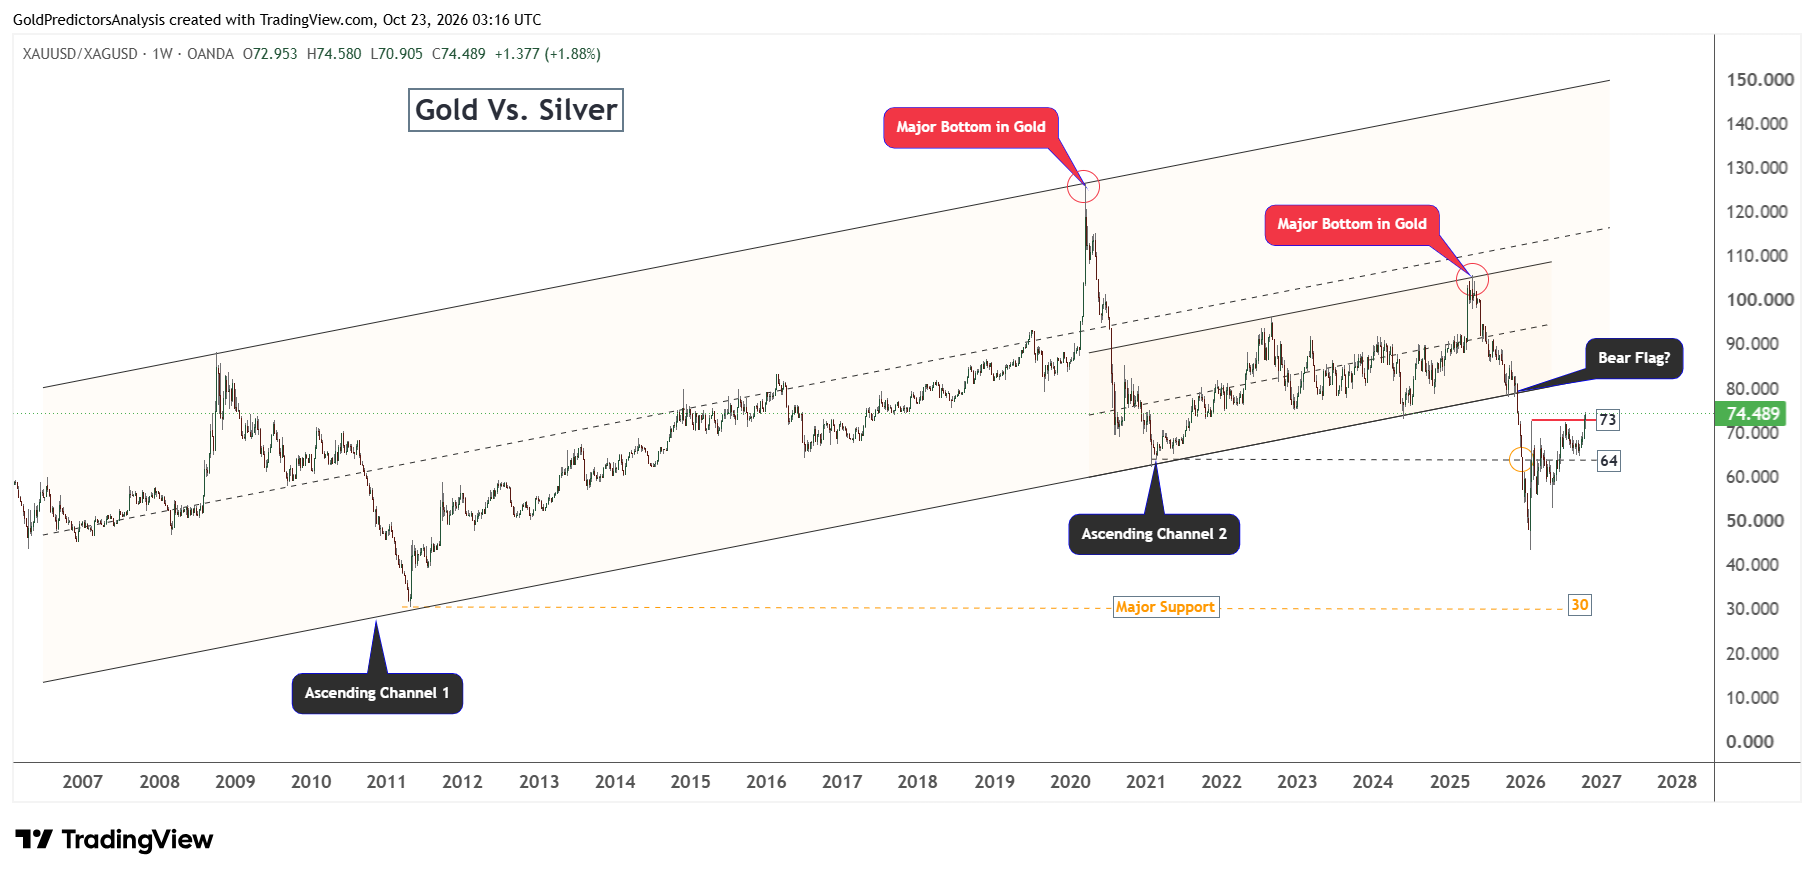
This low was developed when the gold and silver prices peaked at $5,600 and $120, respectively. But the recovery from this support has broken the resistance of 73 in the ratio. This suggests that the ratio has more room to move higher which may push gold and silver prices lower. However, once the ratio produces a peak, it will likely confirm a bottom in both metals.
What to Watch Next
Gold and silver prices remain under pressure as high oil prices keep inflation elevated and the risk of a rate hike by the Fed in focus. Gold could drop towards $3,800 if it breaks below $3,950. On the other hand, silver could test $50 if it remains below $60.
In my view, the correction in oil prices may ease the fears of inflation and support a recovery in both metals. Since oil prices remain strong and continue to rally from their key areas, they may further keep pressure on metals. Gold needs to break $4,200 while silver needs to move above $60 to ease the bearish pressure. Until the metals break above these levels, the possibility of a sustained drop is high.
Read more: Breakdown Risk Persists as Oil Rebounds