
Gold (XAU) price consolidated around $4,120 on Wednesday and remained under bearish pressure below the $4,200 level. The US dollar began a correction after marking a high at 102.94 and hit 101.50 on Tuesday. The correction came as 10-year US Treasury yields began to correct after reaching a high of 5.36%.
The weakness in the US dollar did not support a rebound in gold and silver (XAG) prices. This is due to higher expectations for a hike in interest rates in December. The expectation for a rate hike in December has increased to around 90% as per the FedWatch Tool.
Oil prices have also remained a major driver of weakness in the gold and silver markets during the past few months. Brent crude oil has rebounded on Wednesday and is consolidating around $111.80. A break above $113 could open the way for Brent oil towards the $120 area.
The strength in Brent oil keeps expectations of a Fed rate hike in focus. This keeps gold and silver prices under pressure. In my view, an easing in oil prices may create a sustainable rebound in the gold and silver markets.

Gold Price Forecast: $4,070 Breakdown Could Expose $4,000
The daily chart for spot gold shows that the price is compressing below the 50- and 200-day SMAs and remains under bearish pressure. The recent consolidation zone remains between $4,070 and $4,200. A break below $4,070 will push the price towards the $4,000 area, which is defined by the support of the triangle pattern.
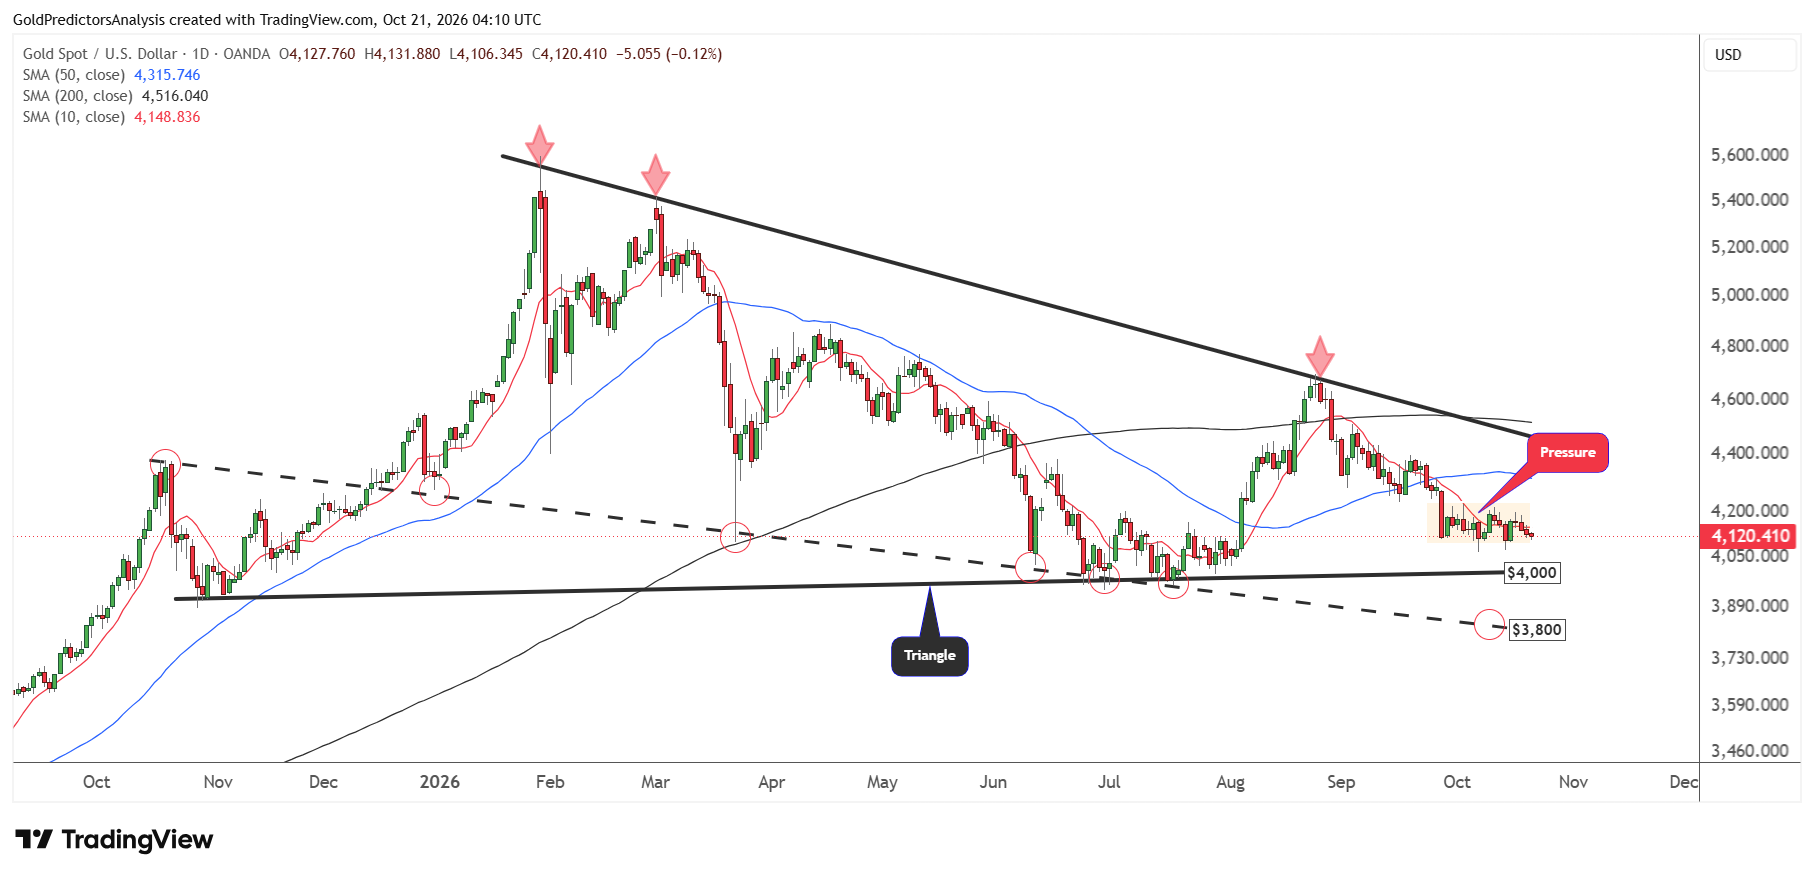
But a break below $4,000 this time will open the way for a drop towards the descending trend line at $3,800 that stretches from the October 2025 highs. The price is required to break above the $4,200 area in the short term to relieve bearish pressure. A break above $4,200 will push the price towards the 50-day SMA at $4,300.
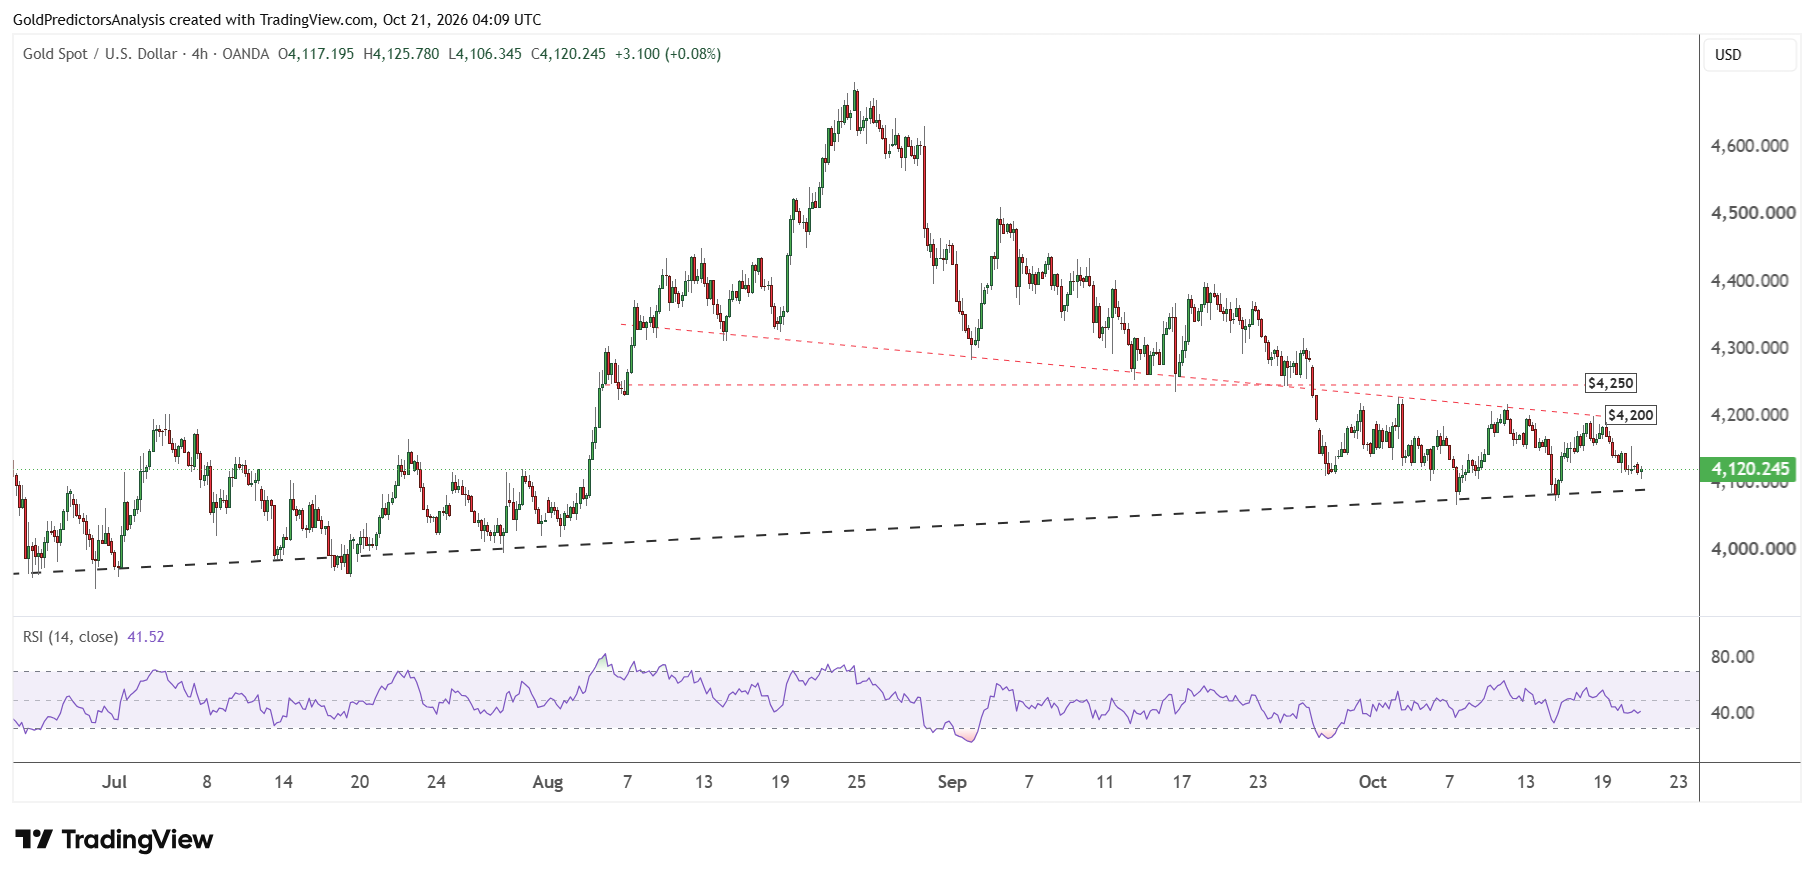
The 4-hour chart for spot gold also shows strong price consolidation between $4,070 and $4,200. The price is required to break either of these levels to find the next direction.
However, the consolidation in the tight range in October suggests that the price remains under bearish pressure. Therefore, a break below the ascending trend line at $4,070 may increase the possibility of a breakdown below $4,000.
Gold Price Forecast
Every new Gold analysis as it publishes, today's technical signal and key levels, live price — on one page.
See all Gold forecastsSilver Price Forecast: Break Below $55 Could Trigger a Drop to $50
The daily chart for spot silver also shows strong consolidation between the $55 and $63 levels. The price is currently trading at the edge of this triangle pattern and looks to find the next move.
A break above $62 will likely open the way for a rally towards the 200-day SMA at the $72 level. But a confirmed break below $55 will open the way for a further drop towards the $50 area.
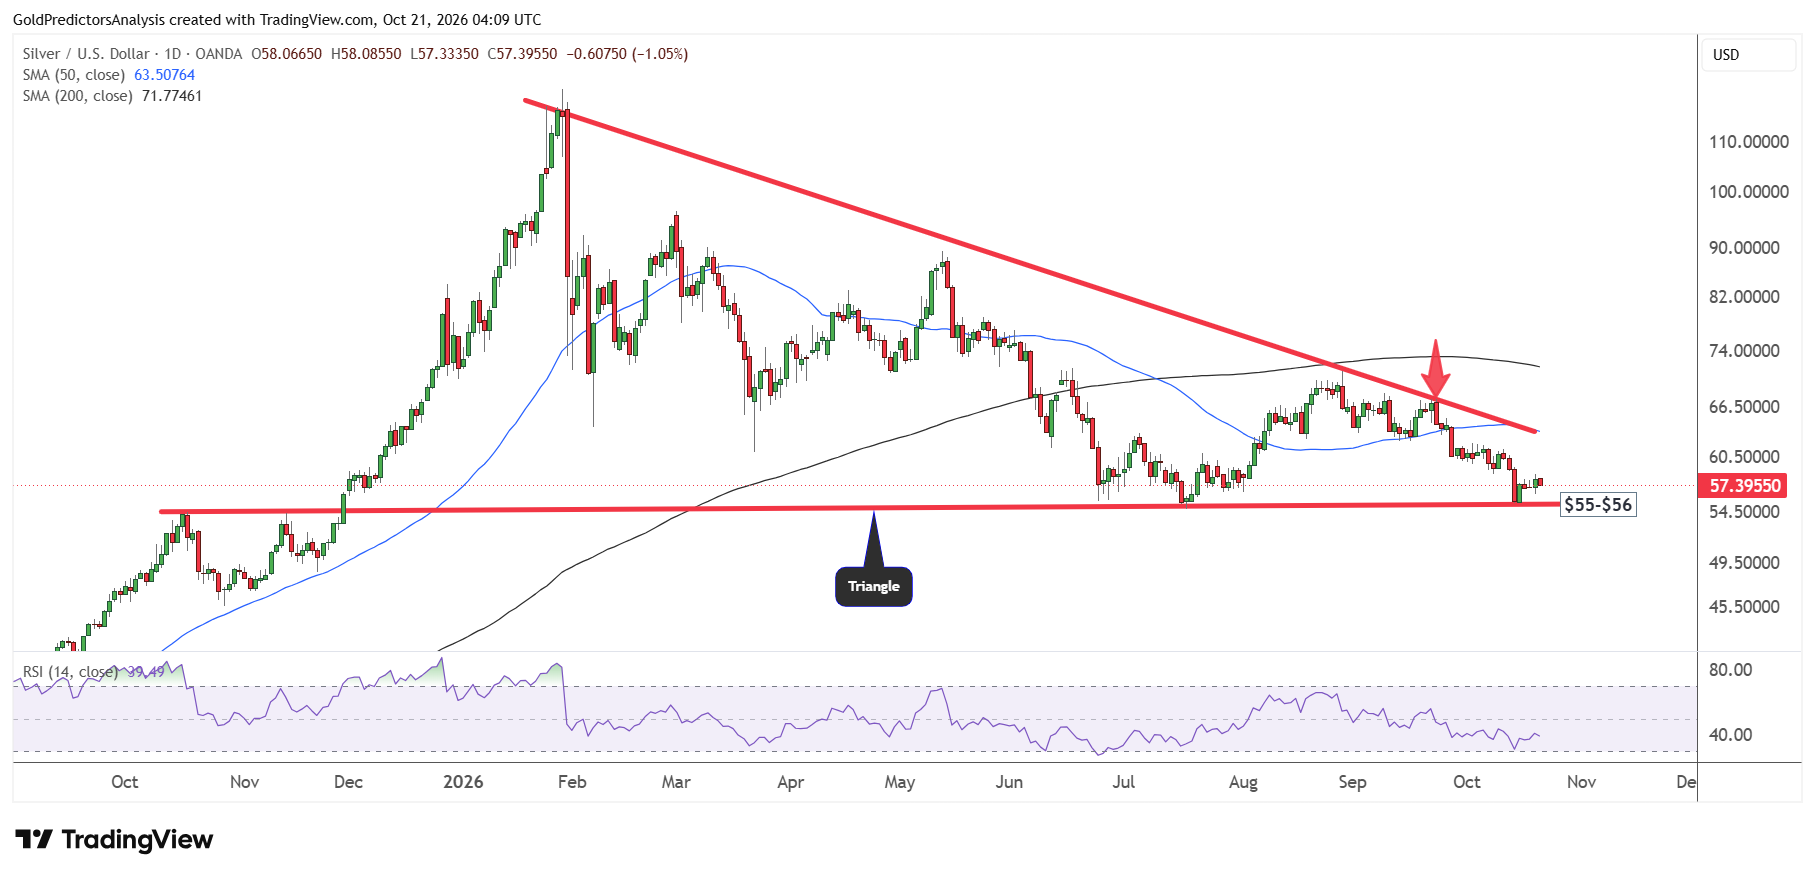
The RSI has also hit the oversold region as the silver price hit the $55 support. However, the rebound from $55 is weak and the price still remains under pressure.
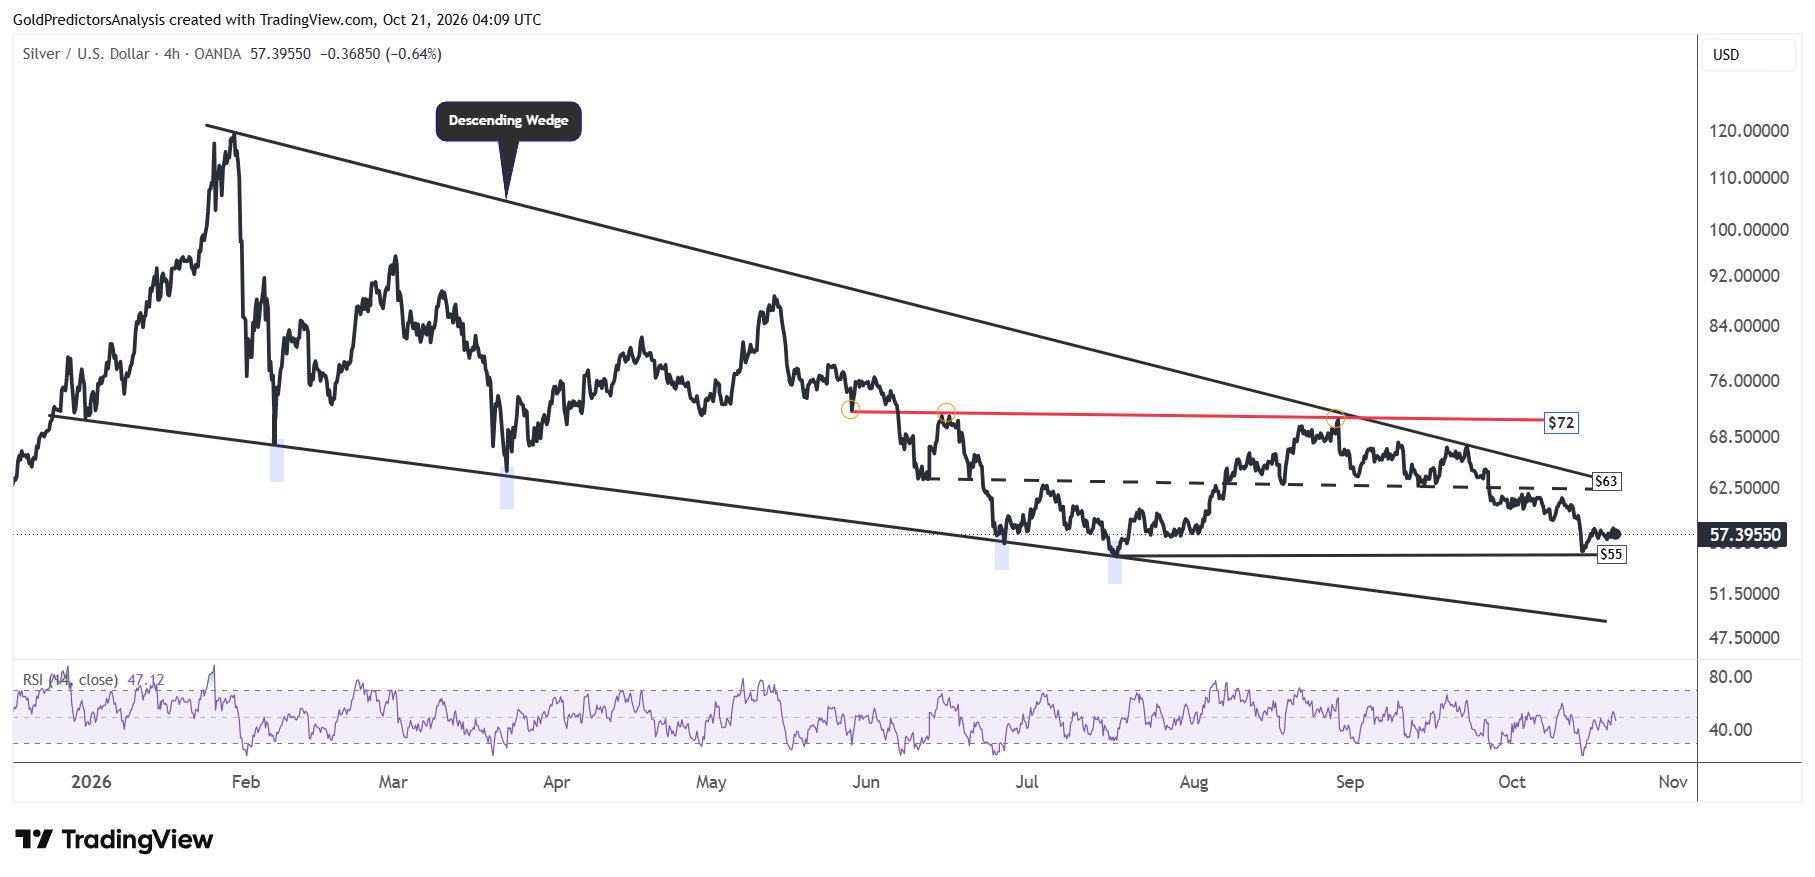
The 4-hour chart for spot silver also shows strong pressure on silver prices as long as the price remains below the resistance of the descending wedge pattern at $63. A break below $55 will open the way for a quick drop towards the $50 area. This support is defined by the lower boundary of the wedge pattern.
What to Watch Next
Gold and silver remain under pressure as high oil prices keep inflation high and the risk of a Fed rate hike in focus. Gold needs to break above $4,200 to ease bearish pressure while silver needs to clear $62-$63. A break below $4,070 could send gold towards $4,000. A break below $55 in silver could open the way for $50. In my view, the lower oil prices could ease the concerns about inflation and support a recovery in both metals.