Bullish Advance Hits First Resistance Test
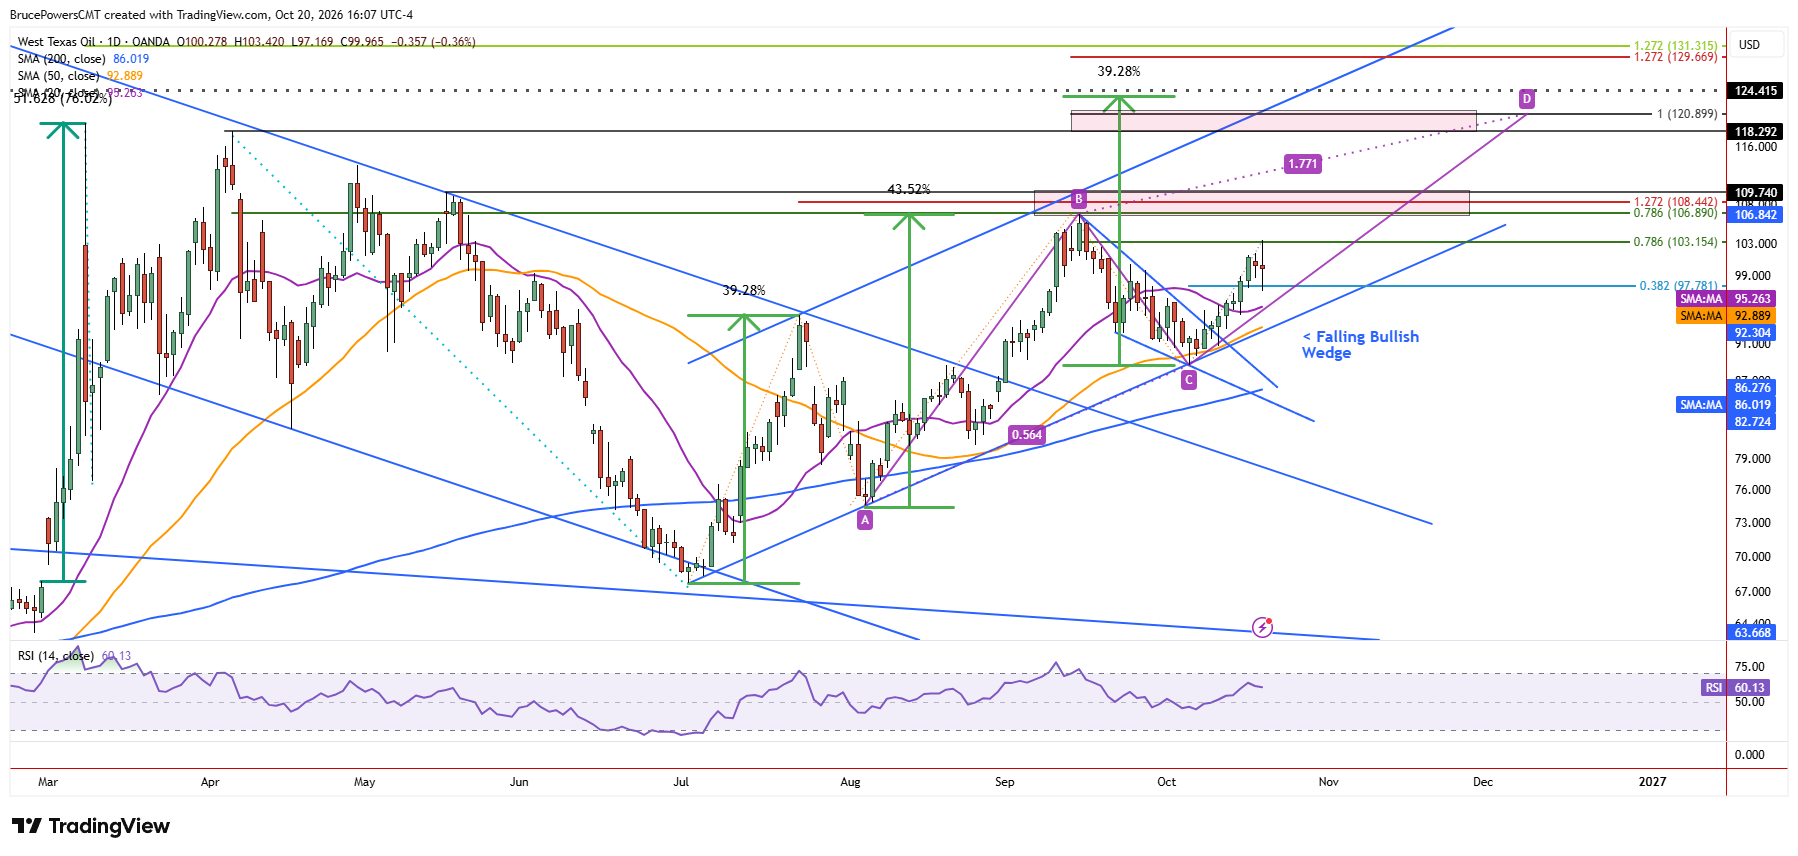
WTI crude oil extended gains on Tuesday, completing a 78.6% Fibonacci retracement of the prior decline before reaching a new high of $103.42 for the short-term advance. Sellers subsequently regained control, driving prices to a three-day low of $97.17 and generating a potentially bearish outside-day pattern. The intraday decline completed a 38.2% Fibonacci retracement of the advance. Whether this leads to consolidation or a deeper pullback remains to be seen, but the reversal suggests crude oil may need to consolidate or retrace further before attempting to extend the current advance above $97.17.

Rising Channel Support Defines Trend Health
The bullish trend that began from the higher swing low of $67.73 remains dominant, and its structure was reinforced during the recent pullback that resulted in a higher swing low at $88.66. That followed a successful test of support at the trendline that marks the lower boundary of a rising channel and the 50-day moving average.
Near-term dynamic support is represented by the 20-day moving average near $95.26. Price reclaimed this average five days ago, and the current weakness could lead to another test of it as support. A successful test followed by renewed strength would suggest that the short-term trend remains poised for an eventual upside continuation.
Wedge Breakout Faces Its First Pullback
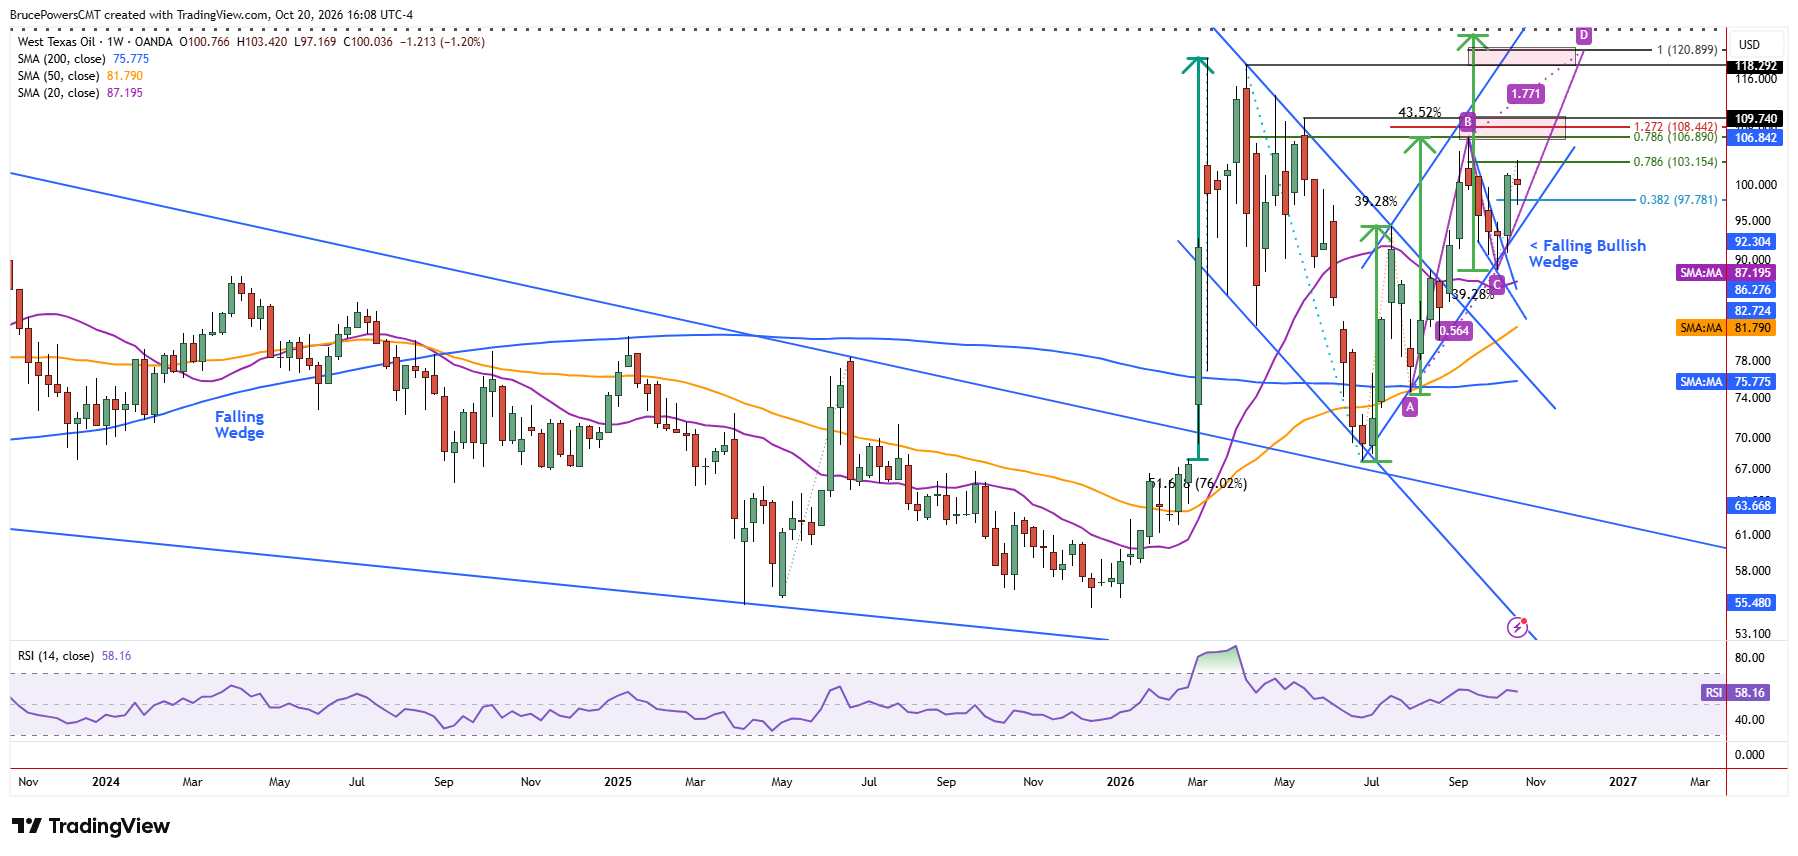
In addition to the rising channel that suggests a potential target near the upper boundary of that pattern, crude oil broke out of a falling bullish wedge continuation pattern two weeks ago. That breakout preceded the rally to $97.17 but there has not yet been a notable pullback since the breakout. Tuesday’s price action suggests that the first pullback may have just begun. If support holds above $88.66 and is followed by renewed strength, a higher swing low would reinforce the bullish structure and increase the likelihood of another advance as the wedge breakout continues to unfold.
Upside Targets Reach Toward $120
An initial upside target zone extends from $106.89 to $109.74, where several technical indicators converge. This zone remains valid unless weakness breaks support at the 50-day moving average, now near $92.89 and rising. Beyond that zone, a rising ABCD pattern projects a potential target at $120.90, close to the March spike high of $119.54, where resistance could emerge.
WTI Crude Oil Price Forecast
Every new WTI Crude Oil analysis as it publishes, today's technical signal and key levels, live price — on one page.
See all WTI Crude Oil forecastsIf you’d like to know more about how to trade crude oil, please visit our educational area.