Key Moving Averages Give Way
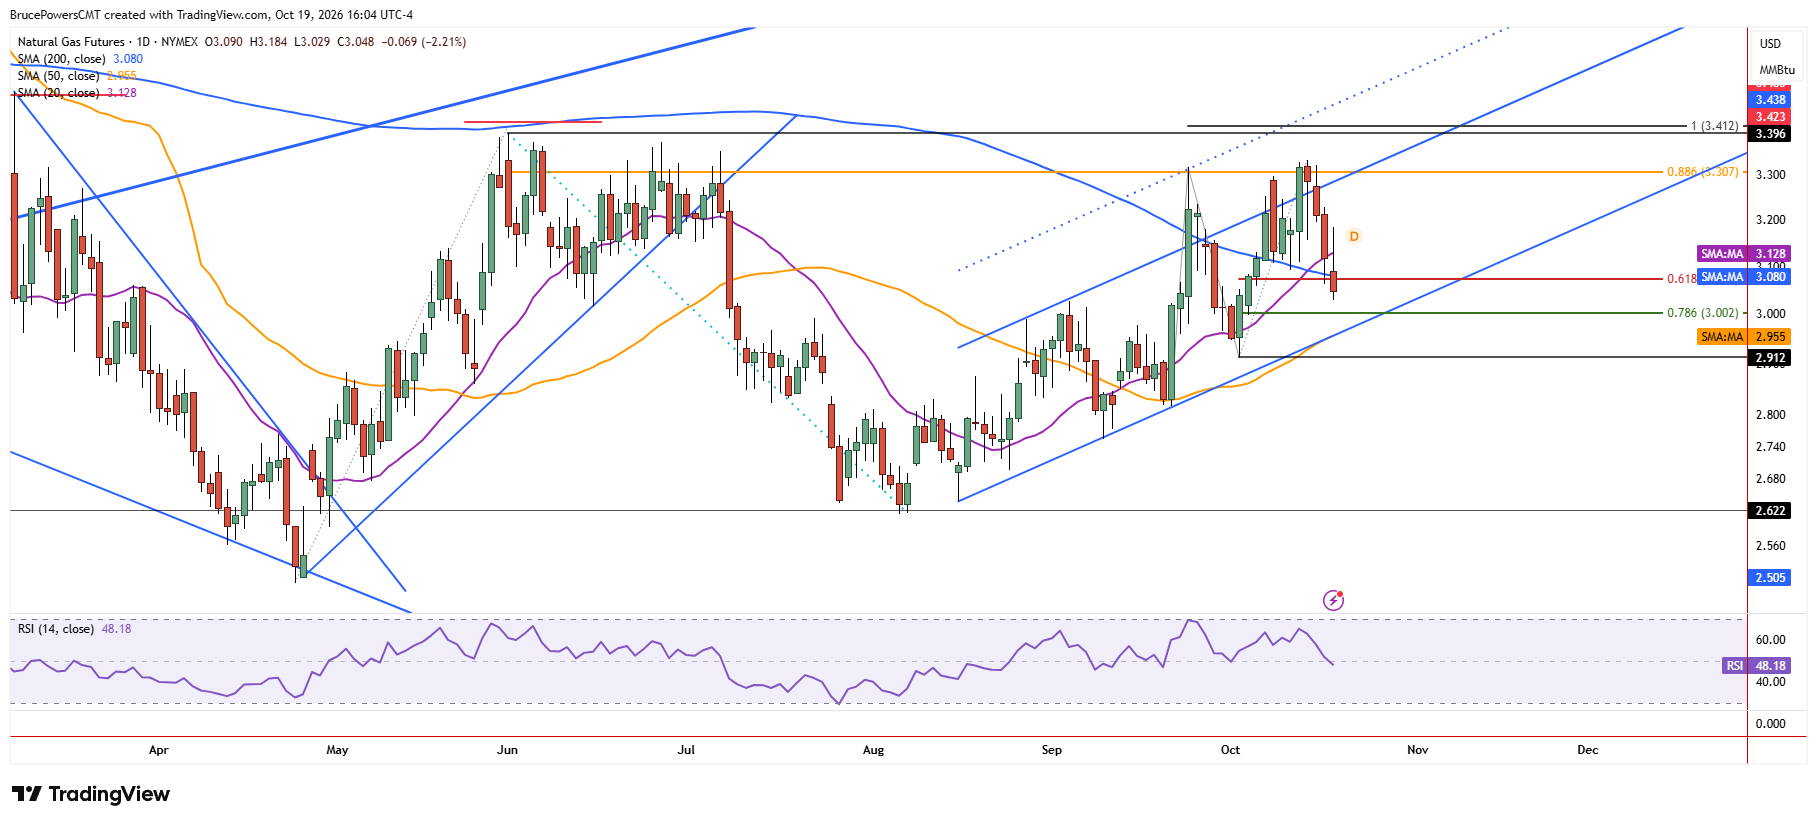
Natural gas broke below key near-term support on Monday, shifting the short-term outlook bearish and raising the risk of a deeper pullback toward $3.00 and the rising 50-day moving average. The 200-day moving average at $3.08 was broken following eight days of consolidation and a failed attempt to extend to new highs last week. At the time of writing, a 10-day low of $3.03 was reached, and the break below the 200-day moving average was on track for confirmation with a daily close below the average. In addition, short-term bearish implications were signaled by a break below the 20-day moving average near $3.13 earlier during Monday’s session. Together, these breaks indicate weakening momentum after the recent consolidation.

Failed Breakout Strengthens Bearish Case
Last week’s high of $3.33 was the second test of resistance near the September high of $3.32. Natural gas failed to break through that zone, and seller subsequently took back control, as evidenced by Monday’s bearish price action and break below the 200-day moving average. That high is now a lower swing high, as the trend failed to advance above the July lower swing high of $3.40. A failed breakout sometimes results in a sharp move in the other direction, raising the risk of a deeper retracement before buyers can regain control. This failure to extend the advance reinforces the importance of the lower support levels now coming into focus.
$3.00–$2.95 Support Zone Comes Into View
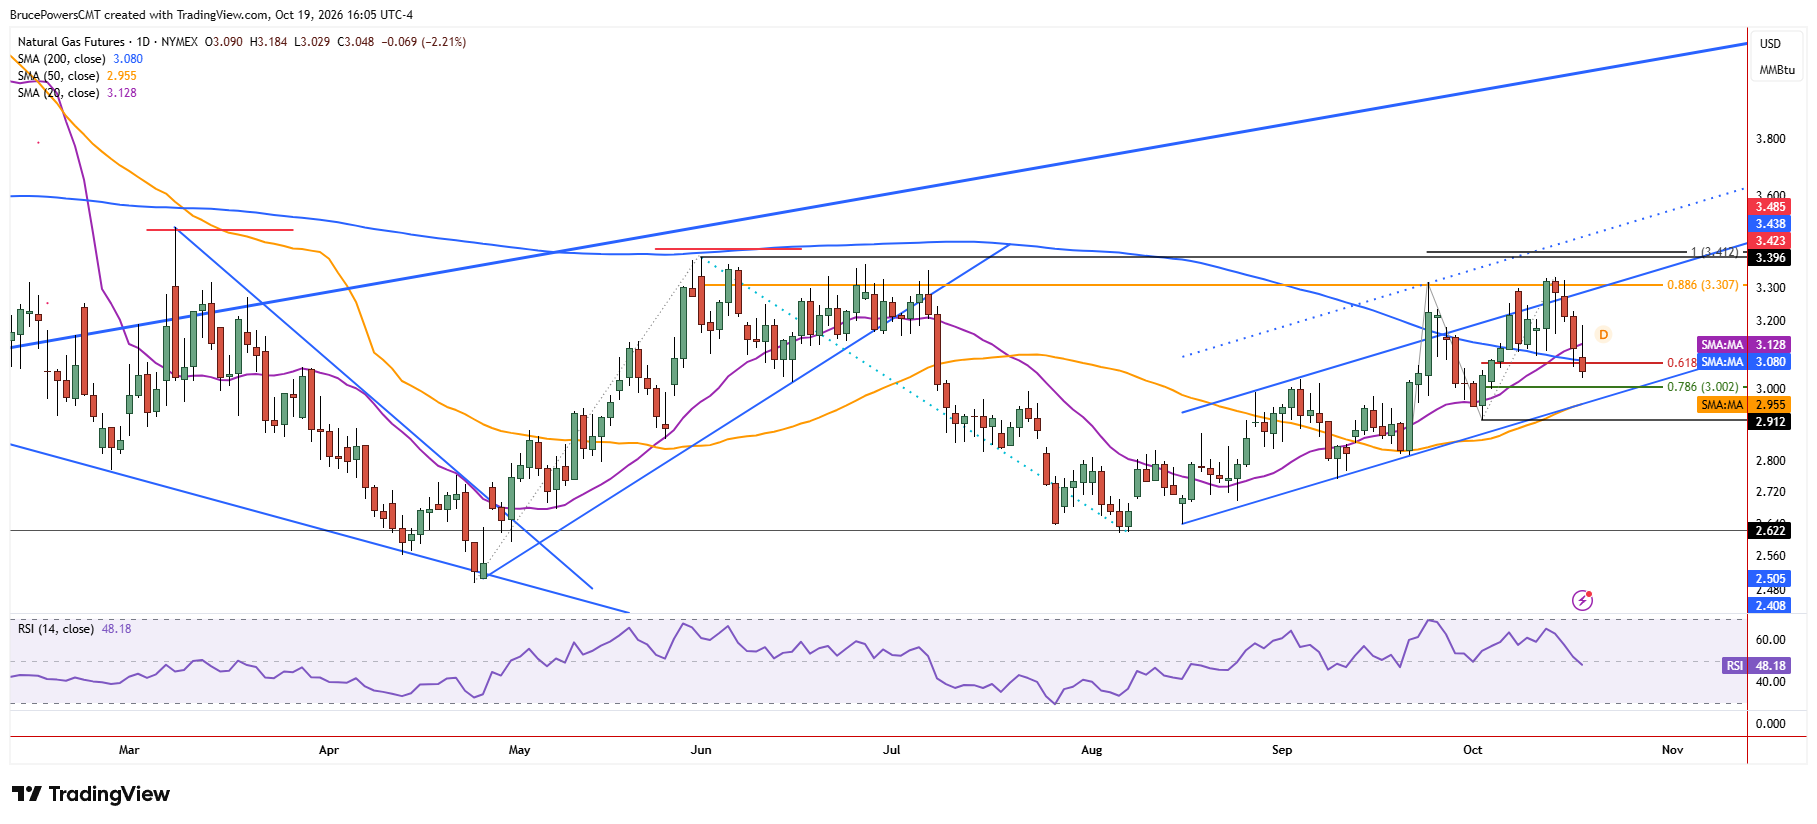
Trading below the 200-day moving average retains a short-term bearish outlook, with lower potential support levels defined by the 78.6% Fibonacci retracement at $3.00 and the 50-day moving average near $2.95 and rising. Recently, the 50-day moving average has aligned with the lower boundary of the channel, adding to its significance as a possible lower target. However, because the average is rising, it could converge with or approach the Fibonacci level before price reaches that area, creating a potential zone of support rather than two distinctly separate targets. A reaction at this confluence could help determine whether the broader rising channel remains intact.
Reclaiming $3.08 Is First Step Toward Recovery
If the rising channel structure is retained following a deeper pullback, natural gas may make another attempt to challenge resistance near recent highs. The 200-day moving average is the first key resistance level that needs to be reclaimed to improve the near-term outlook. However, given recent price action, a quick reclaim of the 200-day moving average would be difficult to rely on before additional consolidation. For now, the breakdown shifts attention to $3.00 and the rising 50-day moving average near $2.95, where support could determine whether natural gas resumes its broader advance or remains under bearish pressure.
If you’d like to know more about how to trade natural gas, please visit our educational area.