Five-Month Base Breakout Confirms Strength
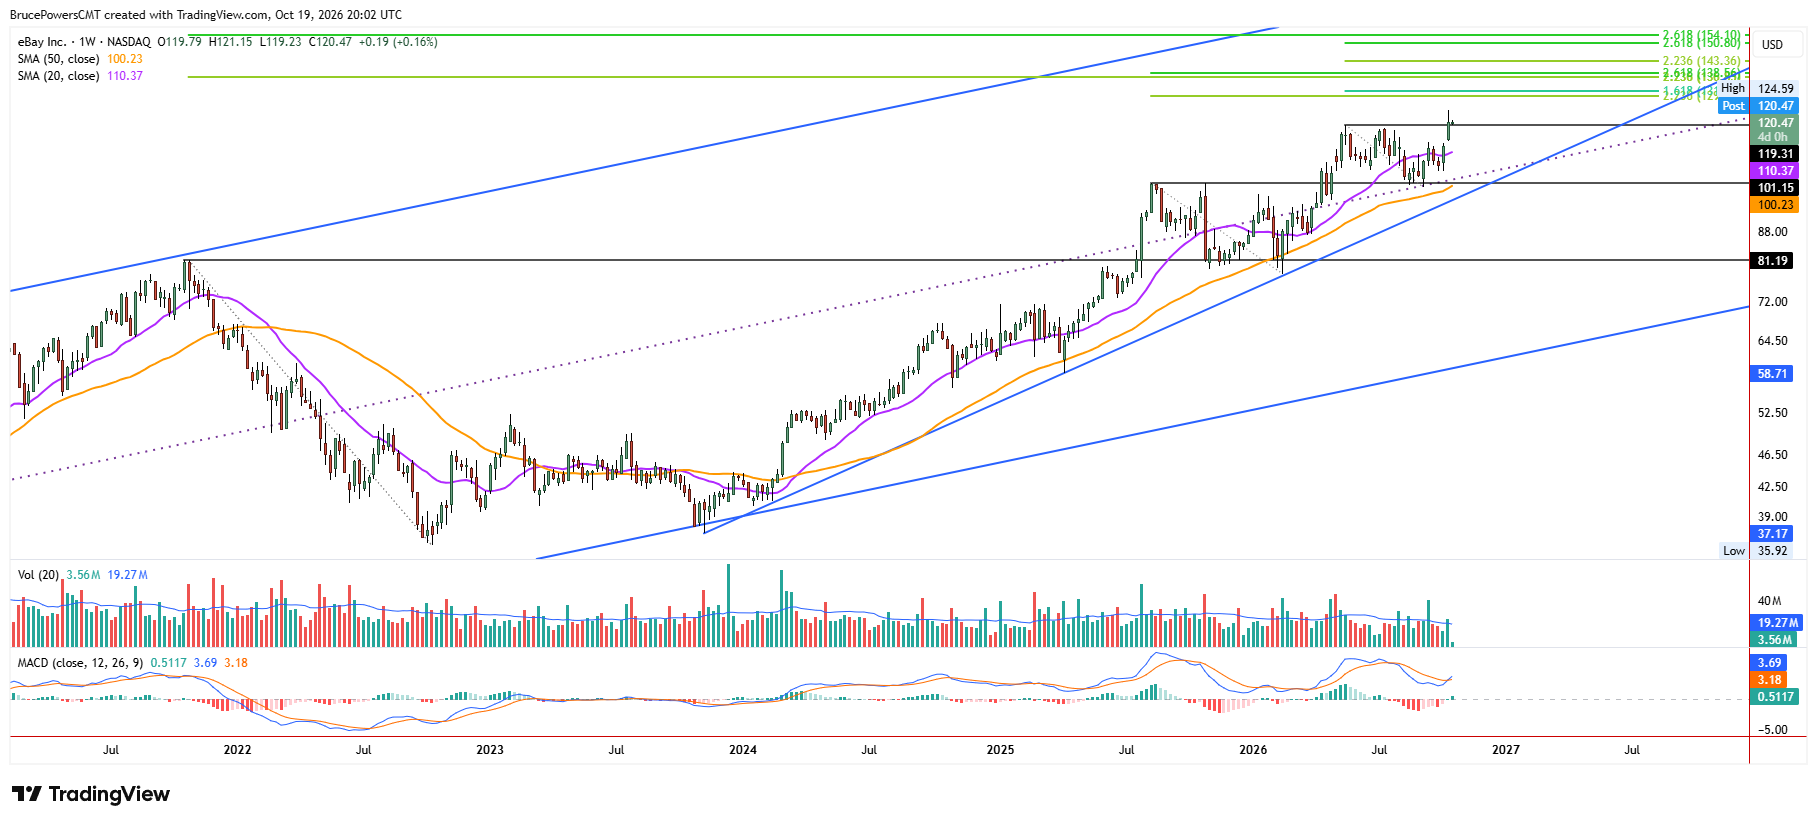
Ebay, Inc. (EBAY) confirmed an upside breakout from a five-month basing pattern last week, strengthening its bullish technical outlook as the stock continues to demonstrate relative strength despite market pressure. The weekly closing price above the prior high of $119.31 from May, providing confirmation of the breakout. The stock has retained its bullish price structure during market pressure.
The recent consolidation base was constructive, establishing a higher swing low at $99.85 and successfully testing support at the previous resistance zone near the prior high of $101.15 from August. Support was reinforced by the midline of a large trend channel and the nearby 50-week moving average near $100.23. This confluence of technical support helped establish a foundation for the latest advance.

50-Week Moving Average Signals Improving Momentum
An advance from the 50-week moving average zone is the third test since that average was reclaimed in February 2024. Moreover, compared to the prior two pullbacks to the 50-week average, the recent test found support above the average, while the prior two pullbacks rebounded following a decline below the average. This relationship indicates improving bullish momentum. The ability to hold above the average during the latest correction suggests that buyers are maintaining greater control than during the previous tests, reinforcing the constructive longer-term price structure.
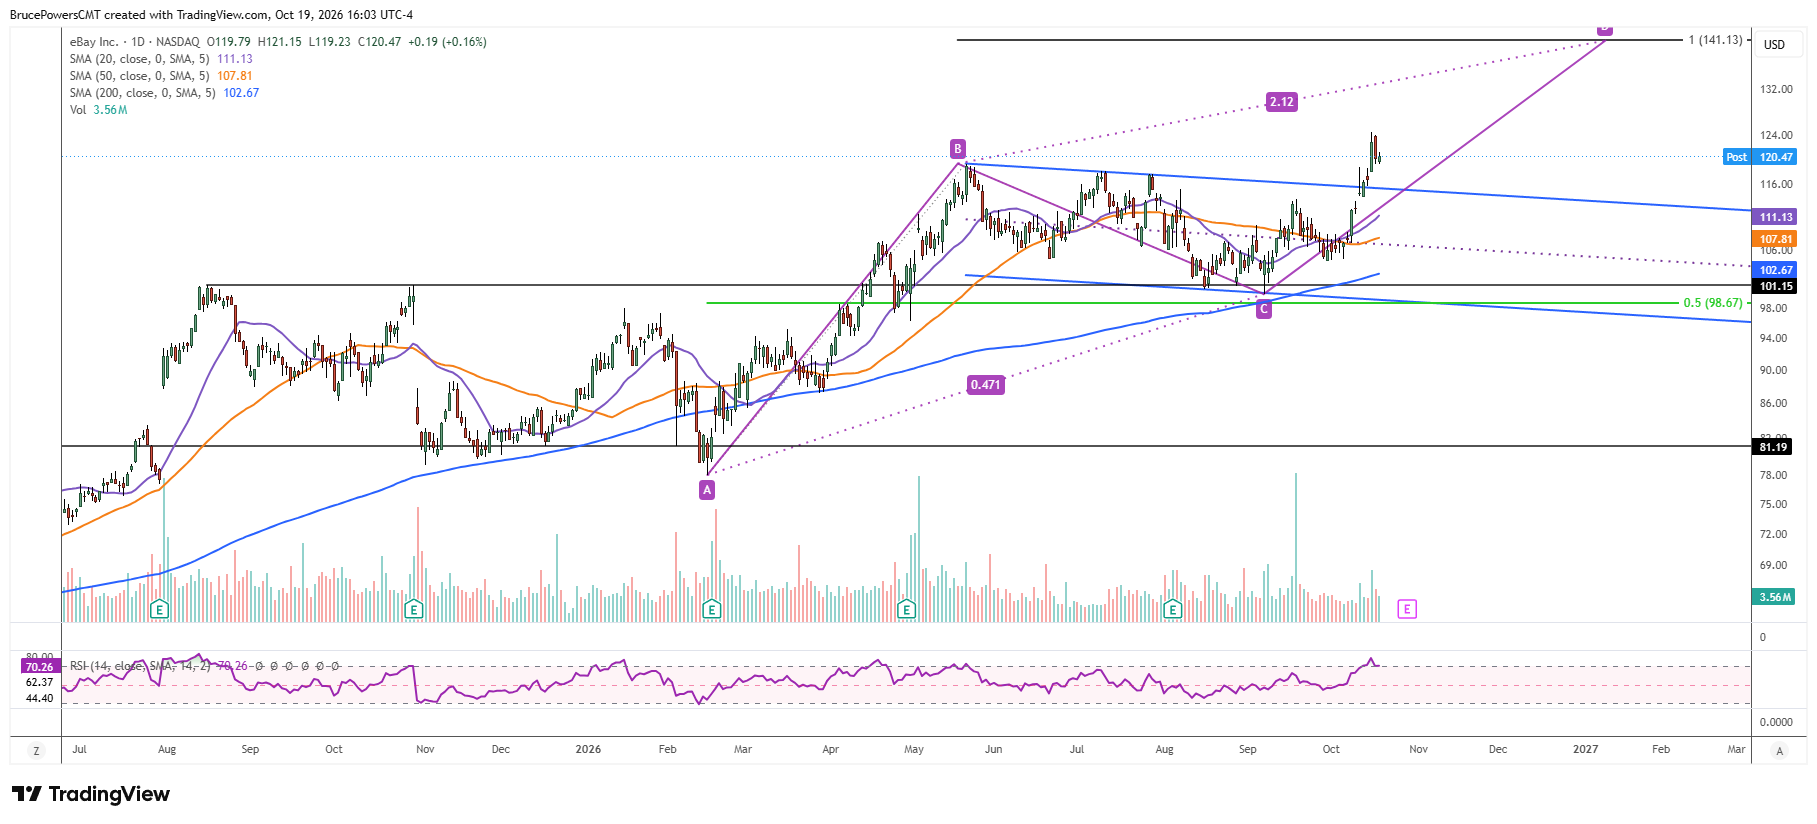
Multi-Year Breakout Keeps Longer-Term Outlook Bullish
Furthermore, an upside breakout from a large multi-year basing pattern was triggered in July 2025. Its bullish influence remains and supports a long-term bullish outlook. With the bearish correction appearing complete and a trend continuation signal triggering on Monday, EBAY is poised to continue higher to test potential resistance levels. This outlook remains intact unless the stock falls below support at last week’s low of $114.08 and continues to weaken. Holding above that low would help preserve the recent bullish structure, while a break below it would raise concerns about the sustainability of the breakout.
$124.59 Becomes Next Breakout Confirmation Level
Despite the technical bullish breakout signal, additional signs of strength are needed. A rally above last week’s high of $124.59 would signal a continuation of the breakout, with another weekly close above that level further confirming strength. There are several Fibonacci confluence zones on the weekly chart that show possible resistance and upside targets.
These zones provide potential reference points as the advance develops, although price action will determine whether additional resistance emerges. For now, traders will be watching for corrective price action that may lead to new opportunities, while monitoring whether EBAY can extend its breakout above $124.59 and sustain its bullish momentum.
If you’d like to know more about technical analysis and how traders use it, please visit our educational area.