Critical Support Defines Silver’s Next Move
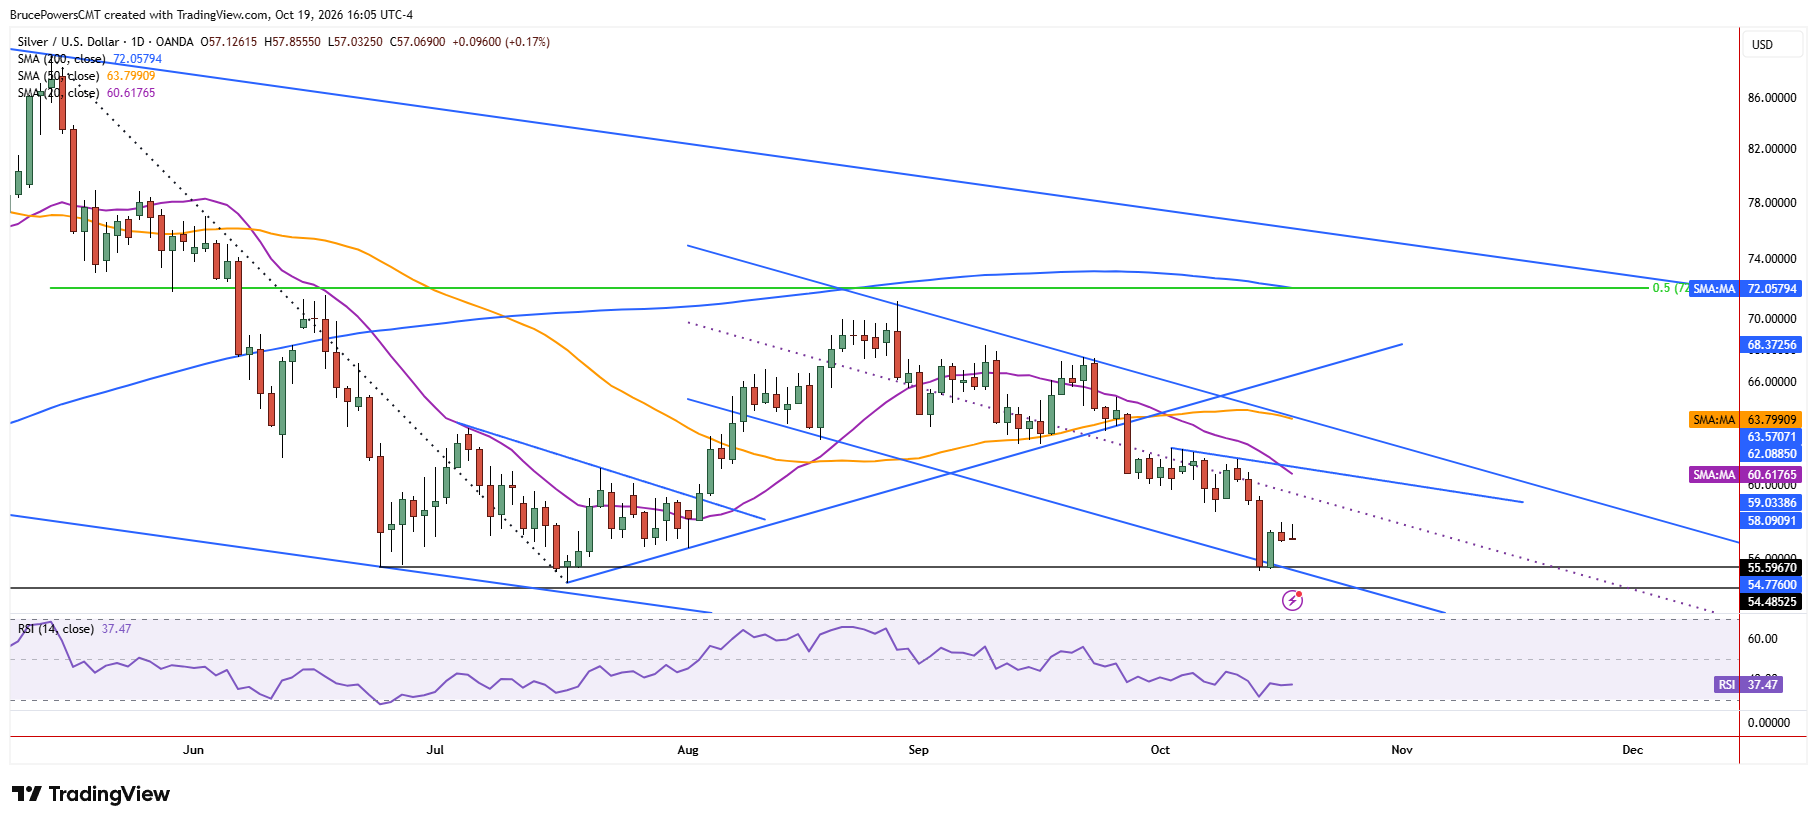
Silver is testing a key decision point after finding support at a low of $55.40 last week, with the next move likely to help determine whether the bearish trend resumes or a countertrend recovery develops.
Support near that low is reinforced by a prior swing low from June and the lower boundary of a falling trend channel. Additional support comes from a summer consolidation range with a low of $54.78. That low also represents a swing low in the developing bearish trend structure that followed the January peak at $121.67, making this a key support zone. A decline below it would signal a continuation of the bearish trend, a potentially significant development, while a rally could generate a higher swing low, providing an early indication of a possible countertrend recovery.

Muted Bounce Leaves Recovery Unconfirmed
So far, the reaction from last week’s low has been muted, initially generating a bullish bounce before being followed by a narrow-range day on Friday, while Monday is on track to produce a similar tight range. This limited follow-through leaves the potential for a recovery unconfirmed.
Since silver is contained within a falling channel, a bounce could potentially test resistance near the upper boundary of the channel, with the 50-day moving average currently projected to be near $63.80. The 20-day moving average near $60.63, however, is the nearer-term resistance level. The falling 20-day moving average represents the next key dynamic resistance area and must be reclaimed to strengthen the case for a continuation of the advance.
Moving Average Crossover Reinforces Bearish Pressure
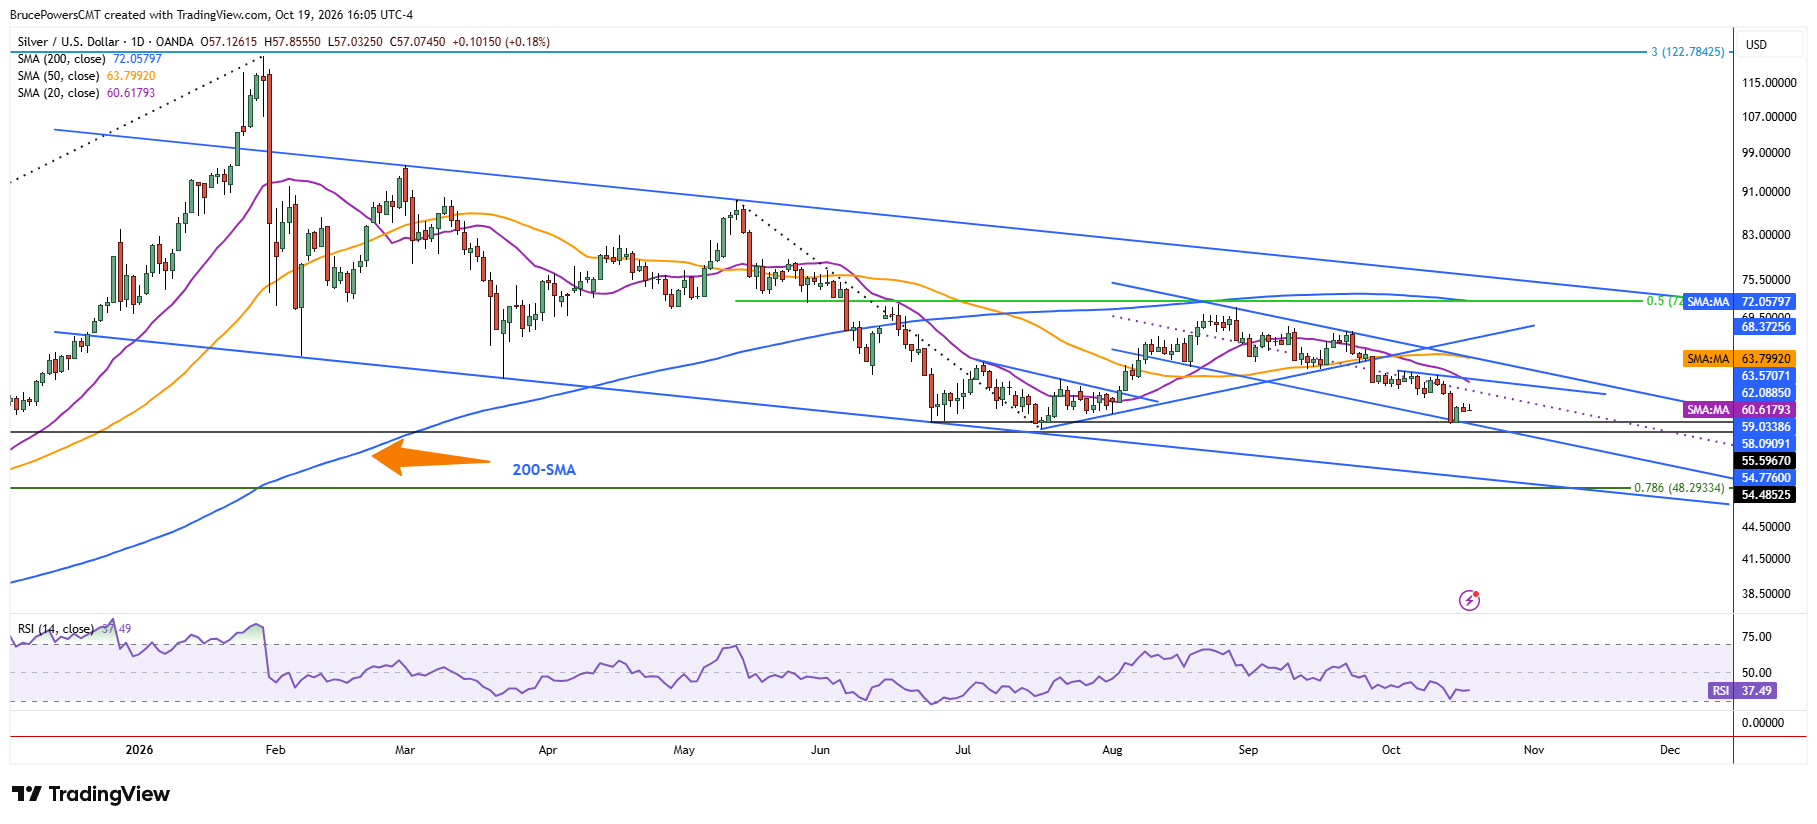
Signs of resistance are anticipated near that average given its accelerating downward slope, reflecting increasing seller momentum. The average has also declined below the recent minor lower swing high of $62.09 and is approaching a cross below the falling channel’s midline. Those signs support the bearish implications of the recent moving average crossover, in which the 20-day moving average crossed below the 50-day moving average, reinforcing short-term bearish momentum. Together, these factors suggest that any recovery may encounter selling pressure before reaching the upper channel boundary.
Breakdown Risks Extend Toward $48.29
Finally, a further support reference lies near $54.49, defined by the high of a resistance shelf that began forming in October 2025. Given this nearby support, a break to new lows should be treated cautiously until additional technical evidence confirms the breakdown. However, if price continues to fall and these support levels fail to hold, silver could eventually test support near the 78.6% Fibonacci retracement at $48.29. For now, the $55.40 low remains the immediate decision point, with a breakdown favoring trend continuation and a sustained recovery potentially establishing a higher swing low.
Silver Price Forecast
Every new Silver analysis as it publishes, today's technical signal and key levels, live price — on one page.
See all Silver forecastsIf you’d like to know more about how to trade gold and silver, please visit our educational area.