
SP500 Gains Ground Despite Rising Treasury Yields
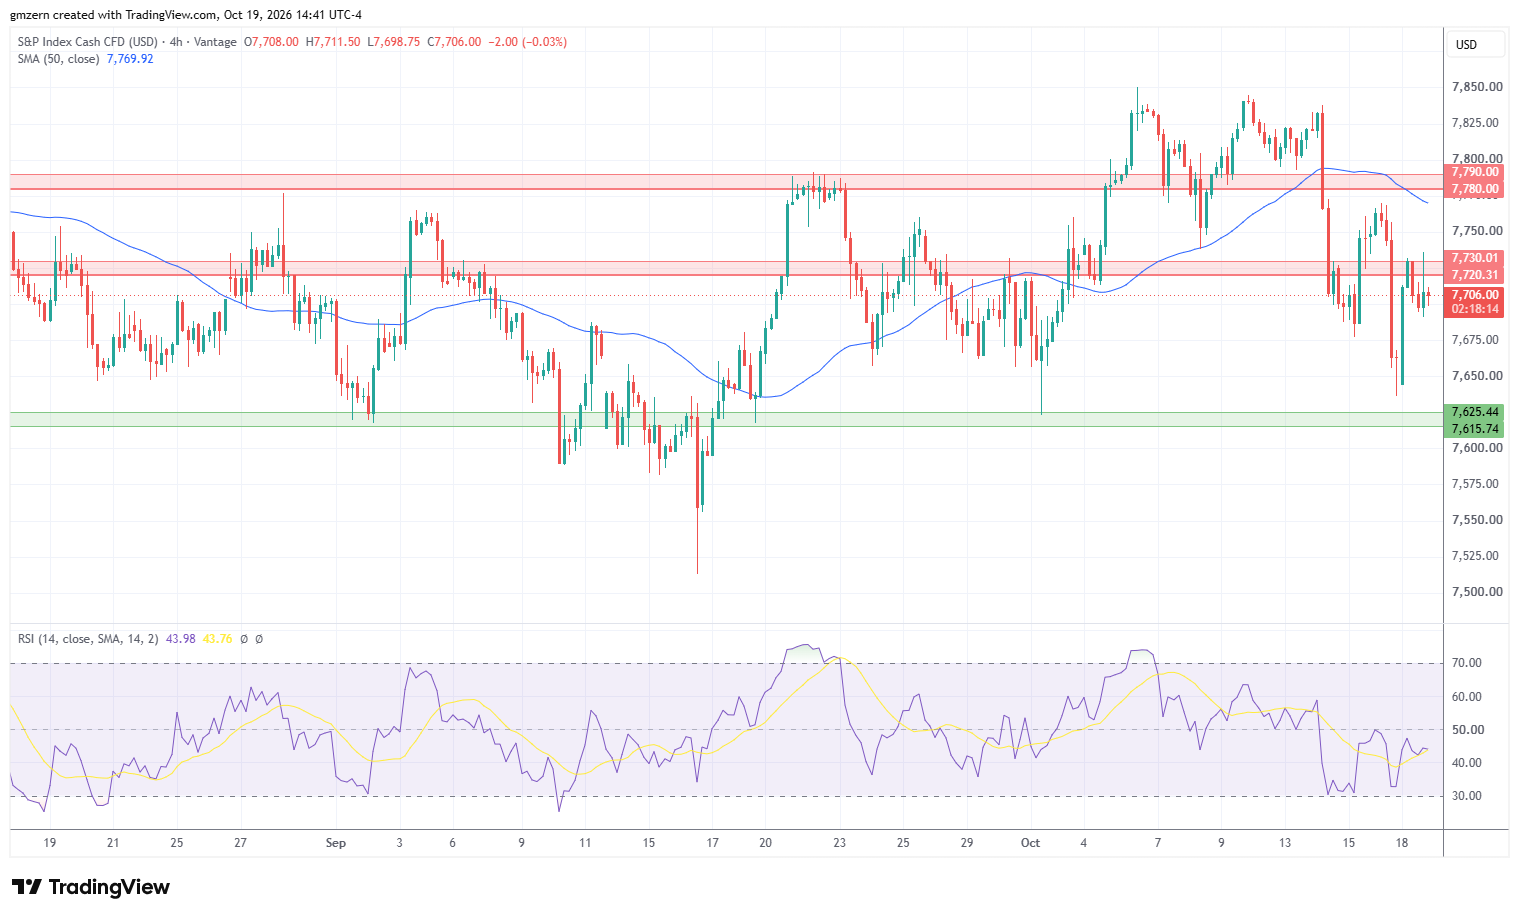
SP500 moved higher amid rebound in the tech sector. The strong performance of tech stocks provided sufficient support to the SP500 index, although traders have also focused on rising Treasury yields and monitored the challenging situation in Saudi Arabia.
The yield of 2-year Treasuries climbed above the 4.75% level, while the yield of 10-year Treasuries settled above 5.12%. Bond yields moved higher as traders focused on rising oil prices.
WTI oil climbed above the $103.00 level as Iran-backed Houthis attacked the Shaybah oil field in Saudi Arabia. Houthis have also attacked several airports. Risks of additional escalation are rising as Iran will likely boost support of the Houthis to push oil prices higher.
President Trump has not announced his decision on Iran, although it is clear that U.S. – Iran negotiations have stalled and the sides of the conflict are not ready for concessions. In my view, oil markets prepare for the potential restart of the military operation against Iran.
Consumer cyclical and tech stocks were among the biggest gainers in the SP500 index today. Utilities and real estate stocks found themselves under pressure as traders focused on rising Treasury yields. Energy stocks moved lower as traders reacted to the pullback in natural gas markets.
SP500 has recently made an attempt to settle above the resistance level at 7720 – 7730 but failed to develop sufficient upside momentum and pulled back. In case SP500 settles above 7730, it will head towards the 50 MA at 7769. A move above the 50 MA will open the way to the test of the resistance level at 7780 – 7790.

NASDAQ Rebounds As Traders Buy The Dip
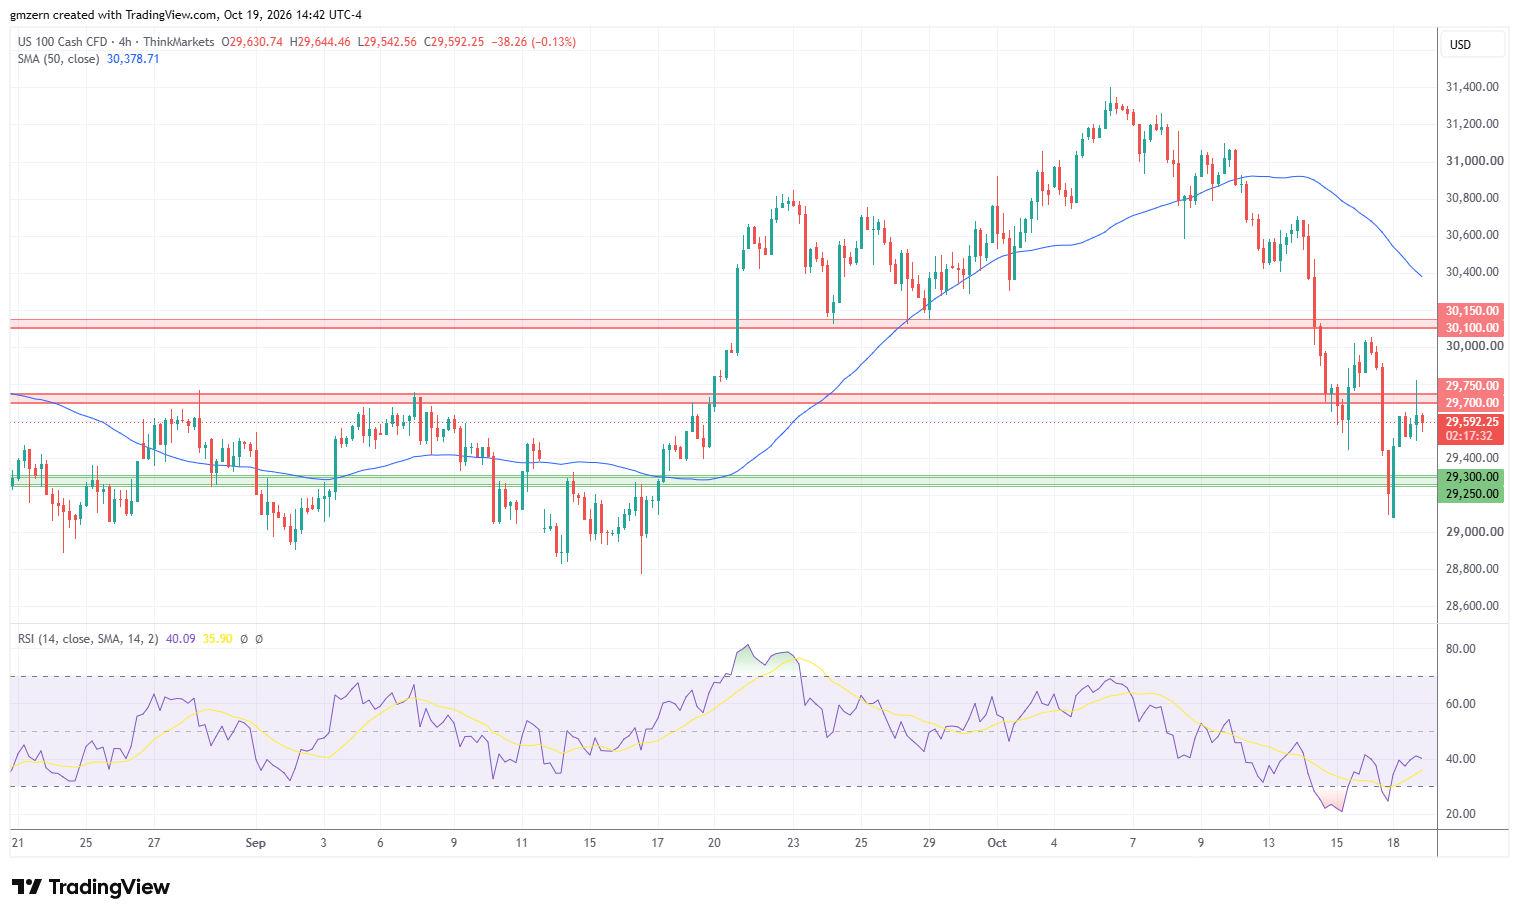
NASDAQ rallied as traders rushed to buy the dip in AI-related stocks. Sandisk, which was up by 6%, was among the biggest gainers in the NASDAQ index today. Other memory chip stocks have also managed to gain strong upside momentum in today’s trading session.
The nearest resistance level for NASDAQ is located in the 29,700 – 29,750 range. In case NASDAQ manages to settle above the 29,750 level, it will head towards the next resistance at 30,100 – 30,150. A move above 30,150 will push NASDAQ towards the 50 MA at 30,378. RSI is in the moderate territory, so there is plenty of room to gain momentum in the near term.
On the support side, a move below the 29,500 level will open the way to the test of the support level at 29,250 – 29,300.
Dow Jones Price Forecast
Every new Dow Jones analysis as it publishes, today's technical signal and key levels, live price — on one page.
See all Dow Jones forecastsDow Jones Attempts To Settle Above 52,000
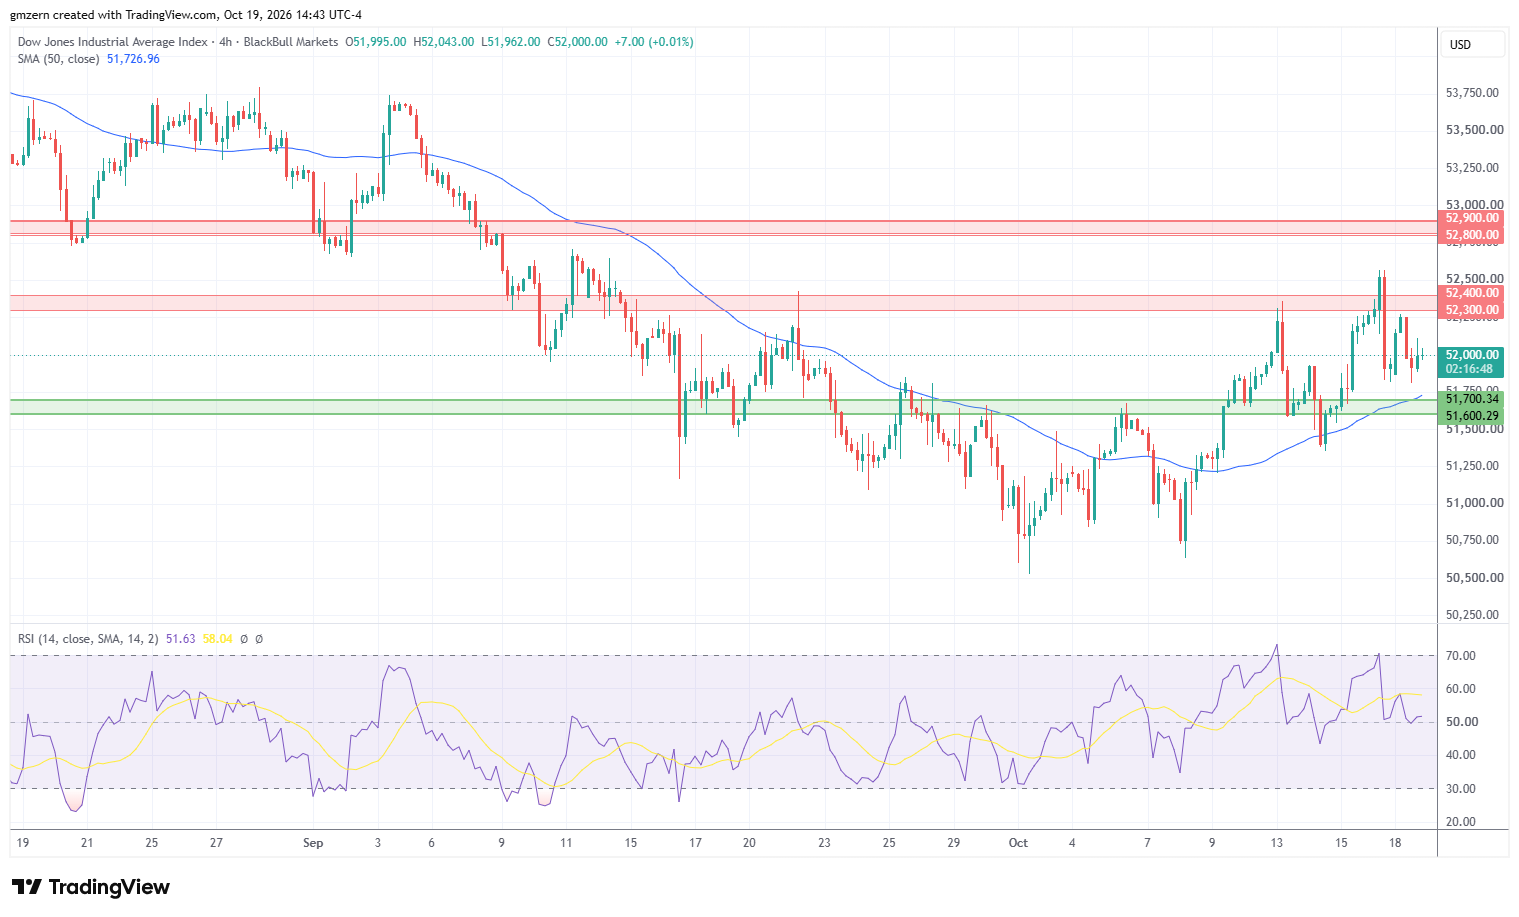
Dow Jones managed to gain some ground amid rising demand for tech stocks. However, the index failed to gain material upside momentum as traders have also focused on high oil prices and rising Treasury yields.
In case Dow Jones settles above the 52,000 level, it will head towards the resistance level at 52,300 – 52,400. A move above the 52,400 level will push Dow Jones towards the next resistance at 52,800 – 52,900.
On the support side, a move below the 51,900 level will push Dow Jones towards the nearest support, which is located in the 51,600 – 51,700 range.
For a look at all of today’s economic events, check out our economic calendar.