Storage Data and Weather Impact on Natural Gas
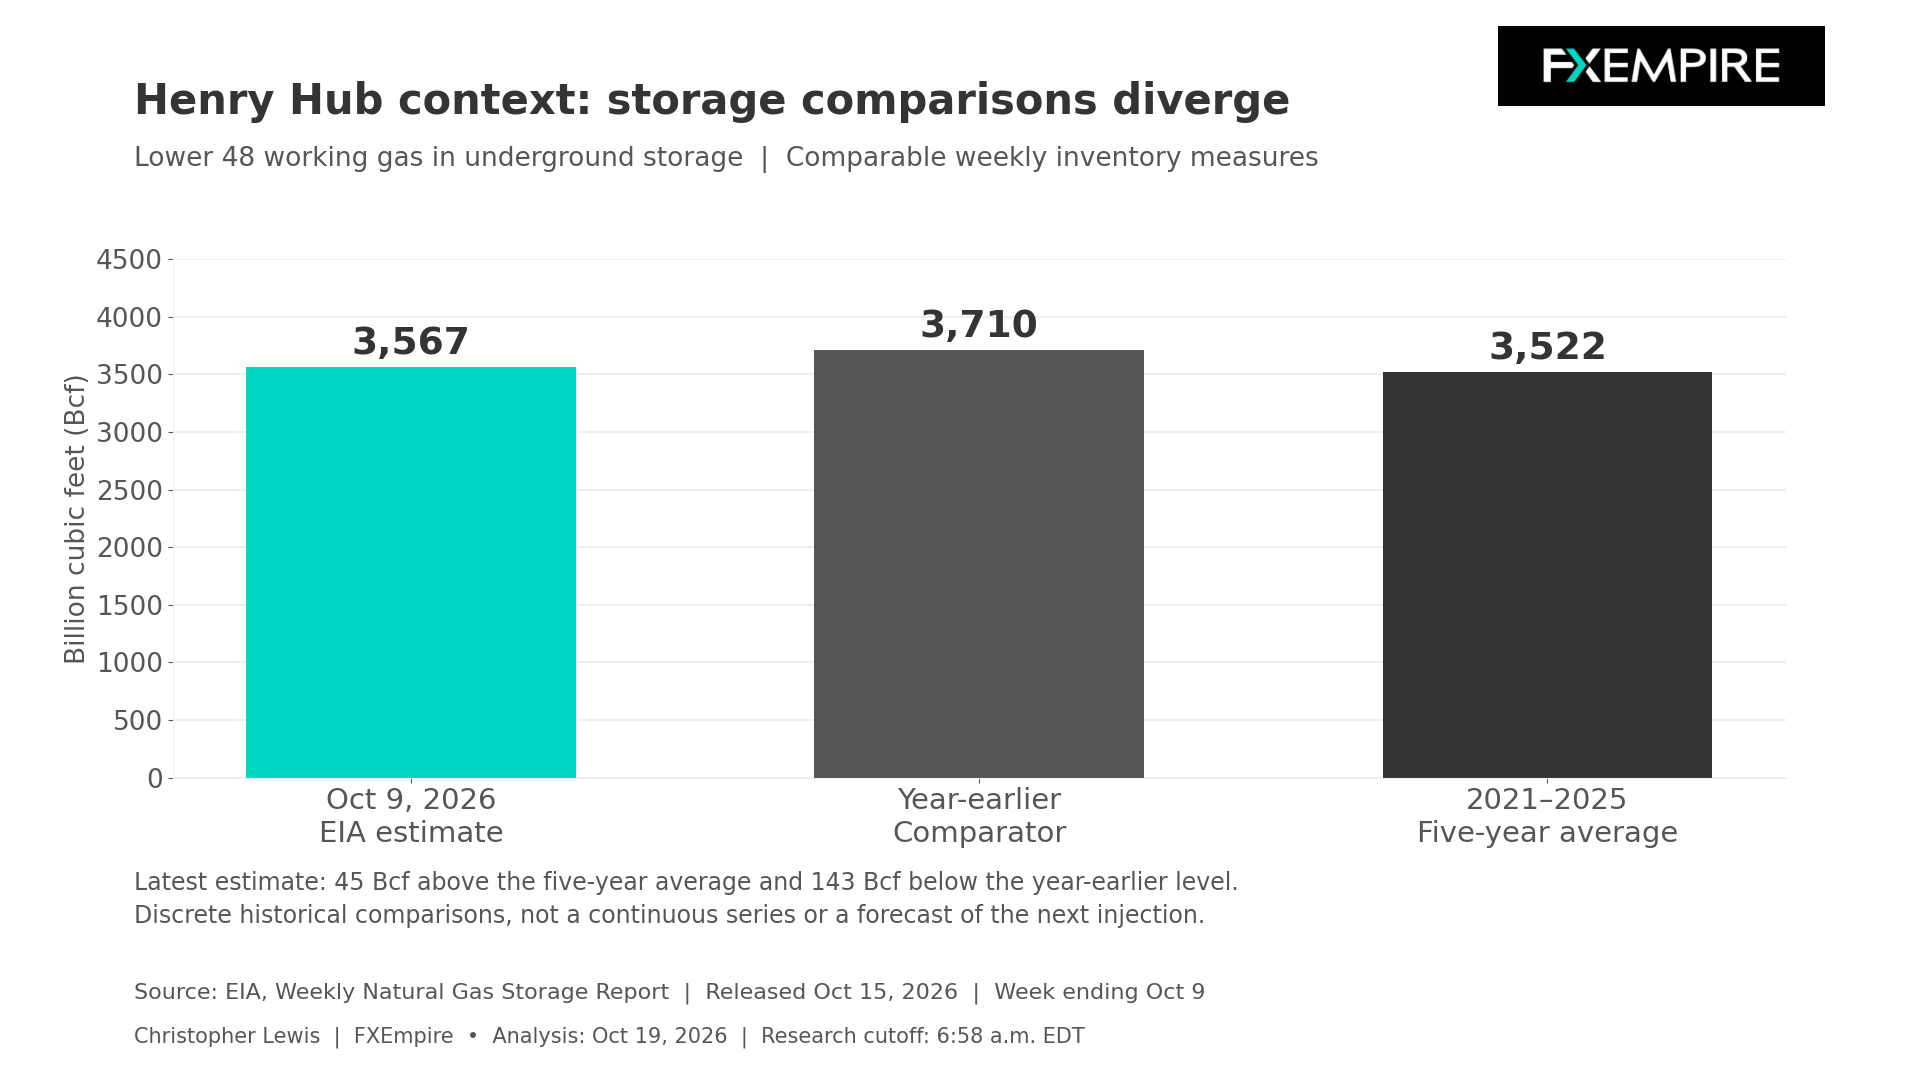
U.S. natural gas begins Monday with a small national storage cushion against its seasonal average but a less comfortable comparison with last year. The latest EIA storage report, released on Oct. 15, estimated Lower 48 working gas at 3,567 Bcf for the week ending Oct. 9. Inventories increased 67 Bcf from the preceding week. Stocks were 45 Bcf above the five-year average and 143 Bcf below the year-earlier level.
The combination argues against describing the market as either uniformly oversupplied or already short of winter gas. The comparison between seasons offers some protection against ordinary demand, while the year-on-year deficit indicates a smaller cushion than last autumn. Weather revisions can therefore matter more than the national total alone suggests. The next EIA storage report is scheduled for Thursday and will be watched closely.
Regional detail also causes a few wrinkles. South Central stocks were at 1,097 Bcf, compared with a five-year average of 1,132 Bcf. Within that region, salt cavern stocks were 236 Bcf against a 279 Bcf average. Other regions partially offset that shortfall in the national comparison. These figures are relevant to the Gulf area balance associated with Henry Hub, but do not by themselves establish any pipeline constraint.
The latest official weather outlook leans against a broad late-October heating surge. NOAA’s Climate Prediction Center issued a discussion at 3 p.m. EDT on Oct. 18 for Oct. 24-28. It favored above-normal temperatures across most of the eastern half of the country, with probabilities exceeding 80% in parts of the Upper Midwest. Cooler-than-normal odds were elevated in parts of the West, while portions of the eastern seaboard leaned closer to normal.
These are probabilities relative to seasonal norms, not measured temperatures or quantified gas-demand forecasts. A warm Upper Midwest could restrain heating needs compared with a colder alternative. However, the location and duration of any outbreaks of cold will still matter, and warm conditions can retain some cooling demand in the very deep South.
EIA’s October Short-Term Energy Outlook provides a broader benchmark with an important timing limitation. Released on Oct. 6 and current through Oct. 1, it forecasts storage of 3,850 Bcf at the end of October, roughly 2% above the five-year average. This is a modeled result, not gas already measured in storage. It also predates NOAA’s Oct. 18 forecast and subsequent operational developments.
LNG demand remains important background rather than verified fresh acceleration today. EIA’s Sept. 1 analysis reported that first-half LNG exports out of the United States were averaging 17.4 Bcf per day, up 23% from the first half of 2025. This establishes the scale of demand for exports over that historical period, not current terminal feed gas or this week’s cargo departures. The accessible text of the current weekly supplement did not provide usable figures for this review, so the LNG total is still a delayed figure.
For the Henry Hub balance, actual production, recovery or losses, sustained liquefaction demand, and power-sector consumption could offset the weather signal, but new export capacity matters only if it starts drawing and processing gas. Construction commitments are not delivered exports. A regional price dislocation would need location-specific flow and constraint evidence before it could be generalized to the national benchmark.
Monday’s focus will be whether weather forecast warmth persists and whether the next storage observation preserves the modest seasonal surplus. More warmth alongside steady supply would reduce urgency to secure winter gas. Colder revisions, verified production losses, or stronger actual export reports would reverse that interpretation.

Technical Price Action
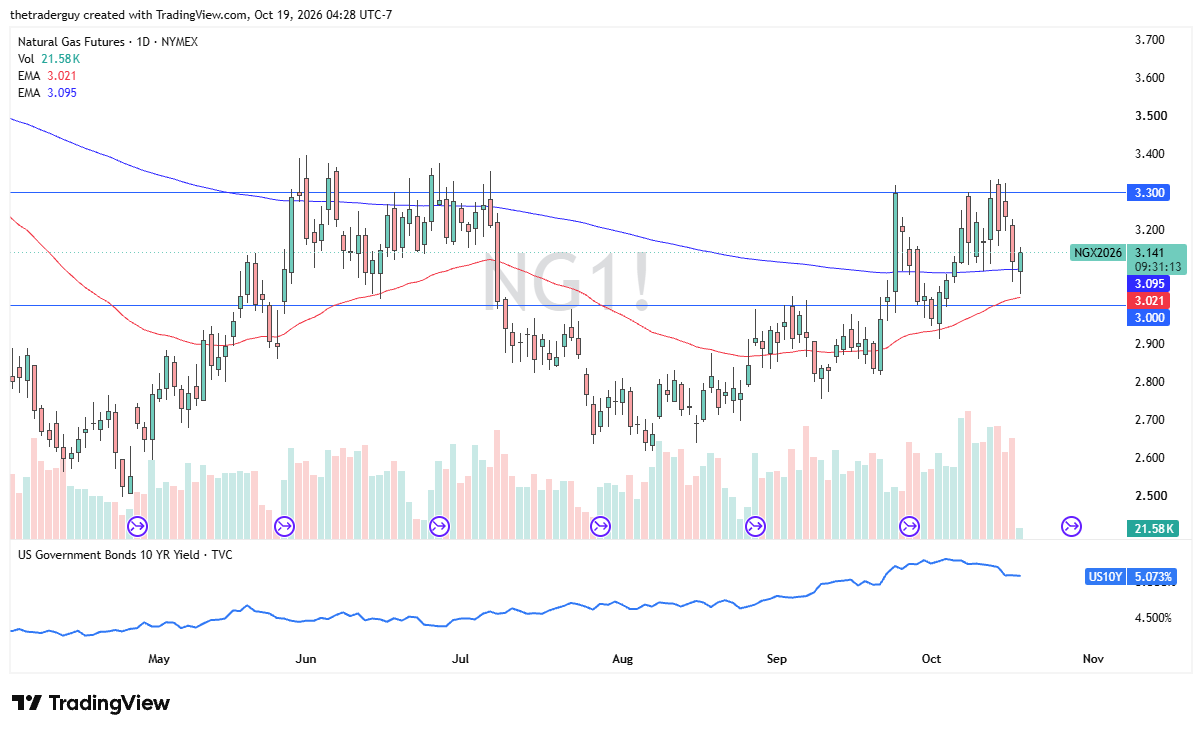
Currently, it looks as if the natural gas market gapping lower and then slamming into the 50-day EMA before bouncing shows the uncertainty when it comes to the natural gas market
Other than that, it does point out that we are still very much in the same consolidation area that we had been in, between $3 on the bottom and $3.30 on the top. With all of the questions about natural gas and weather, it looks as if the market is still very much in a holding pattern in this range, so a bounce would not have been very surprising after that plunge.
Natural Gas Price Forecast
Every new Natural Gas analysis as it publishes, today's technical signal and key levels, live price — on one page.
See all Natural Gas forecastsI do believe that we remain very noisy and choppy, and things will be more of a sideways nature.