Silver kicks off the week with 2 fundamental inputs hanging over the market: an improvement in measured U.S. manufacturing activity and a further decline in Treasury real yields.
Manufacturing Output
The industrial evidence became available on Friday when the Federal Reserve reported that manufacturing output increased 0.3% during the month of September. This does offer a little bit of a more favorable demand backdrop than an assumption of uninterrupted factory weakness. It does not directly measure silver purchases or establish the metal’s price response, though.
Durable Manufacturing
The details make the industrial story more useful. Durable manufacturing output increased 0.1%, while non-durable production rose 0.4%. Electrical equipment, appliances, and components were among the durable industries posting gains of at least 1%. Motor vehicles and parts, however, declined 3%. That divergence is a reminder that manufacturing improvement overall can coexist with weakness in important end markets.
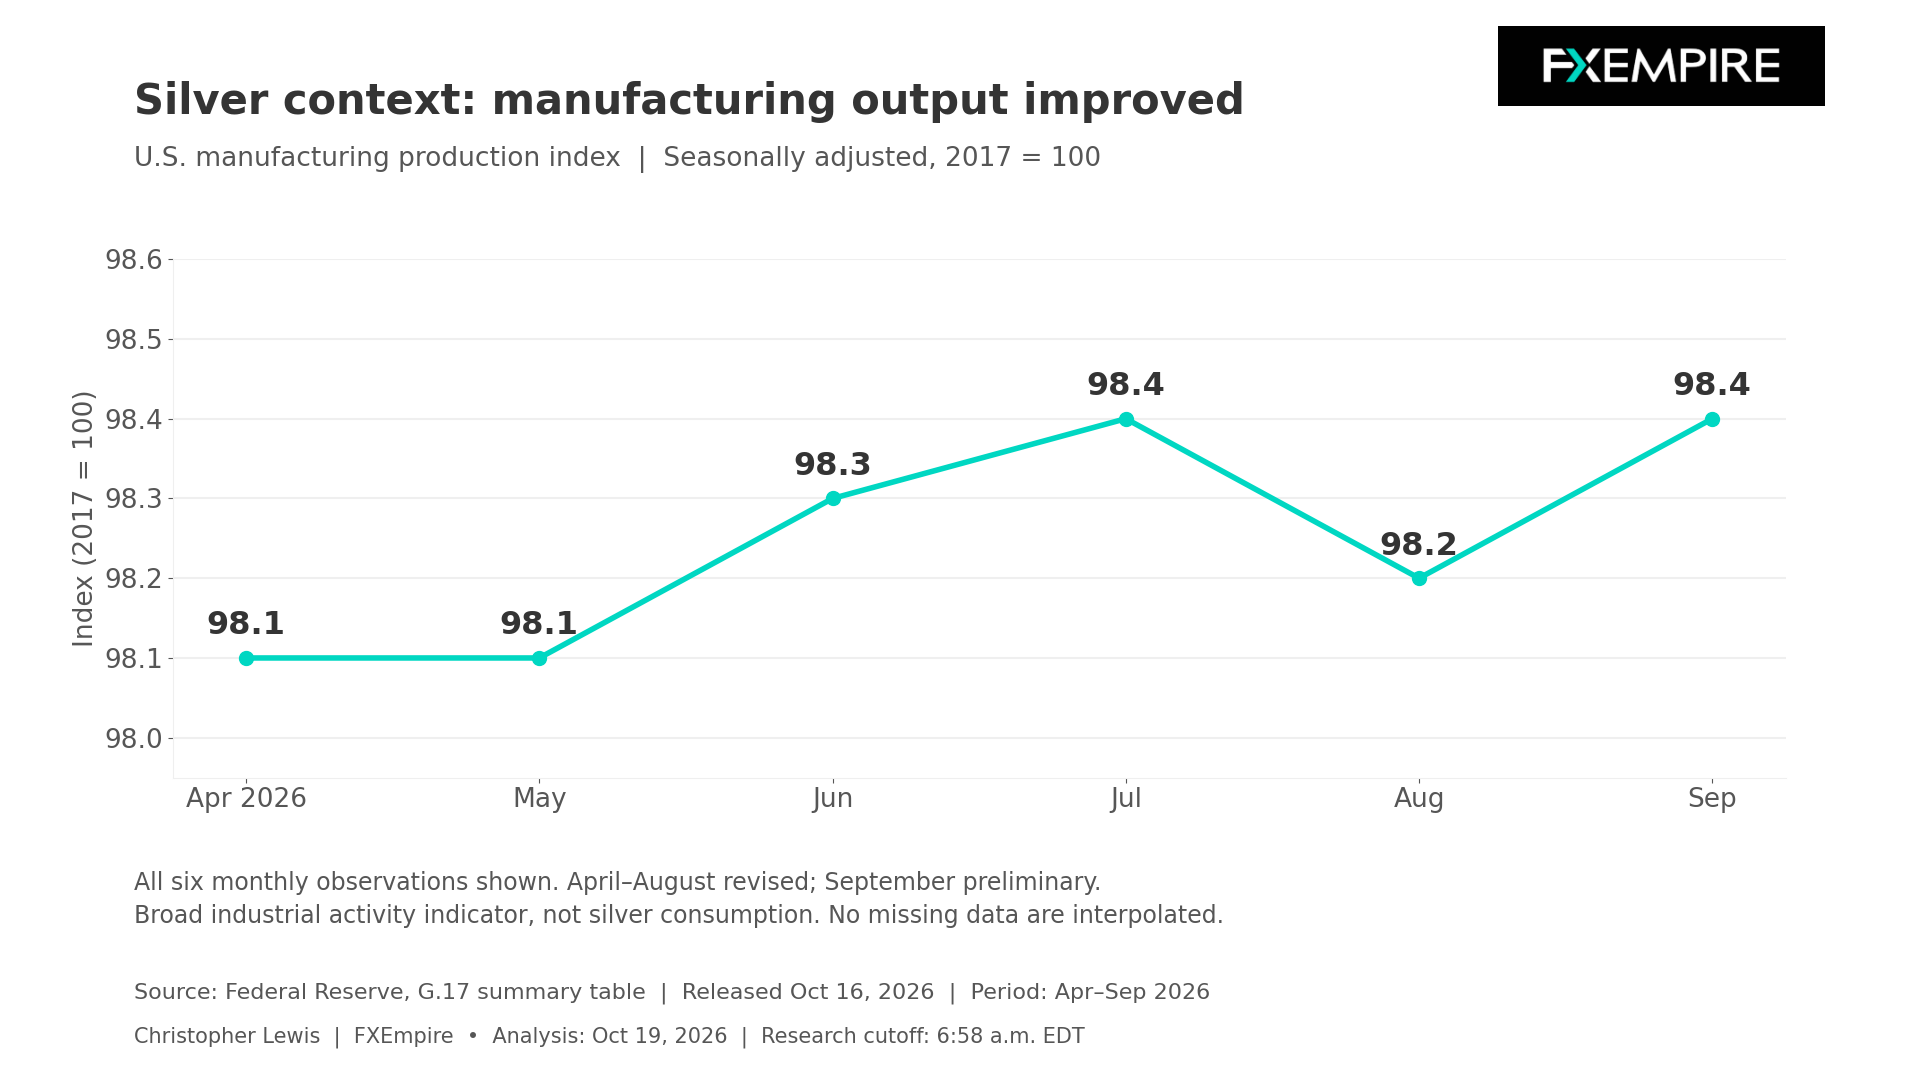
The chart below plots the revised manufacturing index from April through September, with 2017 equal to 100. September’s preliminary level was 98.4 compared with 98.2 in August. All 6 monthly observations are shown so we can see the overall choppiness of manufacturing index readings.
Industrial Inputs
Silver’s industrial relevance is structural. Electrical circuits, batteries, and solar cells are some of the big components of manufacturing that silver is heavily involved in, according to the USGS. These help explain why manufacturing and investment spending deserve attention alongside monetary conditions. In this sense, it does make silver a bit of a different animal than gold.
Silver Price Forecast
Every new Silver analysis as it publishes, today's technical signal and key levels, live price — on one page.
See all Silver forecastsThey do not provide solar installations, electronic orders, or silver consumption increases today, though. They simply show the backdrop.
10-Year Real Yield
The financial side of the balance became more accommodating by Friday, as the 10-year real yield from Treasury estimates declined to 2.74% on October 16 from 2.78% Thursday and 2.91% on October 9. Lower inflation-adjusted returns can reduce the opportunity cost of holding non-interest-bearing assets like silver.
Inflation remains the main complication. September final-demand PPI increased 1.3% monthly, seasonally adjusted, in the October 15 release. Energy prices within final-demand goods also increased 10.8%, a major sticking point, while goods excluding food and energy rose 0.3%. Higher business costs can encourage interest in precious metals, but can also be a squeeze on industrial margins.
CPI Input
Consumer inflation supplies the policy connection. The October 14 CPI release showed seasonally adjusted September increases of 0.6%, or 0.3% excluding food and energy. These numbers describe household prices rather than factory volumes, but persistent consumer inflation could limit the scope for easier monetary policy coming out of the Federal Reserve, even if industrial sectors weaken.
Friday’s import-price release showed a 0.7% monthly rise in non-fuel imports without seasonal adjustment. This adds another cost indicator to the discussion rather than confirmation that factories expanded output during October.
Activity and price matter, especially for silver. A strong nominal spending figure could reflect more expensive inputs instead of additional physical demand. There is also a difference between favorable demand environments and physical shortage. There is not necessarily a new inventory draw conclusion from this, mine disruption, or exchange delivery squeeze without verified information. A transfer between stock categories would not necessarily mean that industrial users consumed additional silver.
The next major monetary decision will be the Federal Reserve’s October 27 and 28 meeting. For Monday, the supportive combination would be real yields remaining lower while industrial evidence confirms some demand. Renewed upward pressure on yields would challenge the investment side. Weaker factory activity would challenge the physical side. Gold market strength could help sentiment toward silver, but would not necessarily settle either one of these questions.
Technical Analysis
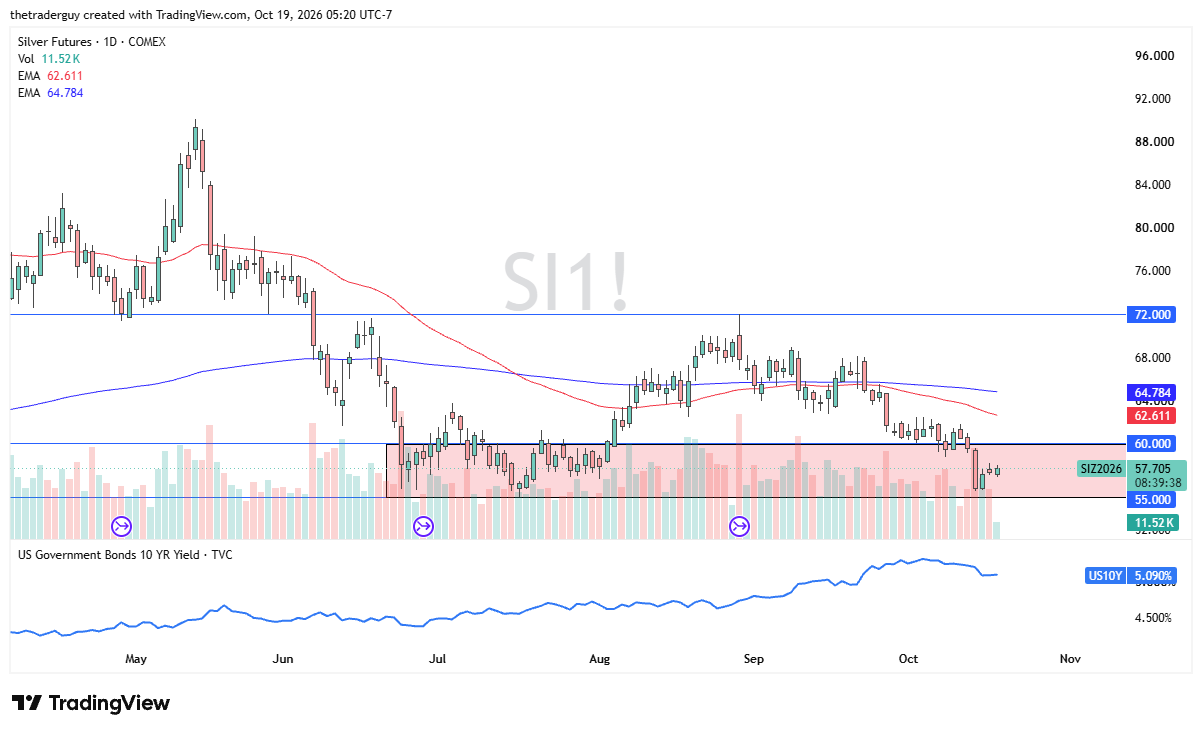
Silver is sitting in a major demand zone that extends from $55 on the bottom to $60 on the top. We are sitting basically in the middle of it, so it is worth watching how this market plays out over the next several days, with the idea being that there should be quite a bit of support.
Short-term pullbacks do offer buying opportunities as far as I can tell, but I also recognize that this is a market that is very choppy and somewhat sideways, so I am not looking for major moves. A breakdown below the $55 level would have me very bearish on silver, though.