Pullback Deepens as 20-Day Average Fails
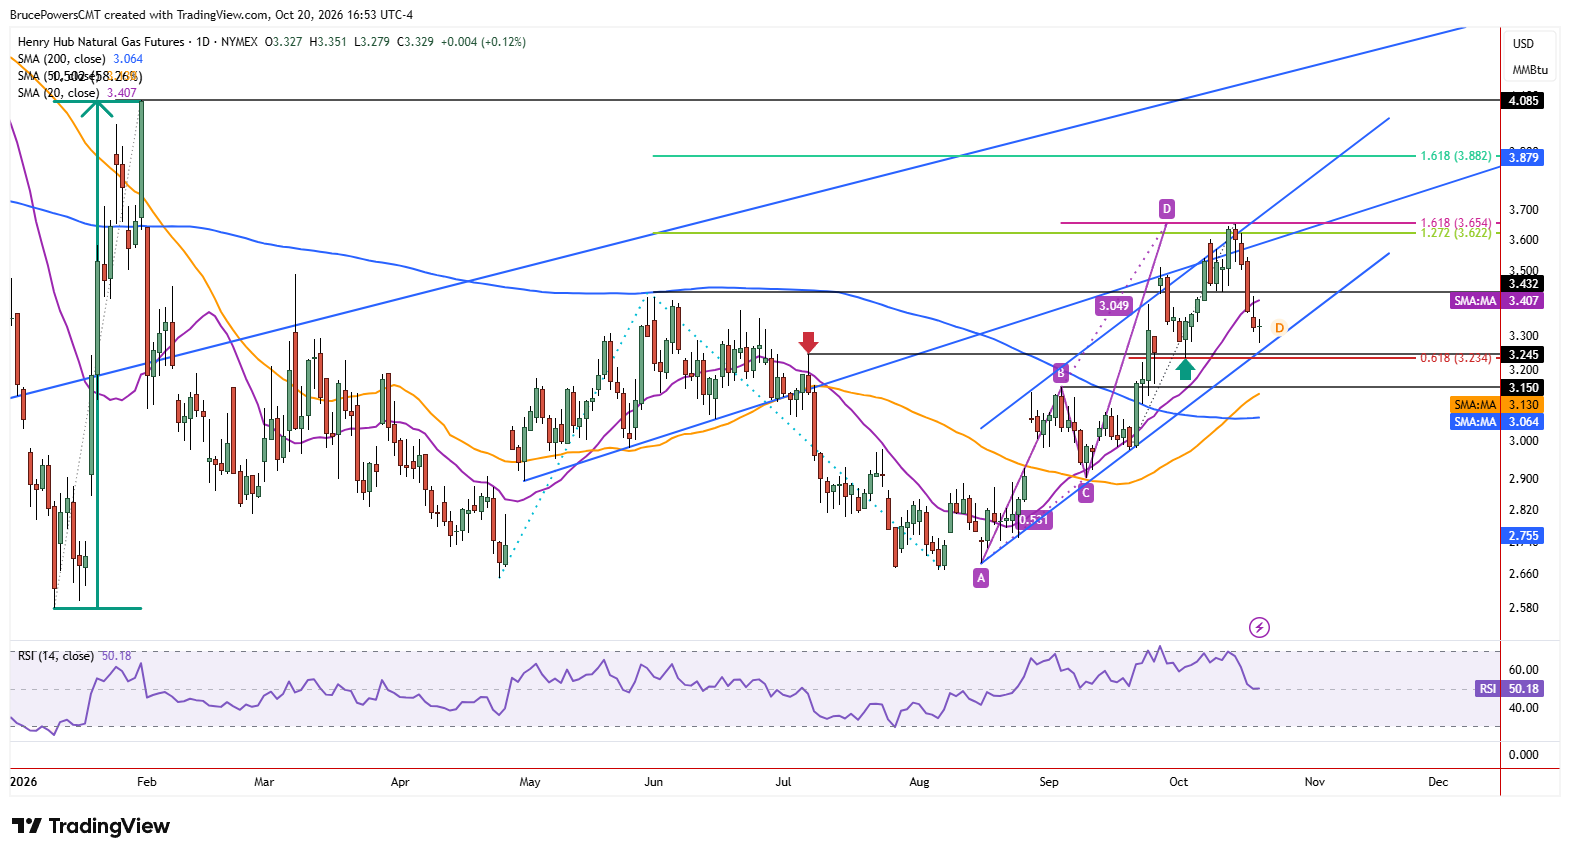
Natural gas extended its pullback from a $3.65 peak reached last week to a low of $3.28 on Tuesday. During the decline from the peak, potential support near the 20-day moving average at $3.41 was broken on Friday and further recognized as resistance with Tuesday’s new low. The failure of support at the 20-day moving average puts the recent higher swing low in play at $3.23, reinforced by the 61.8% Fibonacci retracement at the same level.

Rising Channel Offers a Potential Support Test
Since last week’s bearish reversal signals occurred from near the top of a rising channel, the lower boundary of the channel becomes a possible target. The lower boundary is currently a little higher than the swing low and therefore support could be seen before that low is reached. If strength follows a test of support near the lower channel boundary, then the higher swing low may be retained. If that occurs it would be a sign of retained underlying strength and it could result in another rally within the rising channel structure.
Resistance Confluence Raises Breakdown Risk
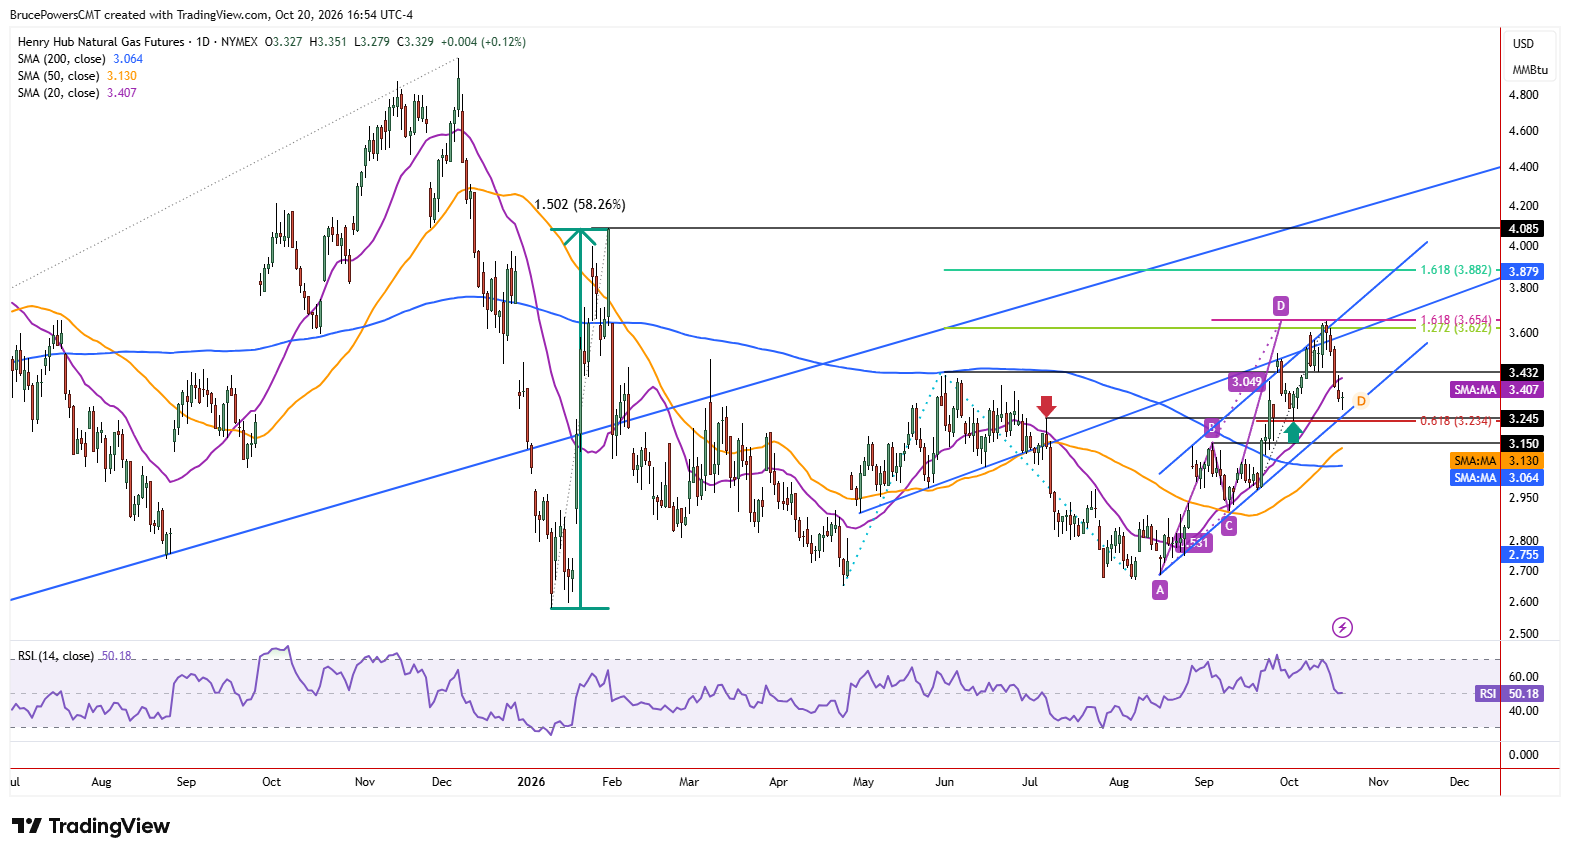
However, last week’s high of $3.65 is reinforced as a resistance zone by the confluence of several indicators. A 161.8% Fibonacci projection for a rising ABCD pattern completed near that high, along with the 127.2% Fibonacci extension of the prior decline. The top of the channel was mentioned above but there is also a rising trendline that previously represented support converging near the highs. Given the multiple indications of resistance, the $3.23 low is at risk of failure. That would provide a bearish reversal signal and add bearish pressure. It would also signal a breakdown from the rising channel structure.
$3.13–$3.15 Zone Becomes a Downside Target
The lower potential support zone is defined by the prior high at $3.15 (B) and the rising 50-day moving average near $3.13. Just by the fact that the 20-day moving average has failed as support, the 50-day moving average becomes a potential downside target. So, given the bearish response to a strong resistance zone, there is a real possibility that the lower support area could eventually be tested before the bearish correction completes.