Recovery Rally Challenges Long-Term Downtrend
ServiceNow Inc. (NOW), an enterprise software company, advanced to a new recovery high of $154.20 last week, as it tested a key near-term resistance zone first approached in August. The advance followed a higher swing low of $81.24 from April and the subsequent reclaim of the 50-week moving average in August. Additional bullish confirmation looks likely to occur soon, with the 20-week moving average to cross above the 50-week average, further suggesting that the 66% bearish correction that followed the January peak of $239.62 may have completed.

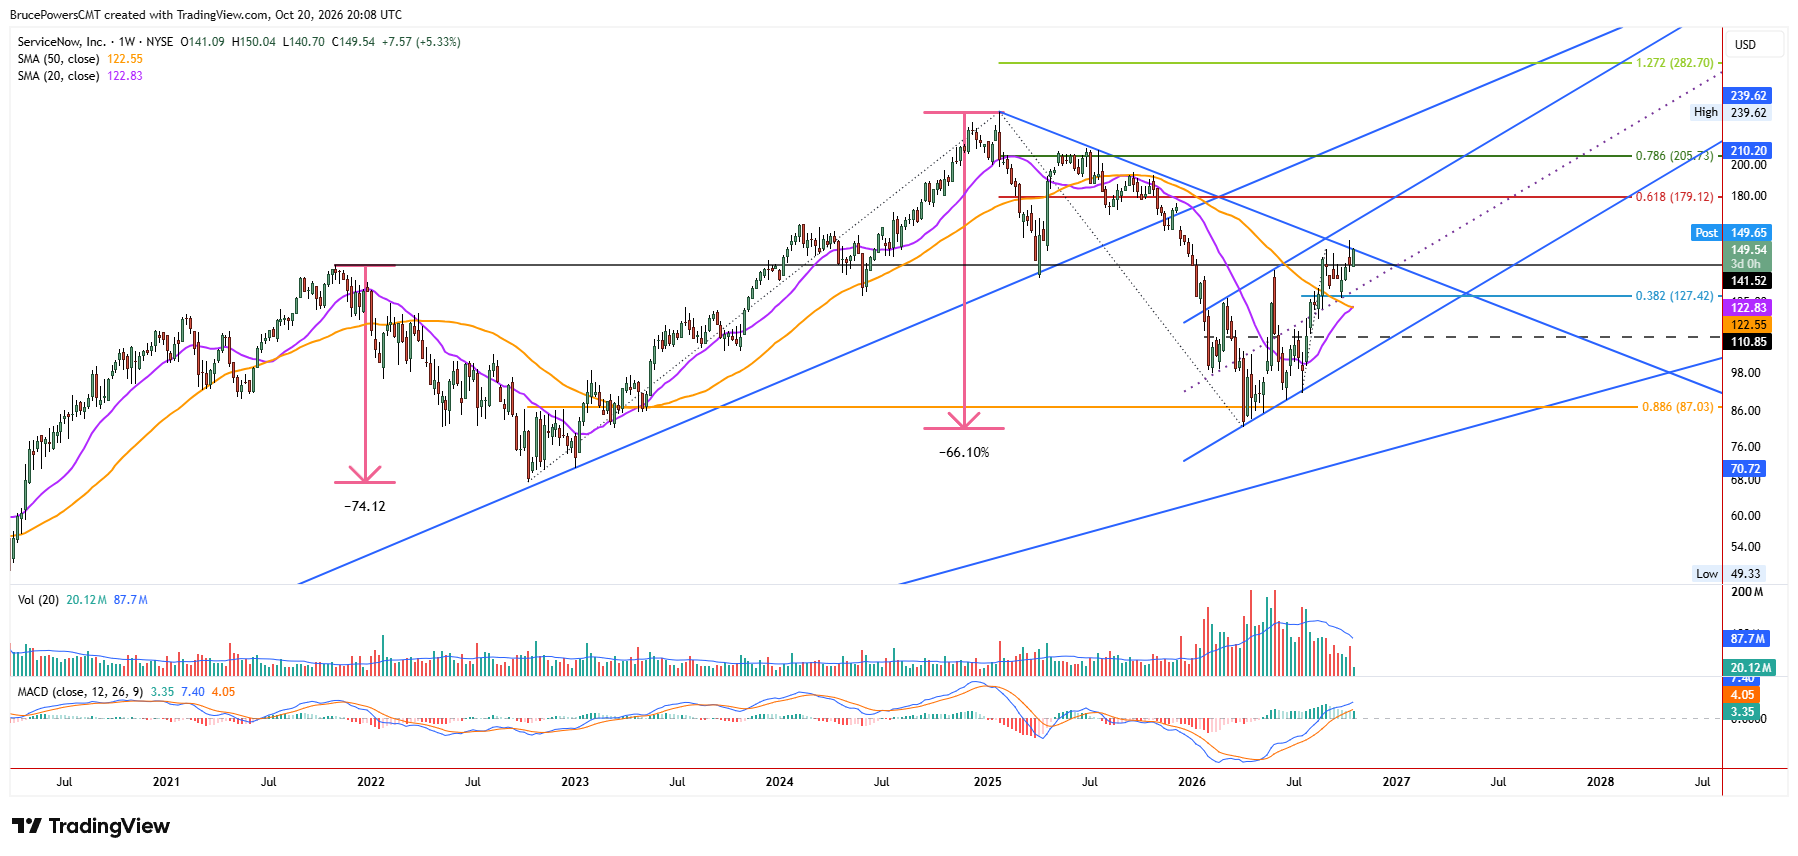
Former Resistance at $141.52 Becomes a Test of Strength
NOW has risen to a key resistance zone marked by a falling trendline. But it looks poised to eventually attempt a breakout and signal a continuation of the developing advance. Last week a key resistance level at $141.52 from a peak in 2021 was recovered more significantly than earlier attempts starting in late-August. Progress was indicated by almost the full week’s range being contained above the level for the first time since early January and this week is on track to do something similar. This shows strengthening.
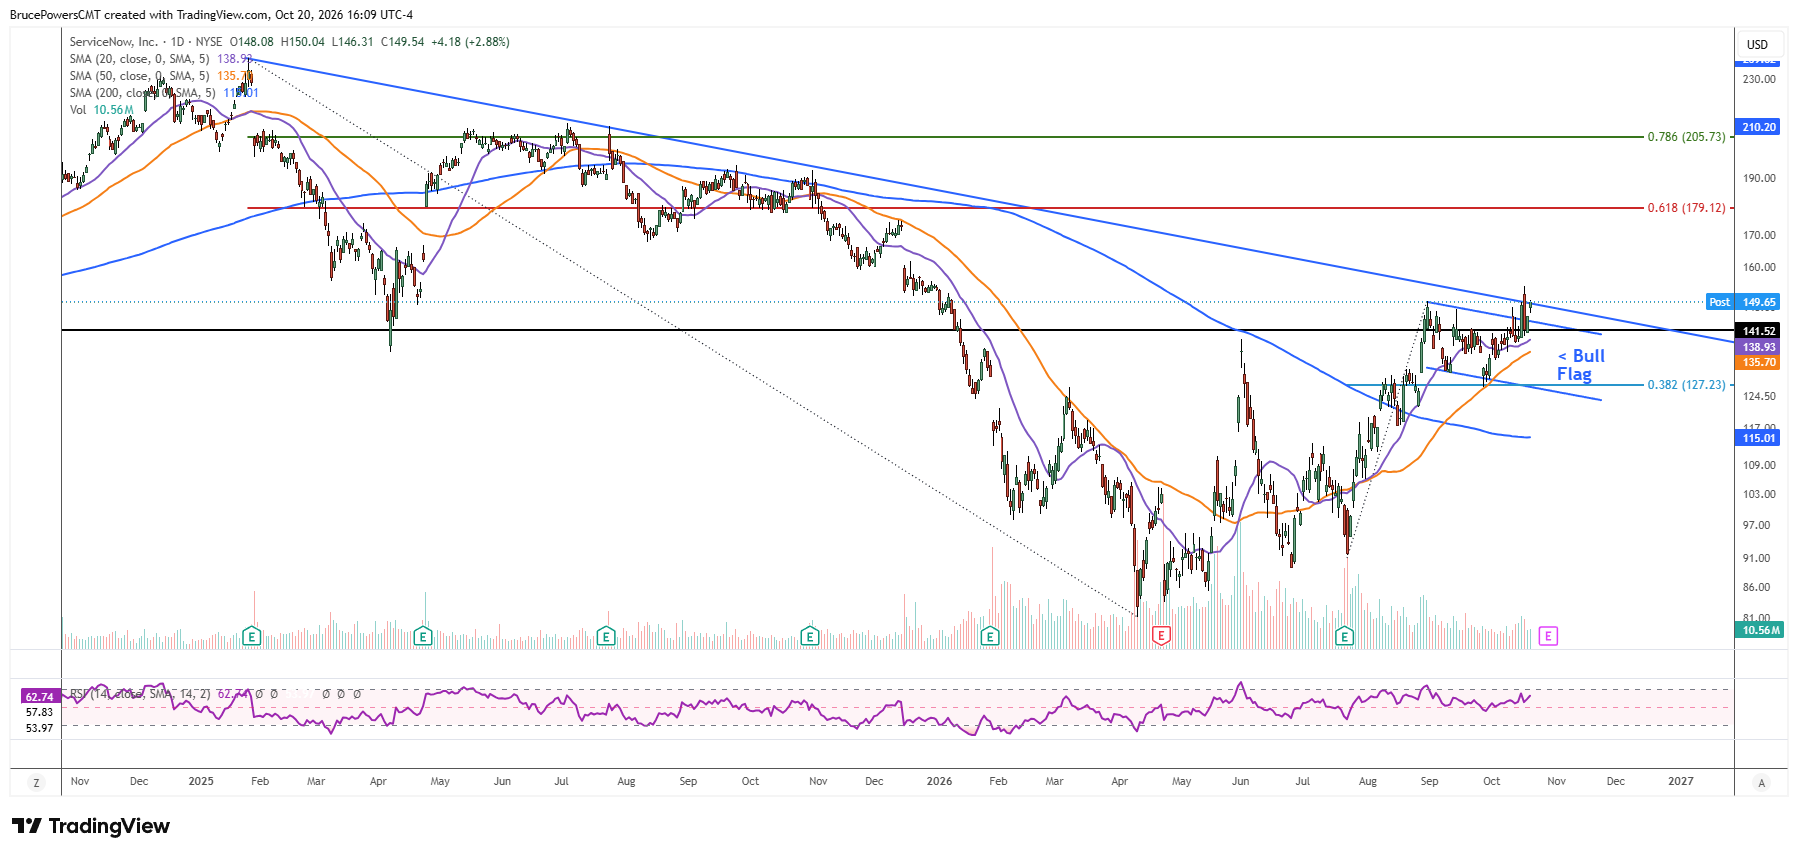
Higher Swing Low Reinforces Bullish Structure
Moreover, it occurred following the completion of the most recent pullback and establishment of a higher swing low at $126.75. Strength was indicated following the completion of a 38.2% Fibonacci retracement of the prior advance and a test of support near the 50-week moving average, now near $122.55.
Bullish Flag Breakout Awaits Confirmation
Last week’s advance also signaled a breakout of a bullish flag pattern on the daily chart off support at the 50-day moving average. So far, the breakout could use confirmation of strength with a daily close above the high of the pattern at $149.60. Resistance seen in the flag is aligned with the downtrend line, which could be why there has been a hesitation to break above the trendline so far.
Breakout Could Open a Path Toward $211
Nonetheless, a decisive rally above $154.20 would signal a continuation of the bullish recovery and put NOW on track to test resistance near the 61.8% Fibonacci retracement at $179.12, followed by a lower swing high at $211.48 from July 2025. That higher potential target is reinforced by the 78.6% Fibonacci retracement of the prior decline at $205.73.
If you’d like to know more about technical analysis and how traders use it, please visit our educational area.