Gold Remains in a Critical Technical Decision Zone
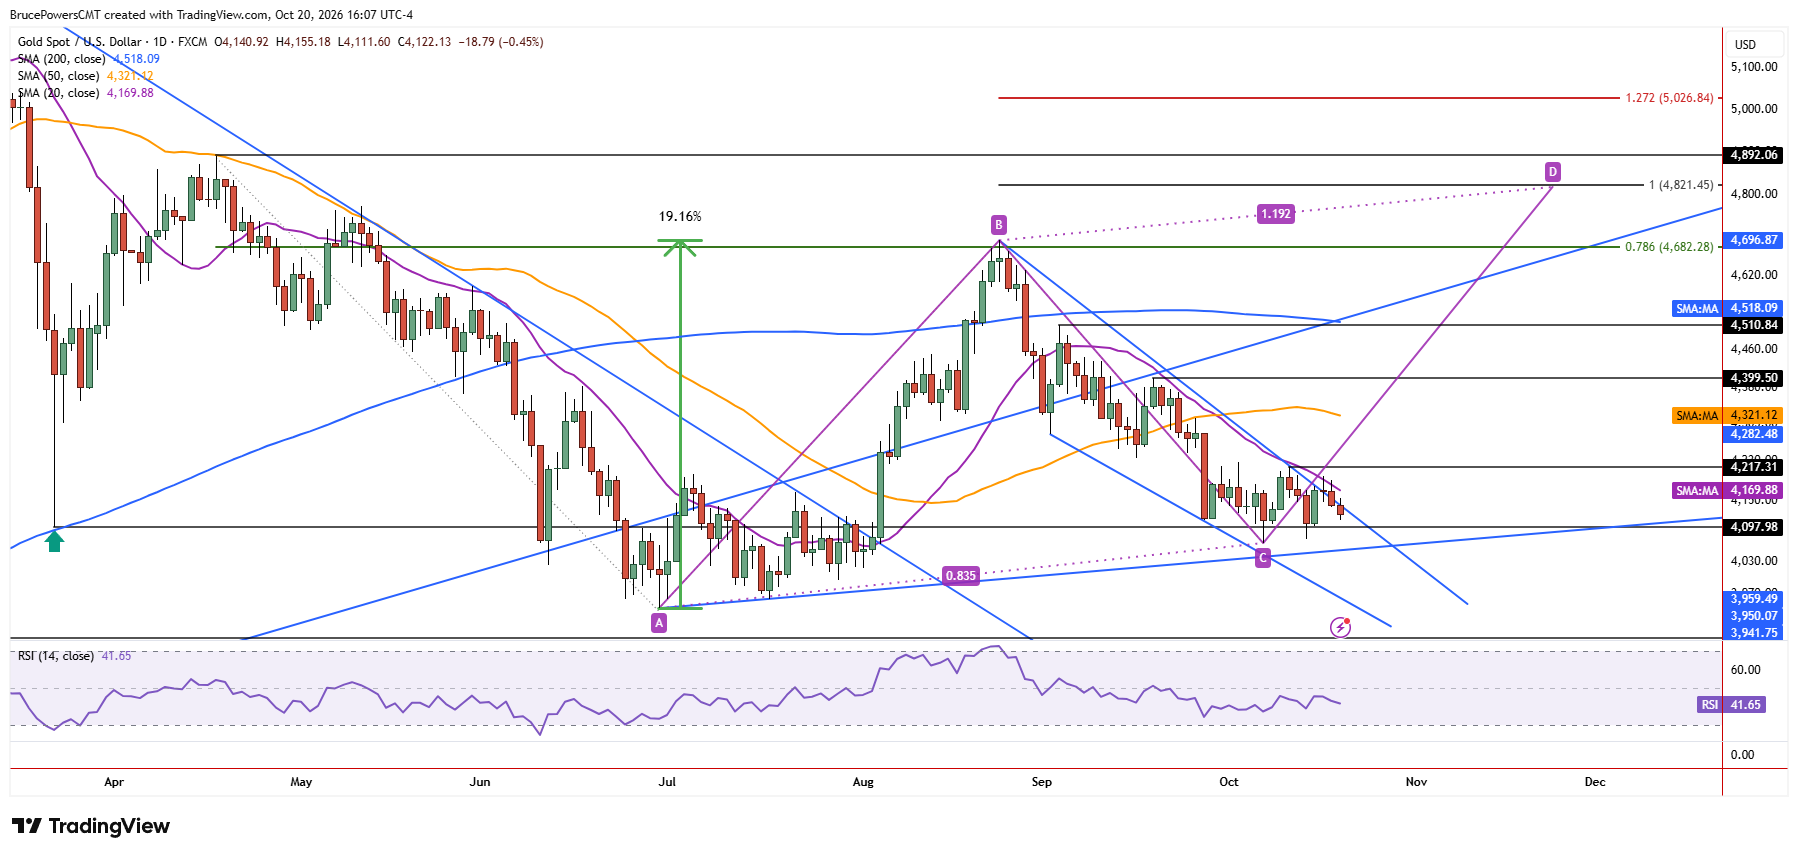
Gold remains at a critical technical juncture, with support near $4,066 and resistance at $4,217 defining the levels that could determine whether the current correction deepens or a bullish reversal takes hold. A reclaim of the 20-day moving average at $4,170 would signal initial strength, although gold would still face resistance at the nearby swing high. A rally above $4,217 would therefore provide a bullish reversal signal on both the daily and weekly charts.

Bullish Reversal Could Unlock a Second Advance
This is a key decision zone for gold, as both bearish trend continuation and a bullish reversal remain possible. A rally above $4,217 would signal a reversal of the current decline and establish a higher swing low, increasing the likelihood that gold could extend its advance in a second leg up from the June low. During the first advance, gold gained a little over 19% to the recent swing high of $4,697. A successful reversal would strengthen the case for another advance, although confirmation is still needed.
Moving Averages Frame Upside Targets Near $4,820
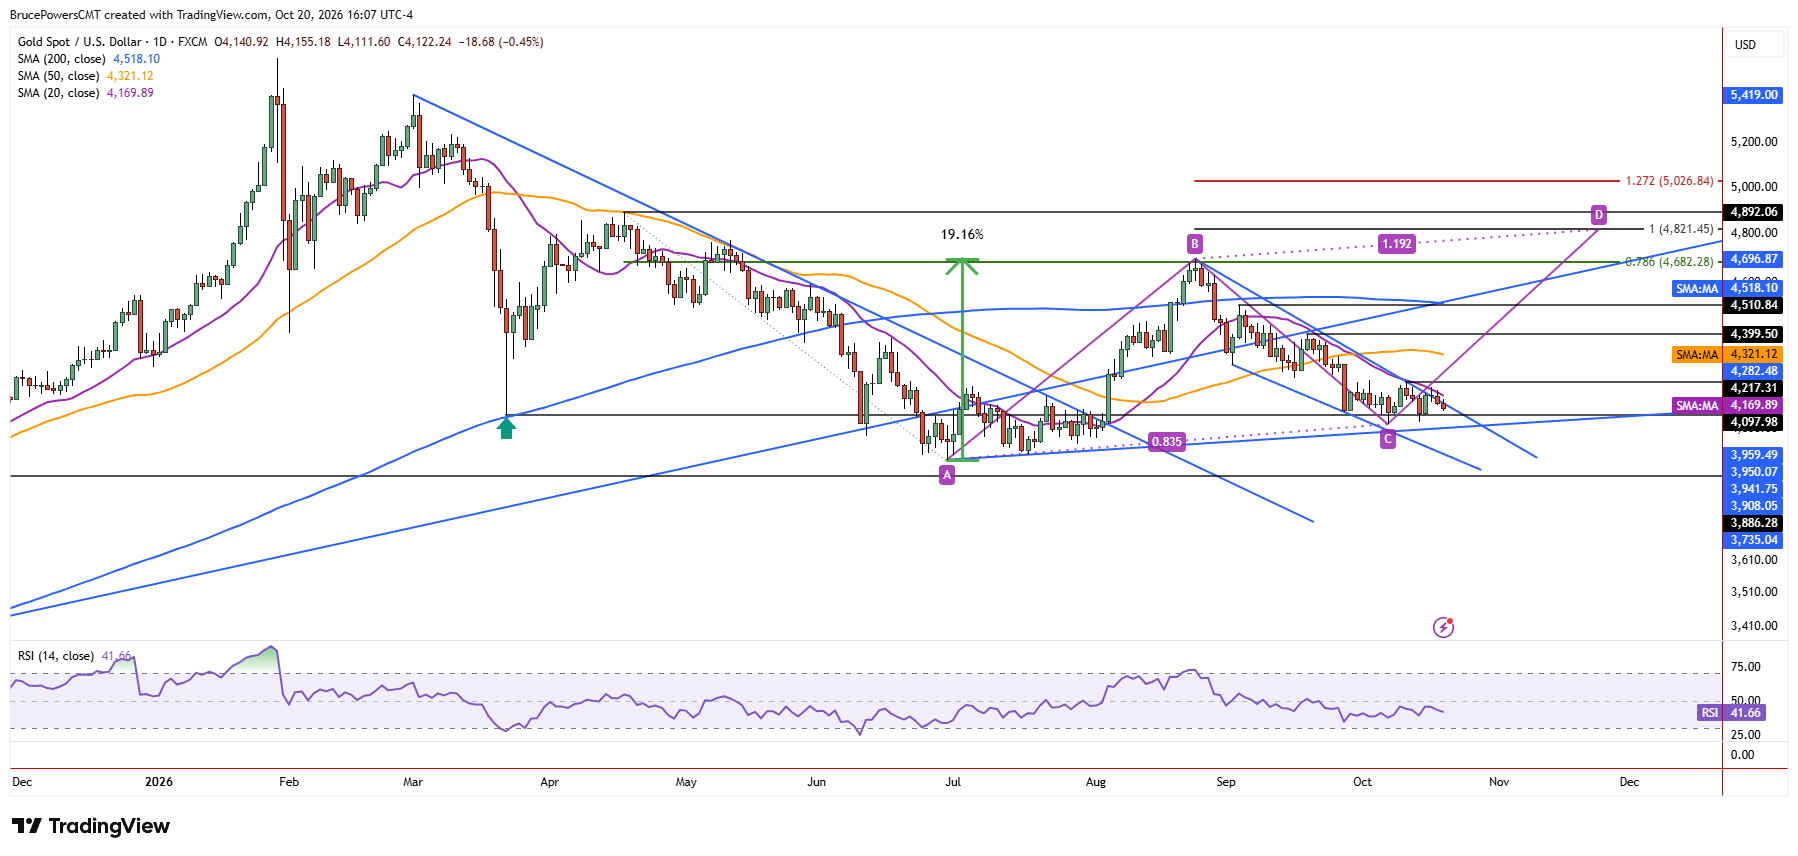
A decisive advance above $4,217 would signal a reclaim of the 20-day moving average and put gold on track to test resistance near the 50-day moving average at $4,321. If successful, gold would then be positioned to test the recent lower swing high of $4,399, followed by the prior lower swing high at $4,511. That level is reinforced by the 200-day moving average near $4,518, creating a key upside target zone if a bullish reversal is signaled and confirmed. If gold establishes a higher swing low and continues to strengthen, a further target near $4,820 could eventually come into play. This level marks the 100% projected upside target for a rising ABCD pattern.
Bearish Breakdown Risks a Deeper Correction
Alternatively, a bearish continuation signal would occur below $4,066. However, with support from the summer consolidation range having been tested recently, downside momentum could remain limited, potentially preventing a decline below the current corrective low of $3,942 from June. Nonetheless, a decisive break below $3,942 would expose a further potential support zone extending to the higher swing low of $3,886 from October 2025.
If you’d like to know more about how to trade gold and silver, please visit our educational area.