



Sellers Have the Weather and November Is Testing $3.00
Natural gas got the forecast sellers wanted. The European model is still showing a much warmer-than-normal pattern through the next 15 days. The GFS is colder, but it is not cold enough to bring buyers back into November.
Monday’s failure was the warning. Tuesday turned it into a break through $3.00. The contract had strong LNG flows and a bullish storage report behind it last week. None of that held once the warm forecasts stayed on the screen. Buyers showed up for the data. They did not show up for the follow-through.
At 11:03 GMT, November Natural Gas futures are trading at $3.005, down $0.112 or -3.59%.

Weekly November Natural Gas Futures Technical Analysis
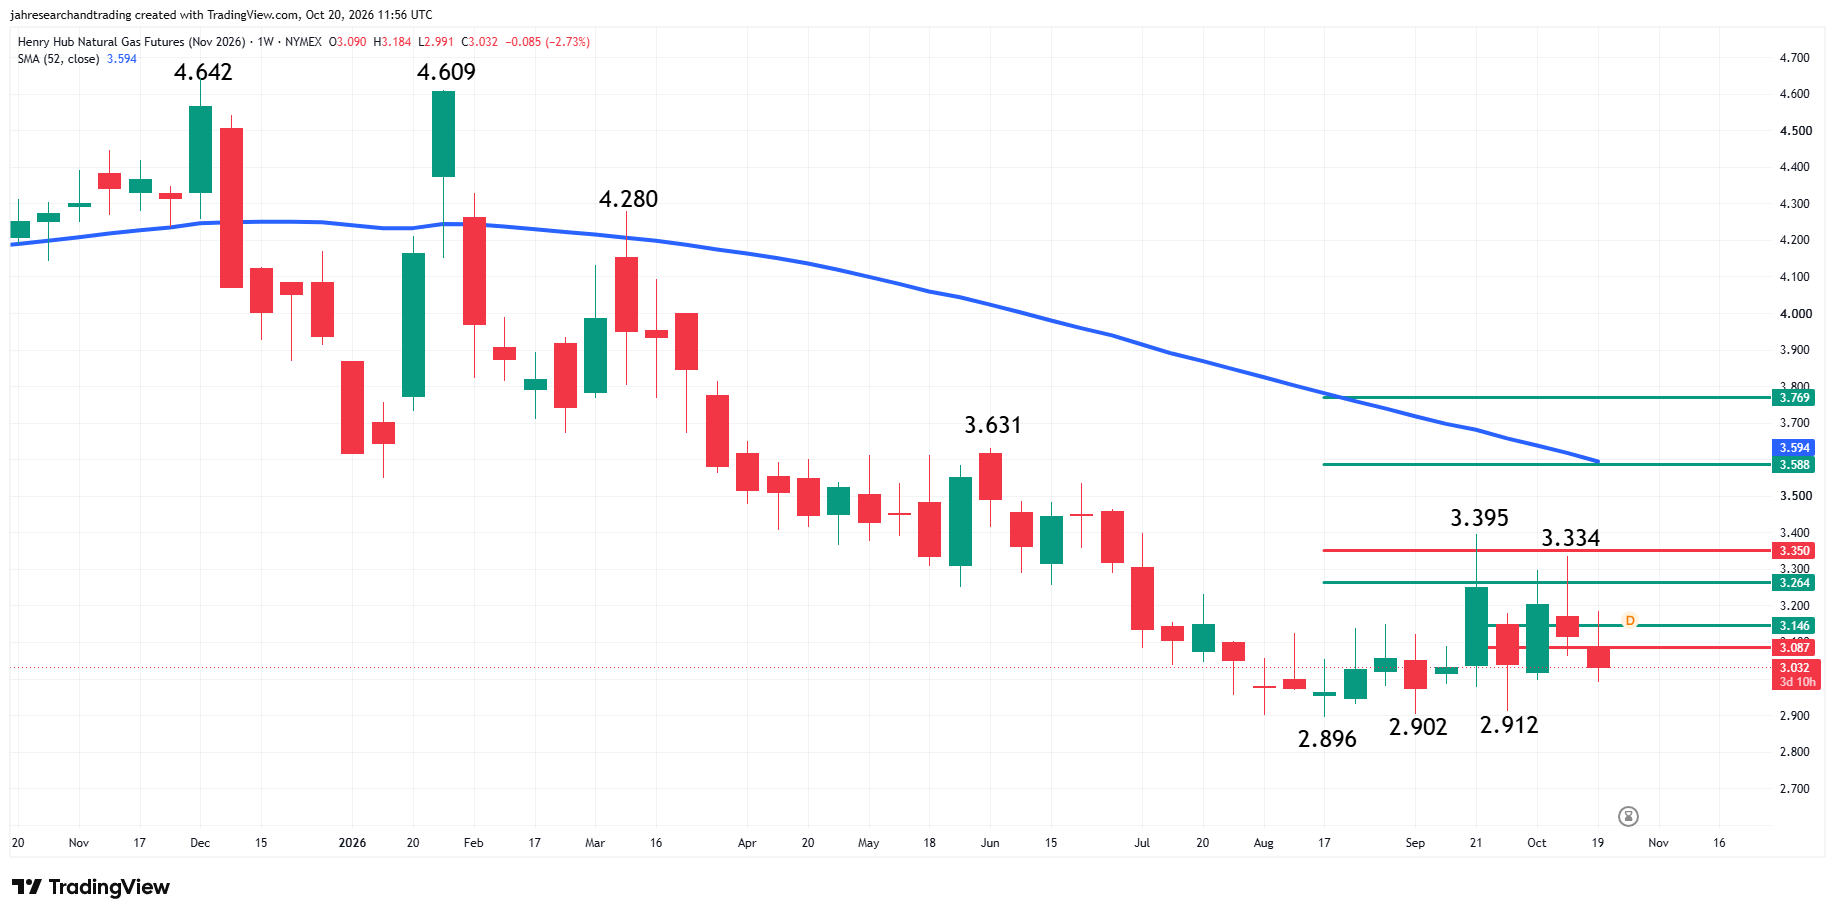
November natural gas futures are trading lower on the weekly chart. The main trend is up according to the weekly swing chart. A trade through $2.912 will change the main trend to down. A move through the main top at $3.395 will signal a resumption of the uptrend.
The minor trend is also up. A trade through $3.334 will signal a resumption of the minor trend. The minor trend will change to down on a trade through $2.912.
The retracement zones at $3.087 to $3.146 and $3.264 to $3.350 are resistance. The 52-week moving average at $3.593 is controlling the trend and the downside momentum, while providing resistance.
Daily November Natural Gas Futures Technical Analysis
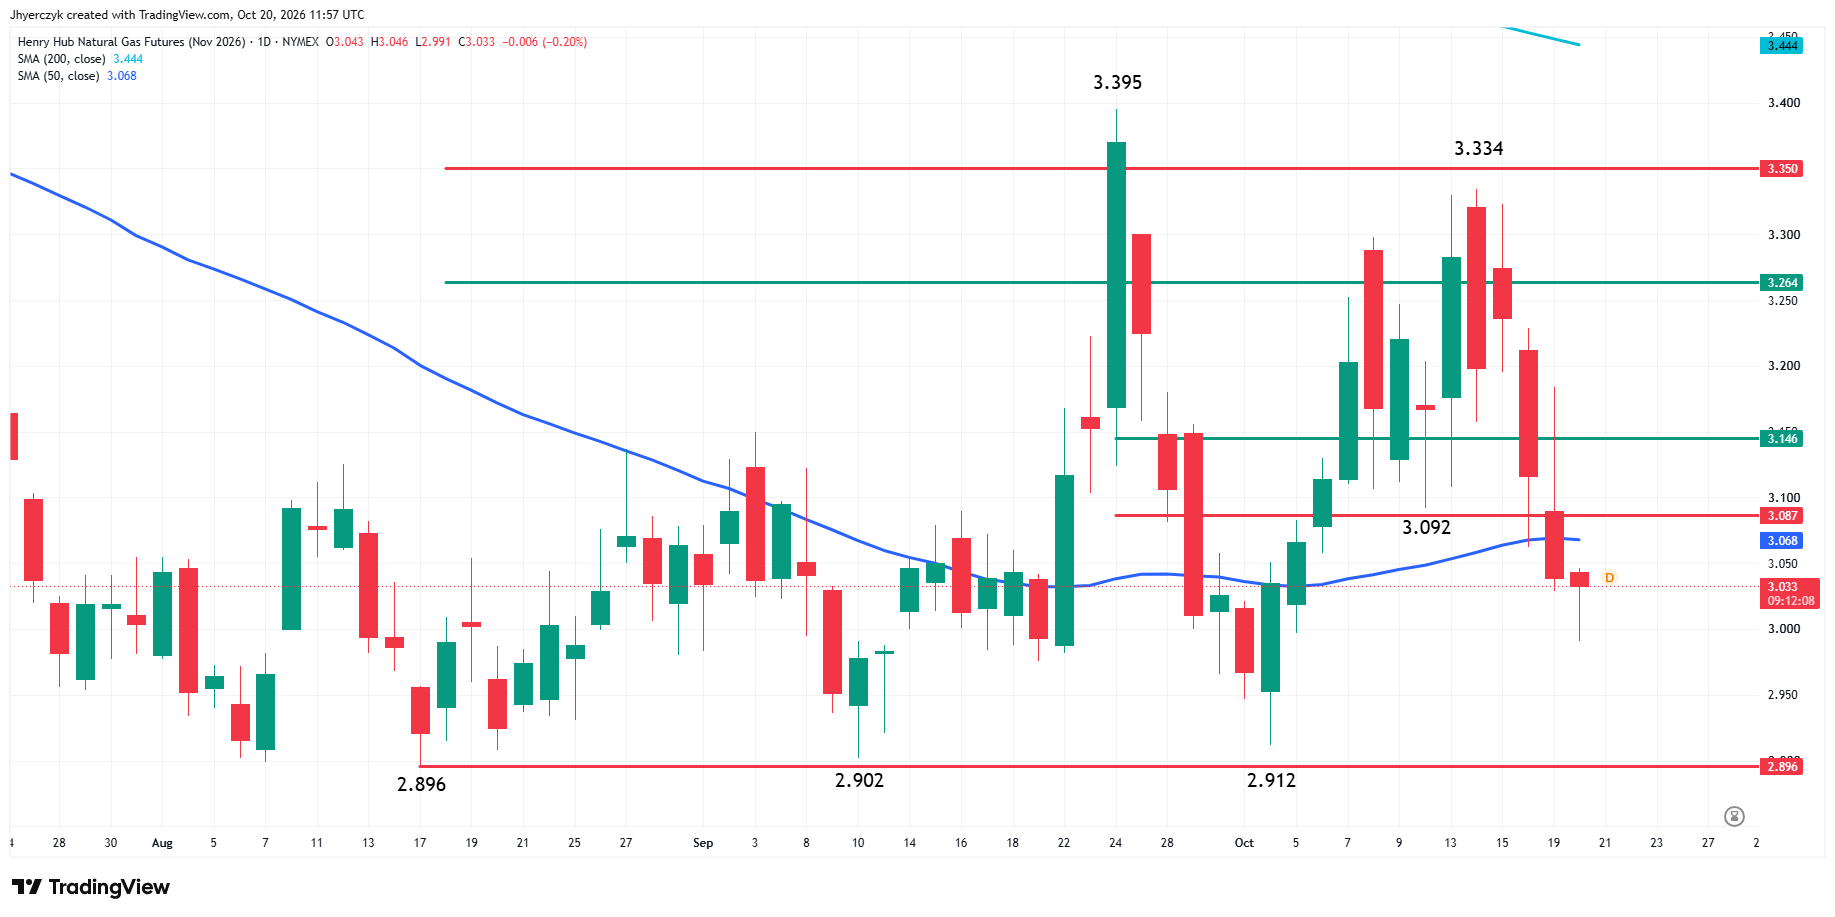
November natural gas futures are lower early Tuesday after closing below the 50-day moving average the previous session. The main trend is down according to the daily swing chart. The trend will change to up on a trade through the swing top at $3.334. The next downside targets are swing bottoms at $2.912, $2.902 and $2.896.
Natural Gas Price Forecast
Every new Natural Gas analysis as it publishes, today's technical signal and key levels, live price — on one page.
See all Natural Gas forecastsThe main range is $2.896 to $3.395. The market is currently trading on the weak side of its retracement zone at $3.087 to $3.146. Trader reaction to this retracement zone is likely to determine the direction of the market into next week’s contract expiration.
The market is also trading on the bearish side of the 50-day moving average at $3.067, making it resistance.
November Is Running Out of Time
The next seven days do not offer much for the long side. Most of the country is looking at highs in the 60s and 80s through October 26. There are cooler areas, but no broad cold pattern that changes the trade.
November is close to expiration. Traders can wait for a December cold shot. They do not have much time to wait for one in the nearby contract.
The $3.00 area is attracting attention because it is round and because it is near the recent bottoms. That does not make it support. Sellers are still taking bids out in front of it.
LNG Could Not Keep the Rally Alive
LNG feedgas demand reached 21.2 Bcf per day Monday. Natural gas rallied early on the number, then gave it all back and settled near the low. Buyers had the best LNG print in two years and walked away from it.
European gas prices hit a 3.75-year high with regional storage at 74% full, well below the five-year average of 89%. The winter contracts are holding. November is not.
The Storage Report Did Not Change the Trade
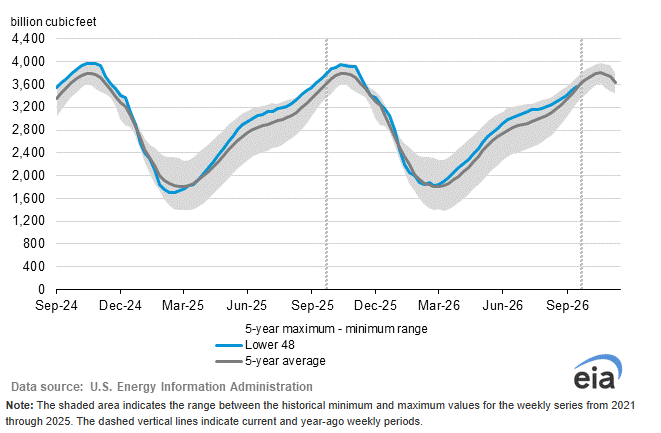
The EIA build came in lighter than expected and lighter than the five-year average. Inventories are still below last year and close to normal. The market bought the number last week and gave it back Tuesday.
The EIA still sees end-October storage at the highest level in 10 years. That is not a shortage number. Sellers are leaning on it.
Production Is Back in the Conversation
Lower-48 dry gas production is running more than 6% above last year. The rig count moved back near its late-September high. The EIA raised its 2027 production forecast again last month. That is not the story a gas bull wants to hear during a warm October.
The Super El Niño talk may become important later in the winter. November does not have that kind of time.
What to Watch
The weather forecast is still controlling the nearby trade. A colder shift could bring buyers back after Tuesday’s break. Another warm run leaves November leaning on the recent bottoms as expiration gets closer.
My weekly outlook is bearish. The market is trading well below the 52-week moving average and professionals have been selling rallies. The downside momentum suggests the market may be headed toward the series of bottoms from $2.912 to $2.896.
My daily bias is also bearish. The bearish swing chart and the trade under the 50-day moving average have me leaning to the downside with a target of $2.912 to $2.896. A trade over $3.146 will weaken my outlook.
More Information in our Economic Calendar.


