



Dollar Steadies as Europe’s Political Risk Builds and UK Jobs Surprise
Dollar finds footing, but Europe moves markets. French debt comes under the spotlight as British unemployment data surprises to the downside.

Dollar Index: October Off the Table, December On
After ending a two-day losing streak on Monday, the dollar index clawed back some losses in Asia, only to trade flat ahead of European opening bells.
Headlines citing “settling” expectations pushed rate bets lower, with odds of an October hike falling to about 17%. The expectation for a December hike continued to climb, currently trading at 94% from 91%. While expectations of an October hike faded, December hike bets continued to pull the floor under the greenback, according to CME FedWatch.
Euro: French Debt Is the Pressure Point
Political turmoil in Europe, and France in particular, is continuing to trouble traders, Reuters reported on Monday. France’s 10-year bond yield approached 5% this month, hitting its highest level since 2002. As of the end of the second quarter, public debt was 119% of France’s GDP. The ECB and euro zone finance ministers have urged France to pass its budget for 2027 in a bid to calm bond markets. Because France is going through an excessive deficit procedure, it is not eligible for the ECB’s tools to stabilize financial markets.
Pound: Jobs Data Back the Hike Case
According to data released this morning by the Office for National Statistics, UK unemployment for the period between June and August was 4.7%. That is the lowest it has been in a year. While payroll employees did increase, by about 13,000 in September, they are still down about 66,000 on the year. There were other weaker indicators. Vacancies dropped to 691,000, the lowest since 2021, during the pandemic, and total pay growth for the same period slowed to 3.7% from 3.9%. With pay still growing faster than inflation, real wages are still rising, which should support the case for a November rate hike. Wednesday’s CPI should show if inflation has kept increasing.
EUR/USD Price Forecast
Every new EUR/USD analysis as it publishes, today's technical signal and key levels, live price — on one page.
See all EUR/USD forecastsUS Dollar Index Technical Analysis: DXY Tests 101.76 Support as Trendline Caps the Rebound
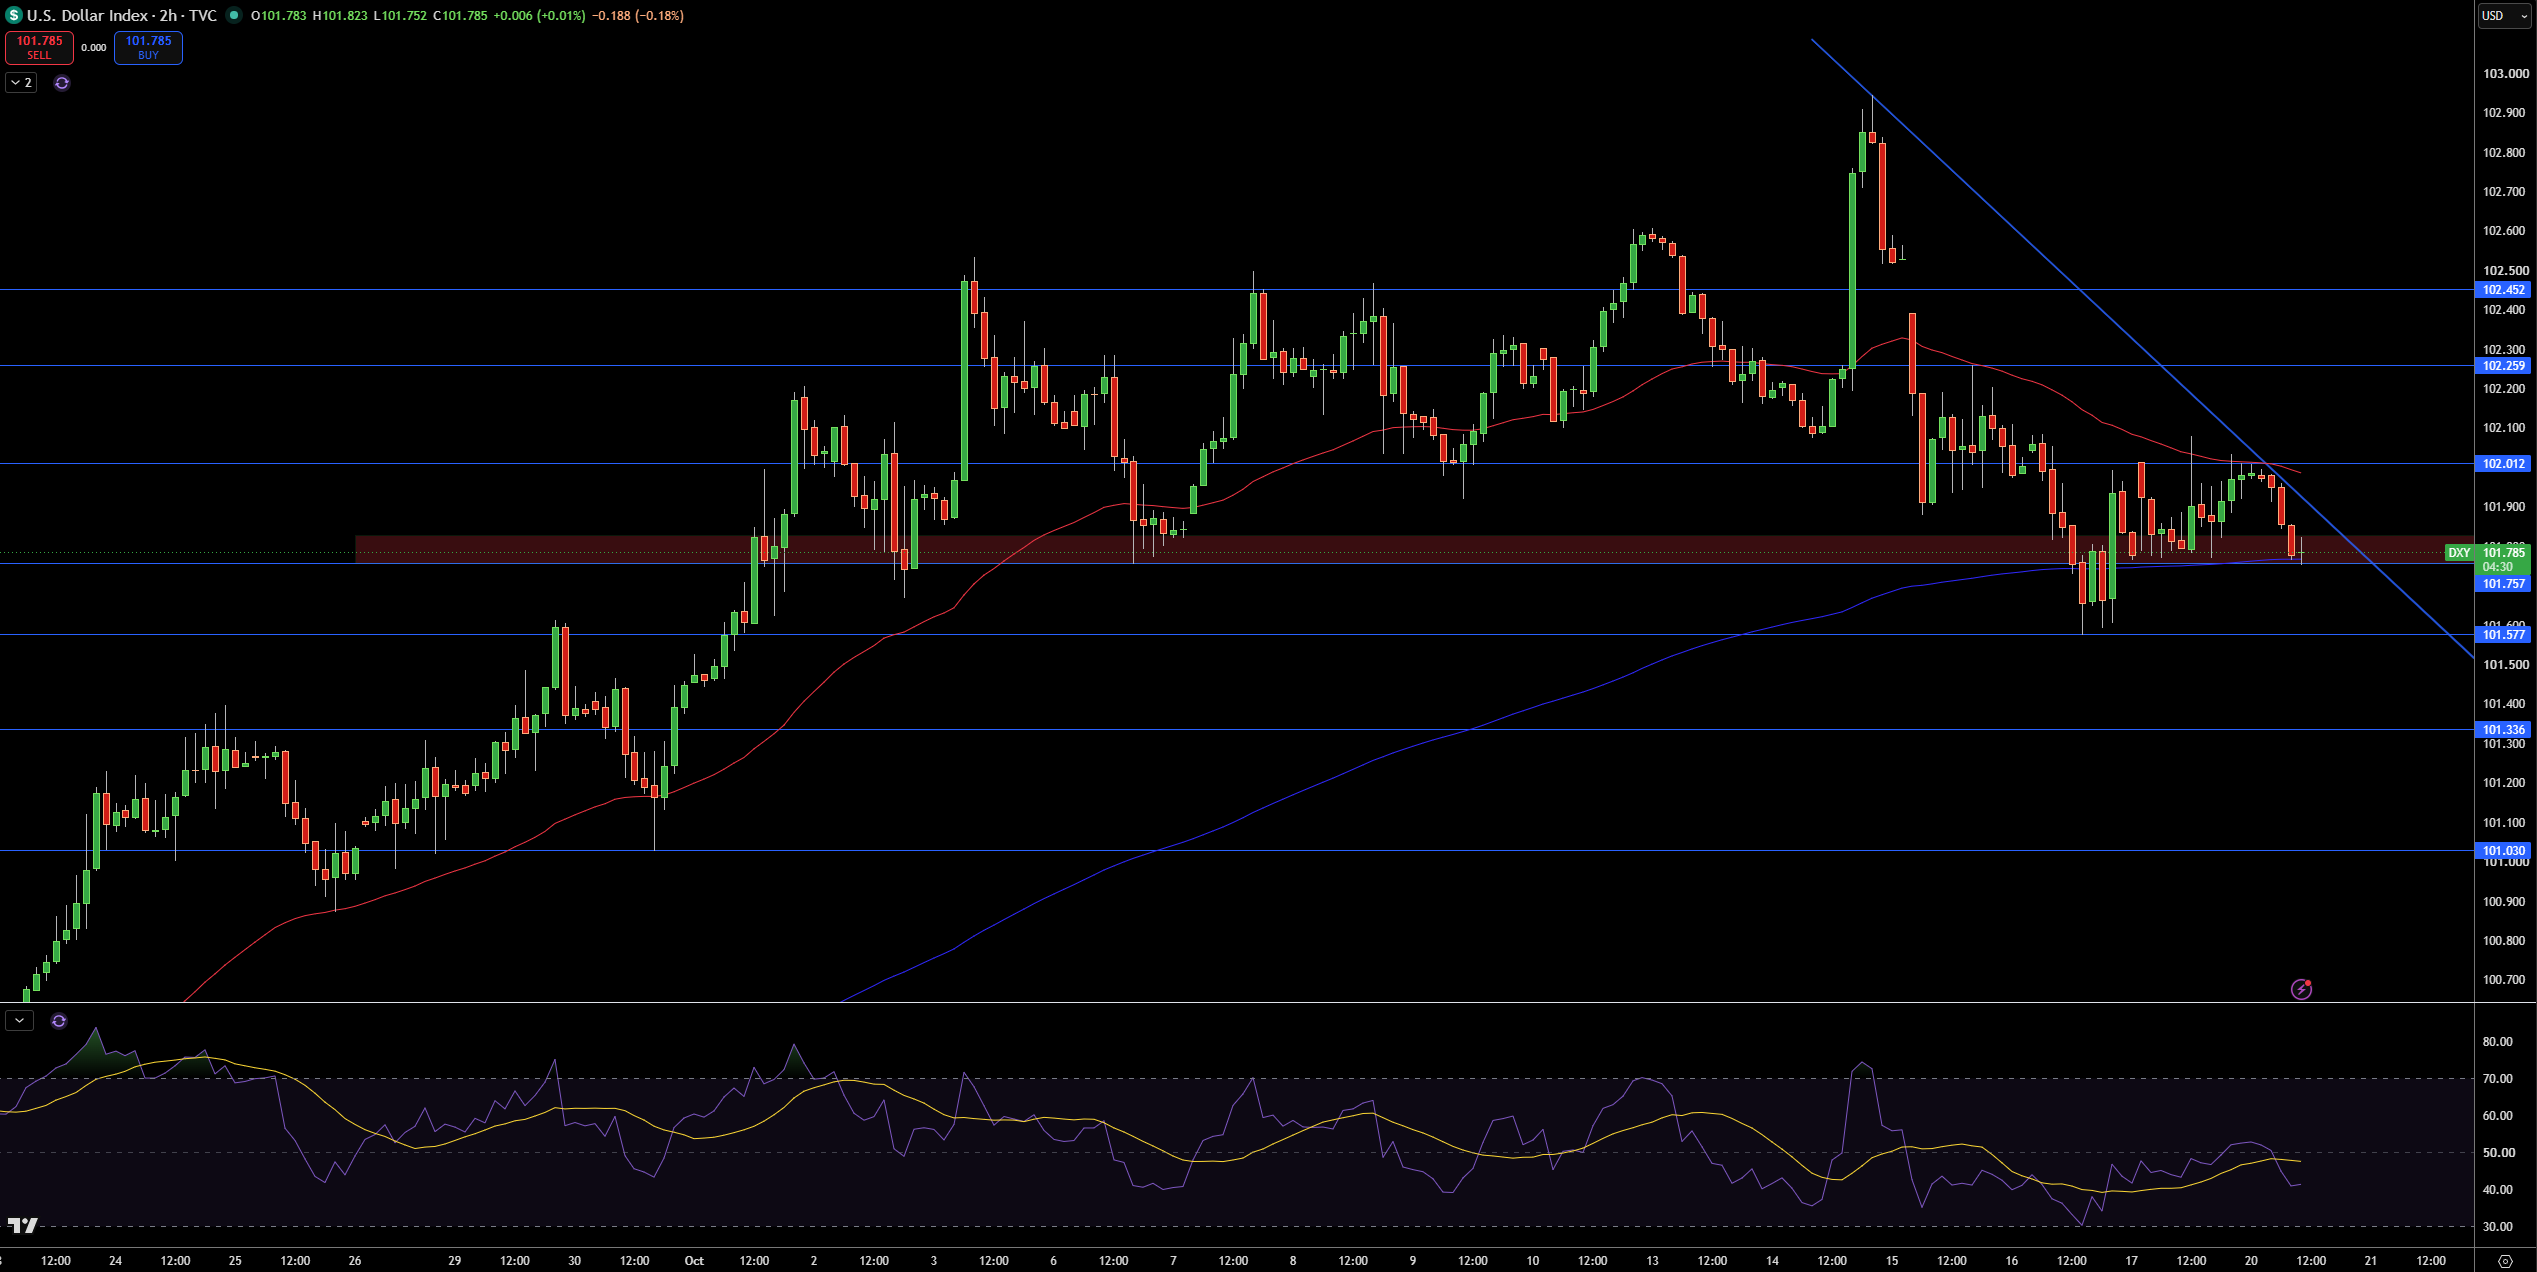
The US Dollar Index is at 101.79. What is interesting to me is how the dollar recently bounced and was rejected from a descending trendline that has capped all the highs since DXY spiked up to 102.94. Because of that, DXY is currently trading at 101.76, a key support level that is also aligned with the 100-SMA. Finally, the 200-SMA is rolling over and resting above DXY, which keeps the bias slightly bearish.
I am watching for support to come in at 101.76. A break of that level would lead to support coming in at 101.58, then 101.34, and 101.03. On the upside, resistance would come in at 102.01, and a break of that level would lead to 102.26 and 102.45.
RSI is at 41 and is below its signal line, which is at 48. Based on that, the momentum is weak, but not oversold. Overall, I am neutral-to-bearish while DXY is trading below the trendline. A close below 101.58 would strengthen the bearish case, and a close above 102.01 would negate the bearish case.
GBP/USD Technical Analysis: Pound Holds 1.3302 as 1.3353 Breakout Test Returns
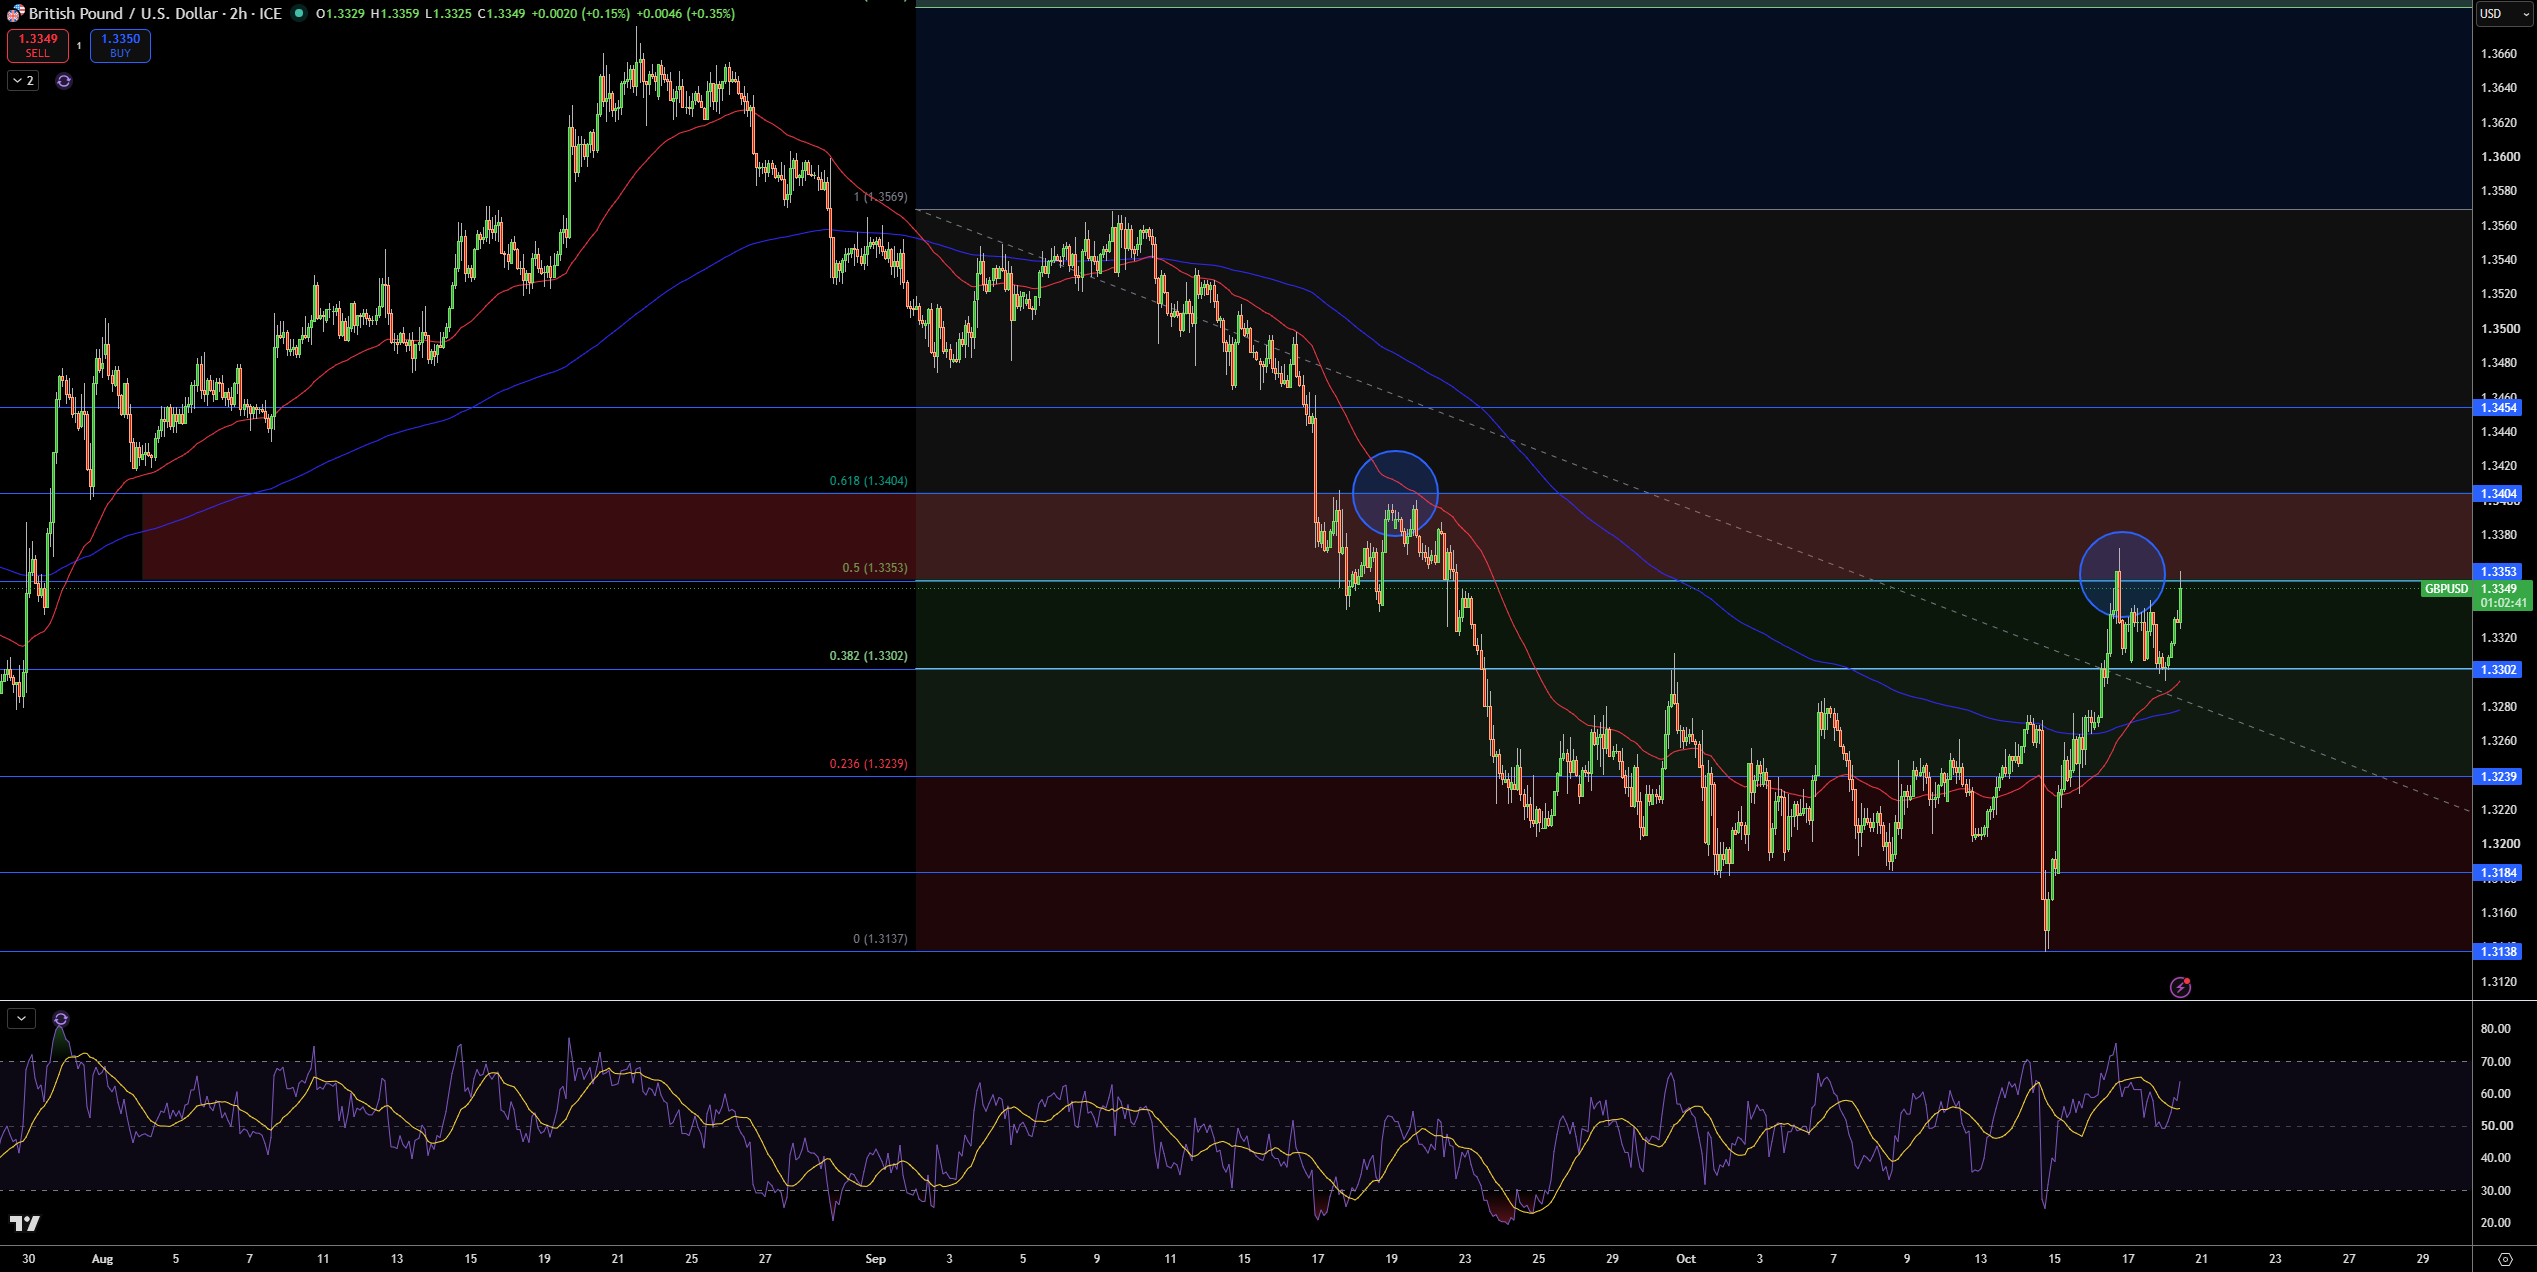
GBP/USD is currently trading at 1.3349. Something that stands out is how firmly buyers defended the 38.2% Fibonacci level at 1.3302. Following that, price was pushed all the way up to the 50% level at 1.3353. The 38.2% Fibonacci level is measured from the high at 1.3569. As it stands, price is trading above both the 100 and 200 hour moving averages. The 50-hour moving average is above the 200 hour, which suggests further upside potential. Price has rejected the 1.3353-1.3404 area twice, most recently last week.
Right now, the level to watch is 1.3353, above which price could test the 1.3404 level. If price breaks and holds below 1.3302, price could retest 1.3239 and potentially 1.3184.
RSI is at 63, which suggests that there is strong bullish momentum, but not overbought. For now, a bullish bias is warranted, but above 1.3353, 1.3404 and 1.3454 come into play. If price breaks and holds below 1.3302, a further move to 1.3239 comes into play.
EUR/USD Technical Analysis: Euro Holds 1.1188 as 1.1270 Trendline Resistance Looms
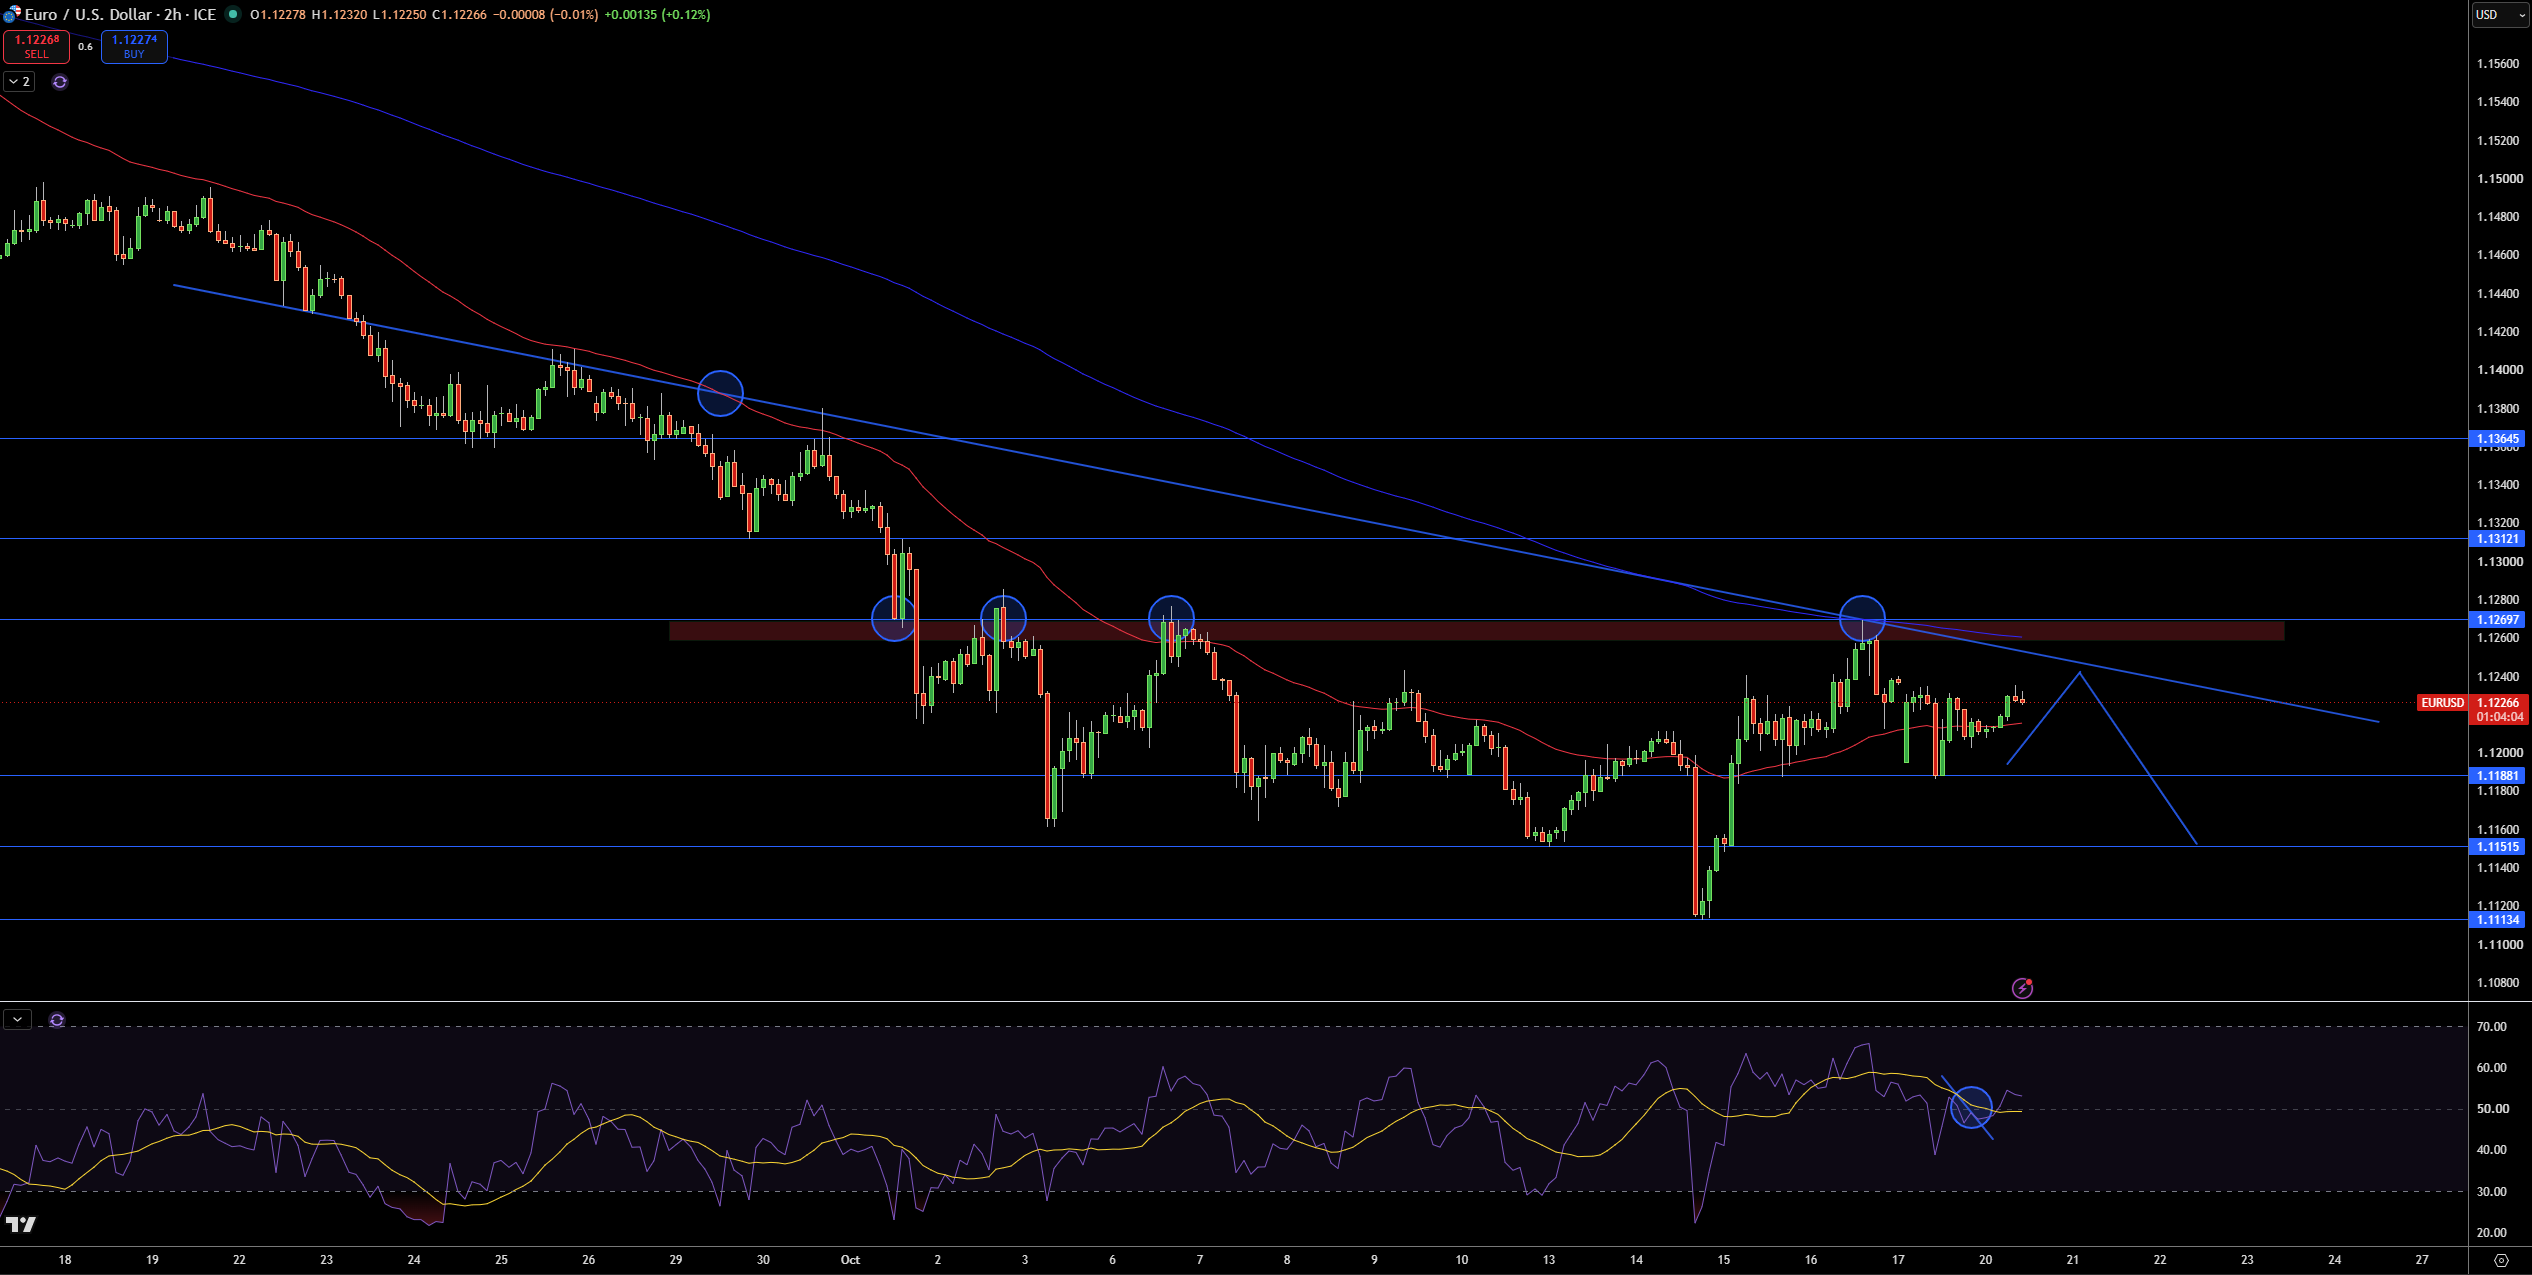
EUR/USD is currently at 1.1227 (as of the time of writing the 2 hour chart). Price has found the 1.1260-1.1270 zone to be resistance 4 times since early October. It now aligns with the descending trendline and slower moving average. Price has been trading above the faster moving average after last week’s dip. I expect a bounce to the trendline at 1.1240 before selling pressure returns.
The first resistance level I’m watching is at 1.1240. The next level is 1.1270. Breaking above that level opens up 1.1312 and then 1.1365. If 1.1240 is broken to the upside I expect a large move to 1.1270. If support at 1.1188 is broken, the next level of support is 1.1152 and then 1.1113.
RSI is just above 53 and is above its signal line which is at 50. This indicates that the Euro has slight bullish momentum. However, I am neutral to slightly bearish with the Euro as long as it is under 1.1270. If price breaks and closes below 1.1188, then 1.1152 becomes very likely. A closure above 1.1270 invalidates this entire analysis.


