



Oil Holds Its Risk Premium as Houthi Strikes Offset Russia Relief
Crude markets start the week with uncertainty after the US softened its stance on buying Russian oil, while the attack on Saudi’s energy facilities last weekend drew wider concern.

Brent: Saudi Supply in the Crosshairs
Yemen’s Houthi rebels claimed responsibility for multiple attacks over the weekend, including attacks on Saudi energy and airport infrastructure and the Shaybah oilfield. According to ING, the market remains at risk premium due to the heightened war risk.
Russian supplies are also coming under increased pressure. A series of drone attacks by Ukraine over the weekend set fire to an oil terminal and a nearby depot in St. Petersburg. The terminal, according to Kpler, exports approximately 120,000 bpd of refined petroleum products.
However, the other way on the scale is President Trump’s executive order from Friday, which removed sanctions and tariffs relating to Russia, including penalties on countries buying Russian energy.
WTI: Inventories Back in Focus
Inventories are likely back in focus for WTI after a week of solid gains last week. The Cushing stock build last week was smaller than expected and markets will now look toward EIA inventory data for further insight.
Natural Gas Price Forecast
Every new Natural Gas analysis as it publishes, today's technical signal and key levels, live price — on one page.
See all Natural Gas forecastsA Reuters poll showed crude and products stockpiles are expected to have dropped last week. Data shows US stockpiles have been declining over the last couple of weeks, which keeps the focus on domestic supply ahead of the EIA’s report this week. The Nov WTI contract expires on Tuesday.
Natural Gas: Mild Weather Versus Record LNG Pull
On Monday, expectations for milder weather cut forecasts for heating demand, which countered bullish factors like small storage builds, lower production and LNG demand. On average, LNG feedgas has been at 18.1 bcfd. Lower 48 production averaged 111.3 bcfd.
Two opposing factors influenced the gas and LNG market this week. LNG feedgas hit a new high at 20.7 bcfd. Meanwhile, Columbia Gas restored 1.9mn Dth/d of capacity, bringing supply back to Appalachia. While that has increased supply in the US, the attack on ships in the Middle East has limited global LNG supply, making it more difficult for Europe to restock for the winter.
Natural Gas Technical Analysis: NG Slips Below $3.03 as $2.97 Support Comes Into Focus
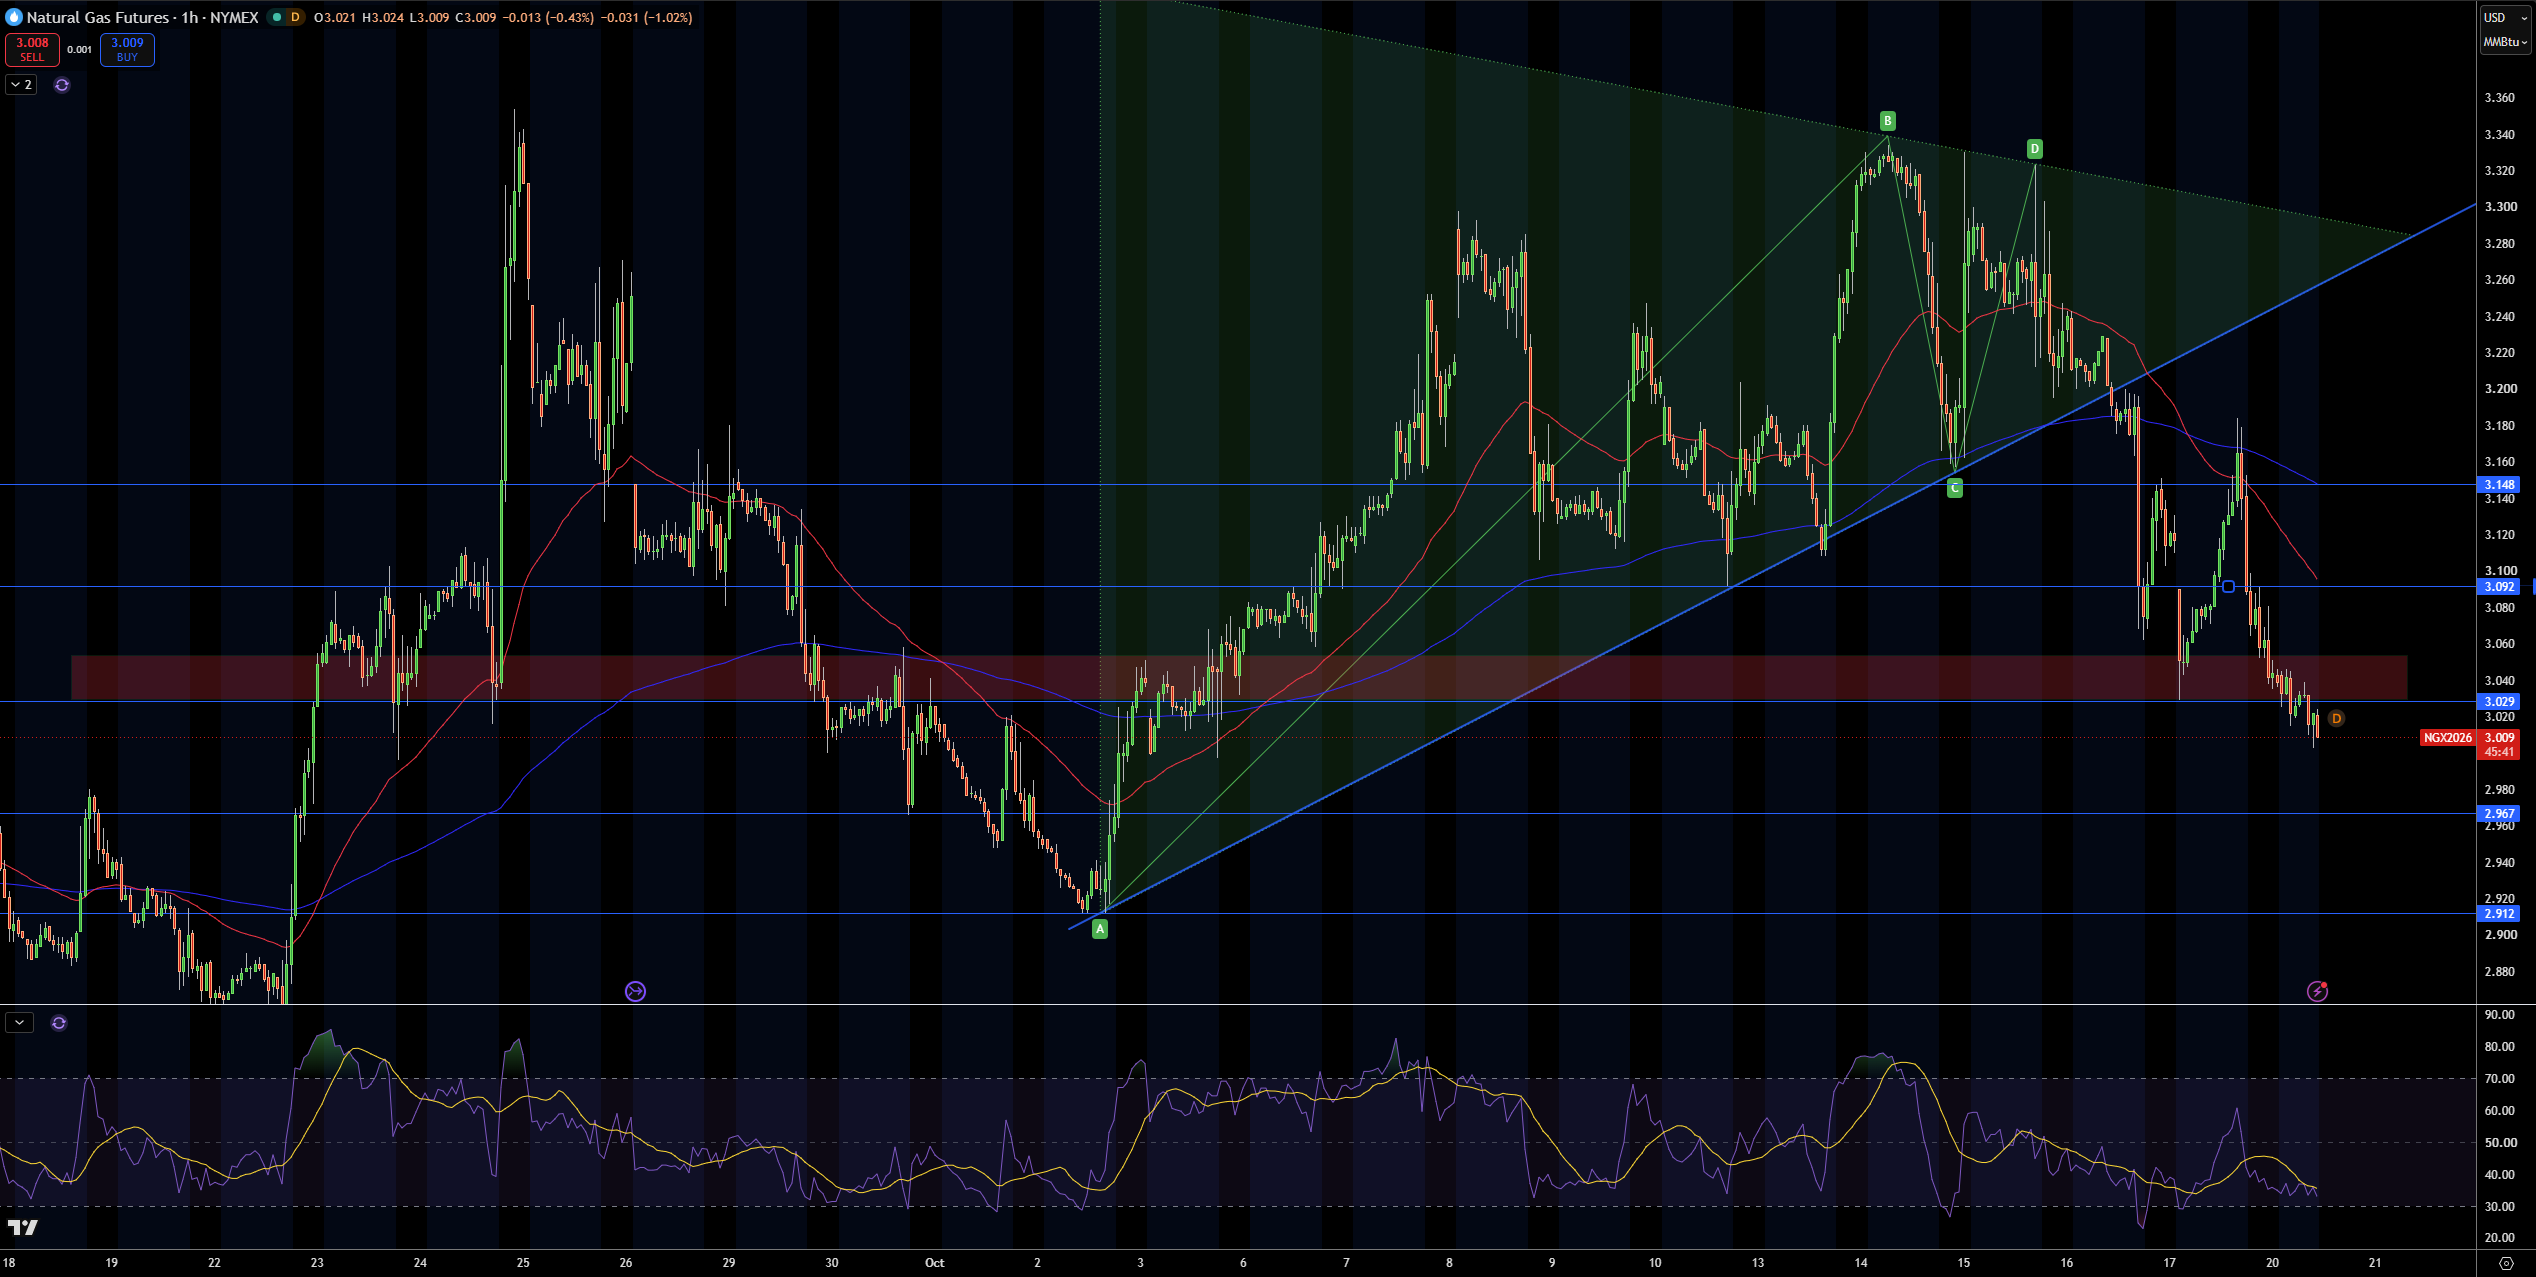
Natural gas is currently trading at around $3.01/MMBtu, and what’s notable is the sustained selling following last week’s triangle breakdown. The most recent bounce ended at $3.09 and price has fallen below the previous support of $3.03 and $3.05. The moving averages are both falling, and the faster moving average is still below the slower moving average, which keeps the short-term trend bearish.
The first major support I’m looking at is at $2.97. If that support is breached, then $2.91 would be the next support and that would also be a breakdown of the previous uptrend that started from the early October lows. If that happens, then $2.87 would be the next support.
Resistance is at $3.03, $3.09 and $3.15. The RSI is at 34, and still bearish. A recovery above $3.03 would also negate the bearish case, and so would a move above $3.09. I would also add that if $3.09 is broken, then a more serious move to the upside could take place. From there a return to $3.15 would still be in the realm of possibility.
WTI Technical Analysis: USOIL Holds $98.09 as $99.72 Remains the Key Breakout Test
WTI crude is at $98.67 on the 1 hour chart. On the upward channel from mid-October, the price has tested lower levels and been defended by the lower level of the channel. Twice the price has tried to break out at $99.72 and has formed a double top with the last high from October 10th. For now, the price is above both moving averages.
$99.72 is the first major resistance. If this breaks, $100.86, and the channel upper level, would be the next target. $98.09 and the lower channel line would provide support, followed by $97.65. Even lower $96.73 and $95.34 would provide support.
RSI is at 55 and falling, signaling that a drop may occur, but the lower level of the channel continues to be defended, so a drop may be short-lived.
If $98.09 and the channel lower level is defended, I would view the outlook as slightly bullish. A break of $99.72 would provide a better outlook. A close below $96.73 would flatten the channel.
Brent Technical Analysis: UKOIL Holds $109.97 as $111.07 Comes Into Focus
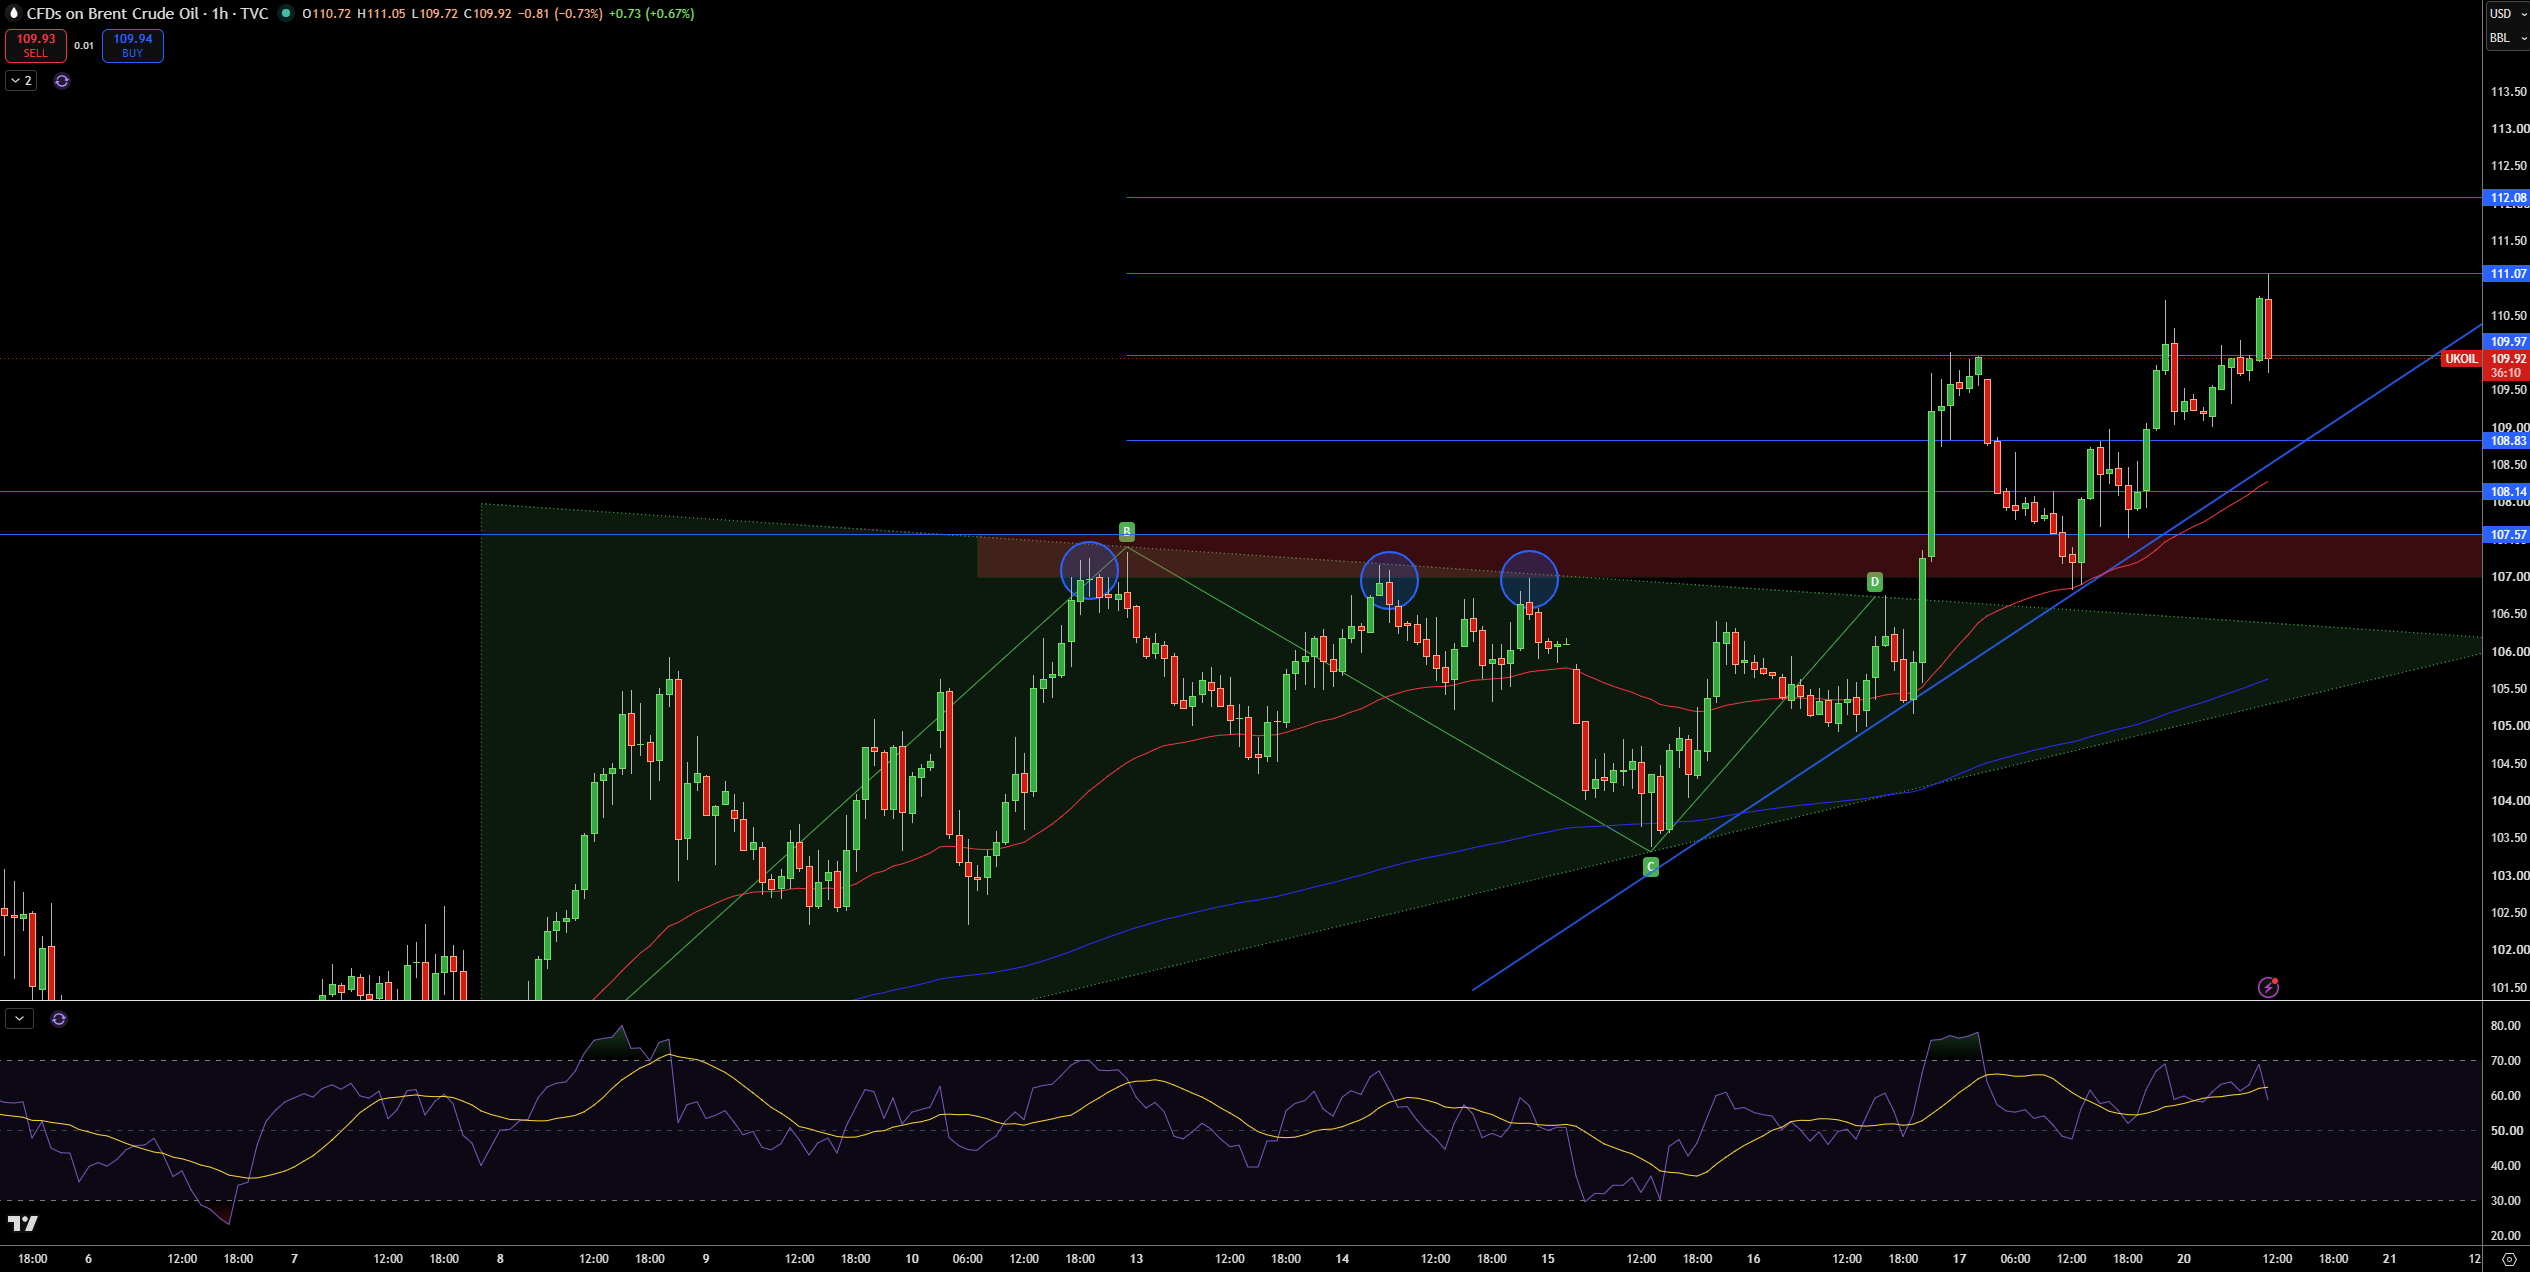
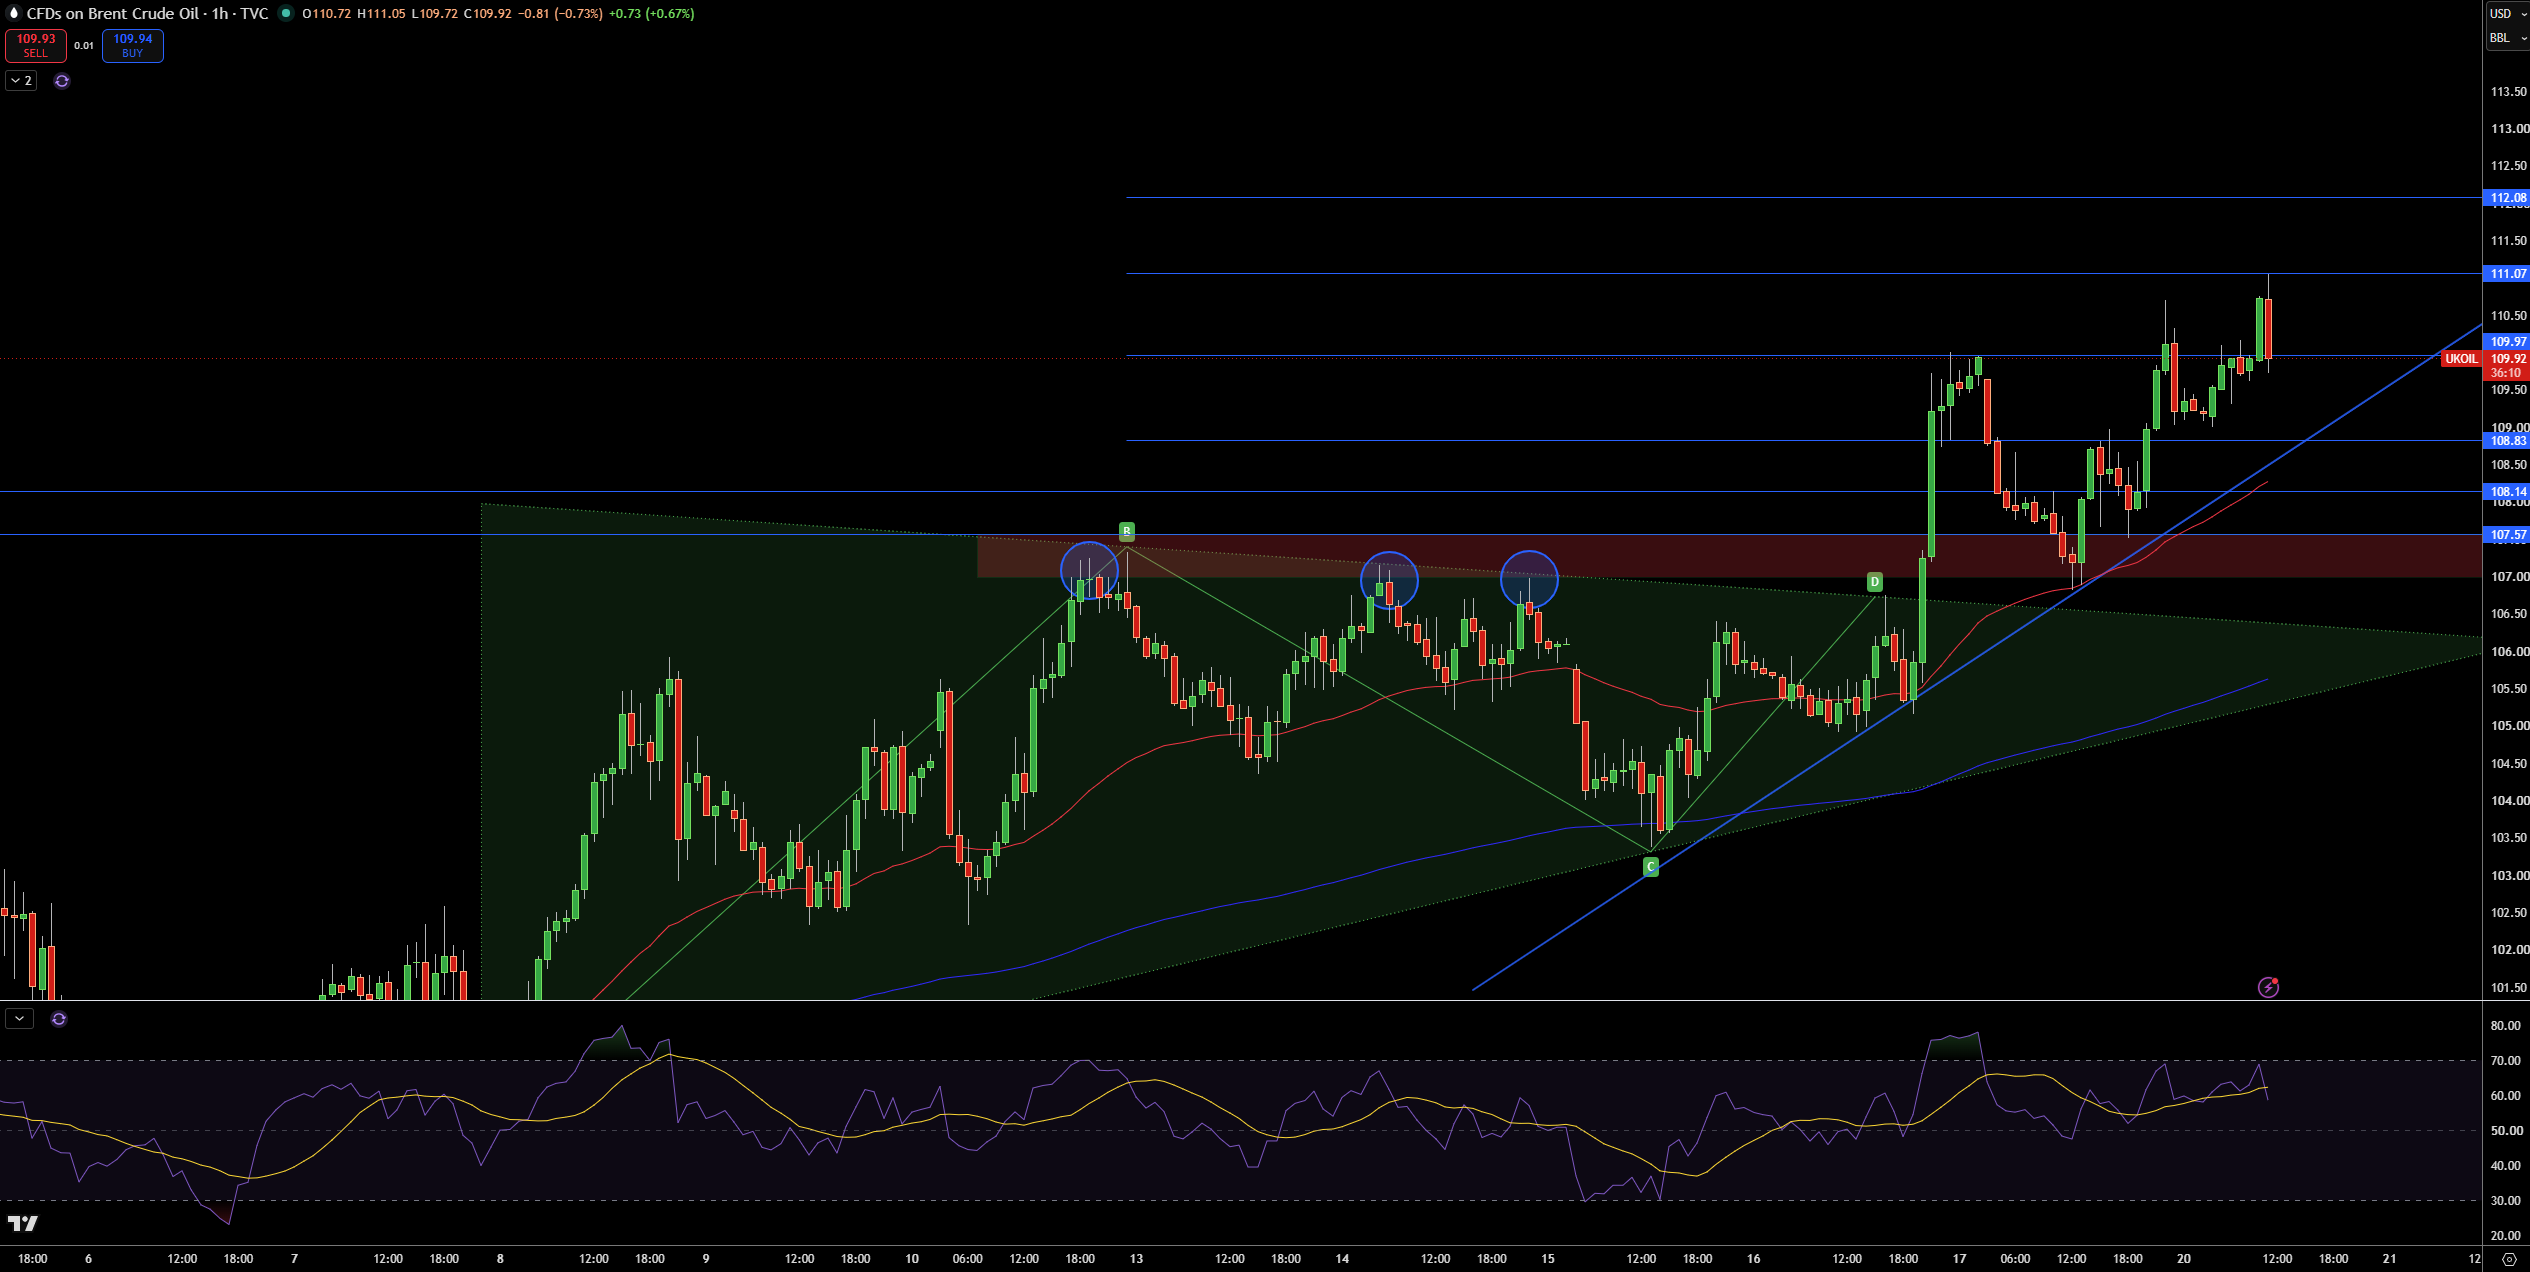
Brent is trading at $109.92 as of the 1-hour chart. What I find important is how strongly the breakout from the contracting triangle held. The previous resistance at $107.00 to $107.57, which rejected price 3 times, has since turned to support. A rising trendline is also supporting the lows, while both moving averages are still far from price and are pointing up.
The first resistance I am looking at is $111.07, where the last leg of the move higher stopped. Breaking through that would bring $112.08 into play. Supporting the move lower would be the $109.97 pivot level, then the rising trendline and $108.83. Further down, the $108.14 level and the previous breakout of $107.57 would come into play.
RSI is at 59, and is headed lower, and has slipped just below the signal line at 62. That suggests bullish momentum and a mild uptrend is still in place. However, that may change if price breaks below $108.83.
I am leaning slightly bullish, and would expect $108.83 to act as support. I would also expect $111.07 to be a stiff resistance, and possibly a breakout level to the upside. A close below $107.57 would bring the contracting triangle into question.


