
Oil Has Given Gold Sellers Another Reason to Lean
Gold is lower early Tuesday. The market had a chance to build on the October low after the dollar eased and Treasury yields backed off their highs last week. It did not get far. Oil is back near a five-month high and the December Fed hike trade is still sitting in front of the metal.
At 07:34 GMT, Spot Gold (XAUUSD) is trading at $4,126.55, down $14.26 or -0.34%.
The early move says buyers are still not ready to take offers. They are defending the break, not chasing a breakout.

The Oil Premium Has Moved Back into the Rate Trade
Brent is holding near a five-month high after the Houthis said they carried out attacks against Saudi energy, airport and military targets. Traders are putting the Gulf premium back into crude. That is enough to keep oil from giving rate traders any relief.
Last week’s inflation reports were already a problem for gold. September consumer prices rose 3.7% from a year earlier. Producer prices rose 6.3%, the largest annual increase since 2022.
Gold traders had been looking for oil to stay off the highs. The opposite is happening early Tuesday. Crude is firm again, and gold is the market backing away.
October Has Faded, but December Has Not
Gold Price Forecast
Every new Gold analysis as it publishes, today's technical signal and key levels, live price — on one page.
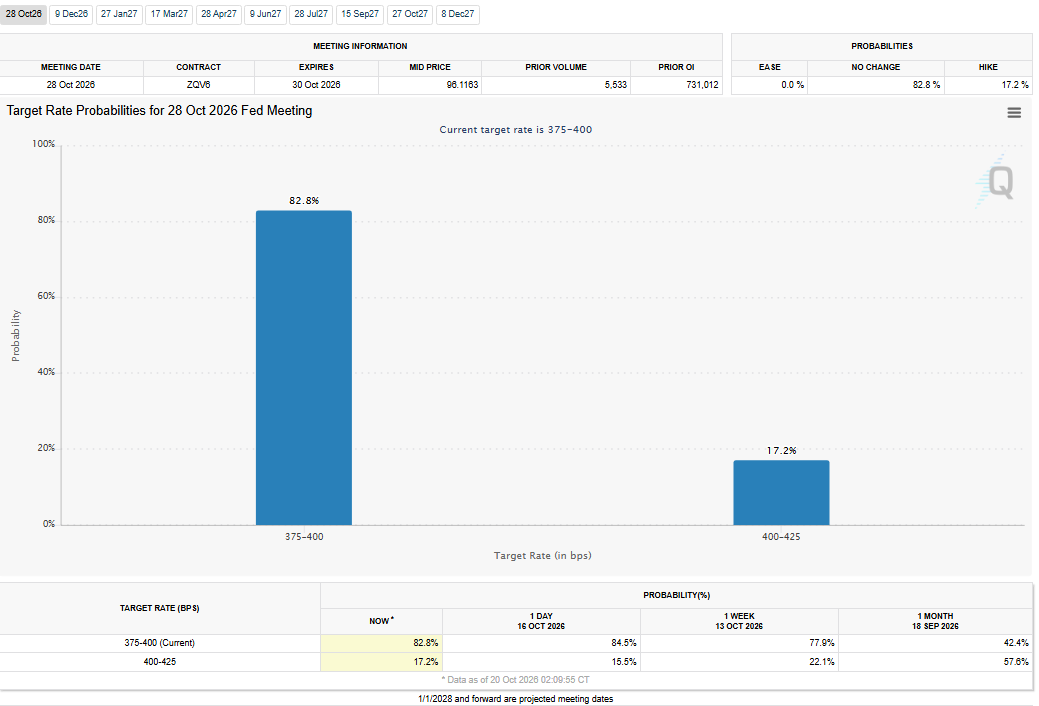
See all Gold forecastsFederal Reserve officials have not shown much urgency to move again at the October 27-28 meeting. CME FedWatch puts the probability of no change at 82.8%, with a 17.2% chance of a quarter-point hike.
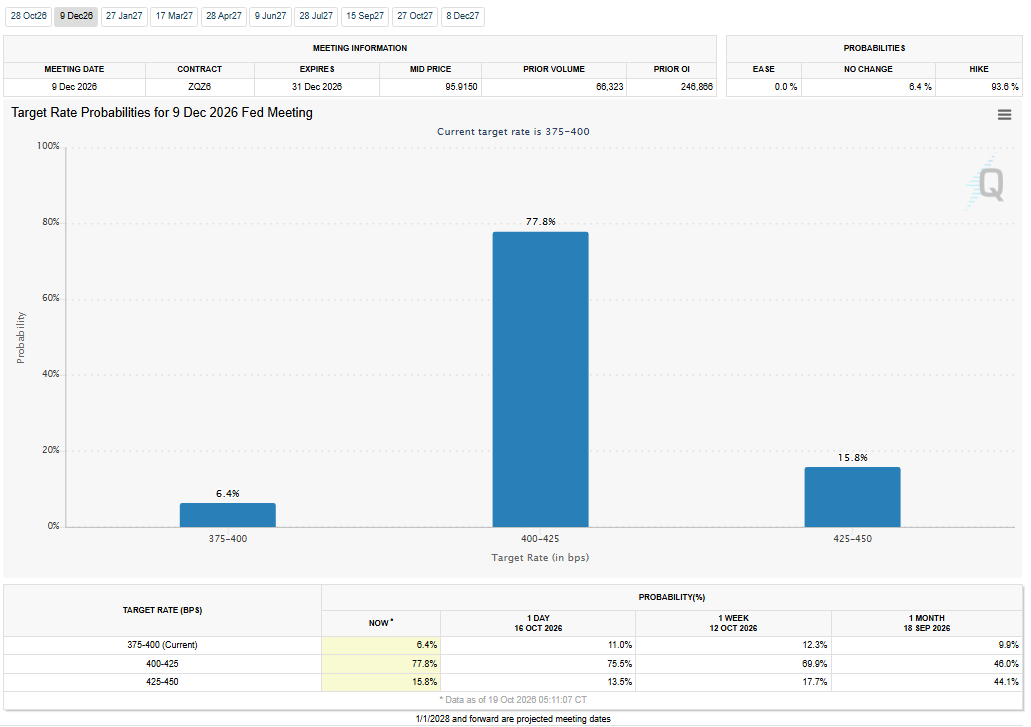
December is where the problem sits. FedWatch shows a 93.6% probability that rates are higher by the December 9 meeting. Traders put a 77.8% probability on a move to a 4.00% to 4.25% target range and a 15.8% probability on a move to 4.25% to 4.50%.
The October pause is not bringing in gold buyers. The rate hike is being pushed out, not taken away.
Treasury Buyers Have Not Given Gold Much Room
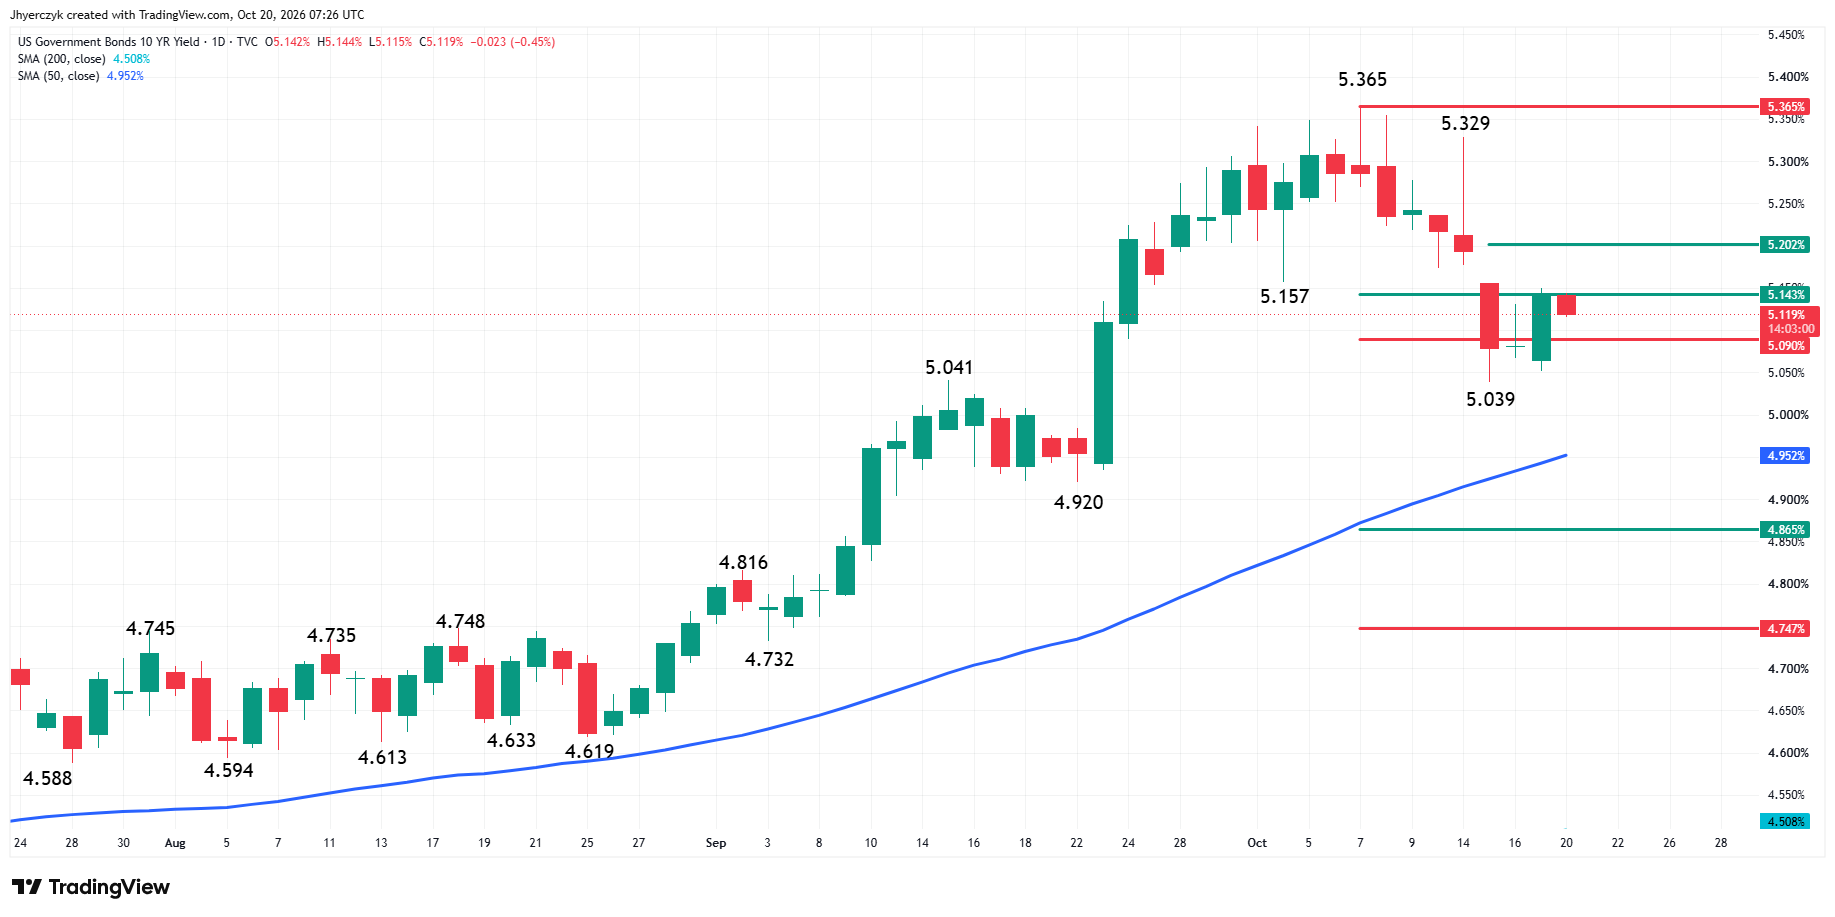
Treasury yields moved higher Monday as traders went back over last week’s inflation reports. The 10-year yield had already pulled back from its recent high, but it did not turn into a clean break lower. Gold needed that follow-through. It did not get it.
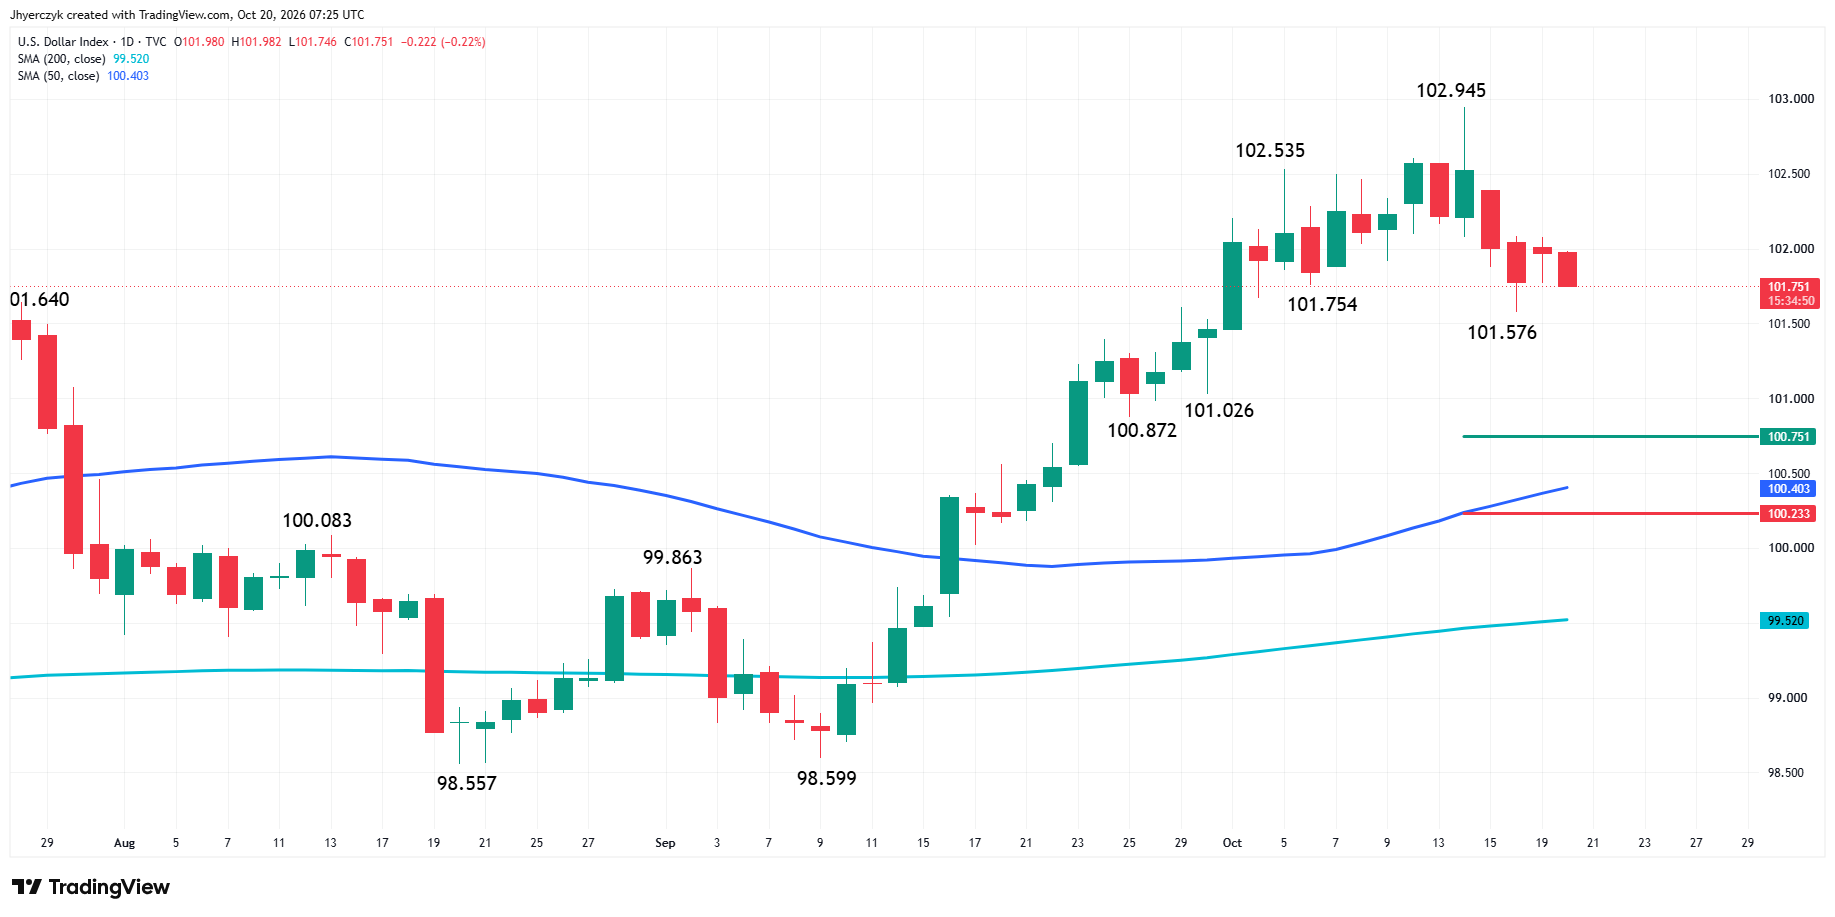
The Dollar Index rose 0.19% Monday to 101.973 after two down days. It was slightly lower overnight, but the index is still holding above its 101.576 main bottom. Dollar sellers have not been able to break that level.
Weekly Spot Gold (XAUUSD) Technical Analysis
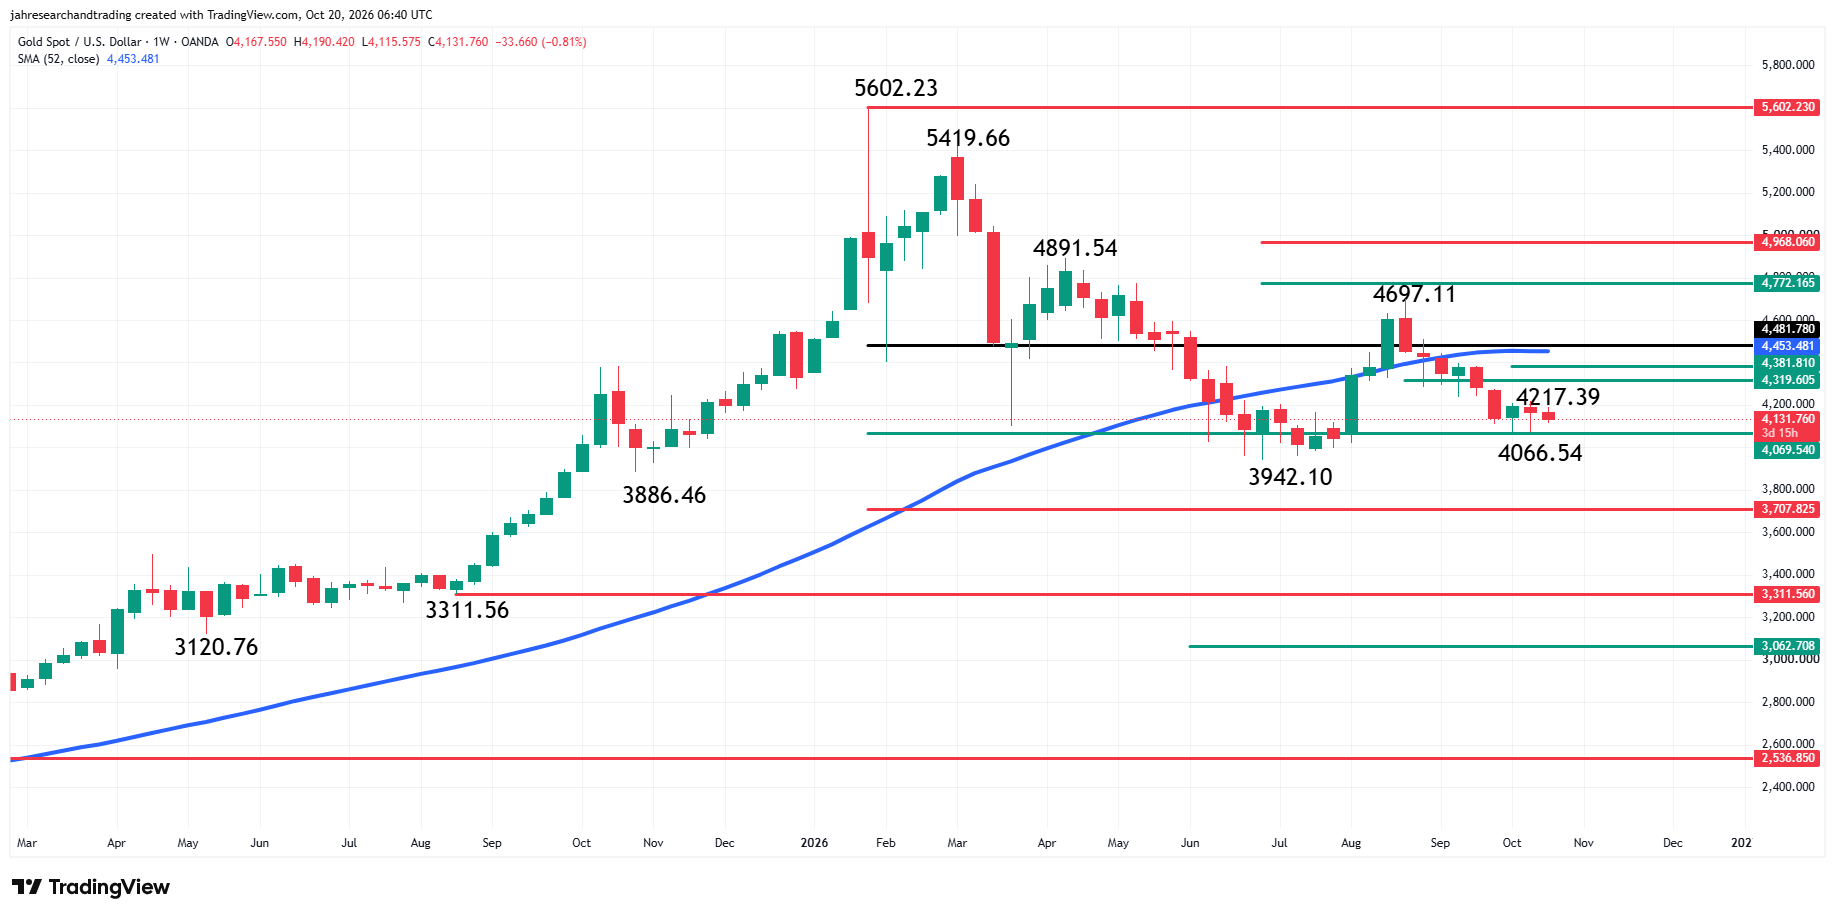
Spot Gold is edging lower for the week early Tuesday, but is still holding above a major retracement zone and attempting to form a secondary higher bottom. The market is also below $4,481.78, which is 20% down from the all-time high at $5,602.23. To some, this represents a bear market.
The main trend is down according to the weekly swing chart. A trade through $4,697.11 will change the main trend to up. A move through $3,942.10 will reaffirm the downtrend.
The minor trend is also down. A trade through $4,217.39 will change the minor trend to up and could shift momentum to the upside.
The major retracement support zone is $4,069.54 to $3,707.82. Minor 50% levels at $4,319.60 and $4,381.81 are currently capping gains. They sit just below the 52-week moving average at $4,453.78, which is providing both resistance and bearish trend guidance.
For Weekly Spot Gold, my trend-trading bias is to the downside because the main and minor trends are down and the market remains on the bearish side of the 52-week moving average. A trade through $4,217.39 will turn the minor trend up and weaken my bearish outlook.
Daily Spot Gold (XAUUSD) Technical Analysis
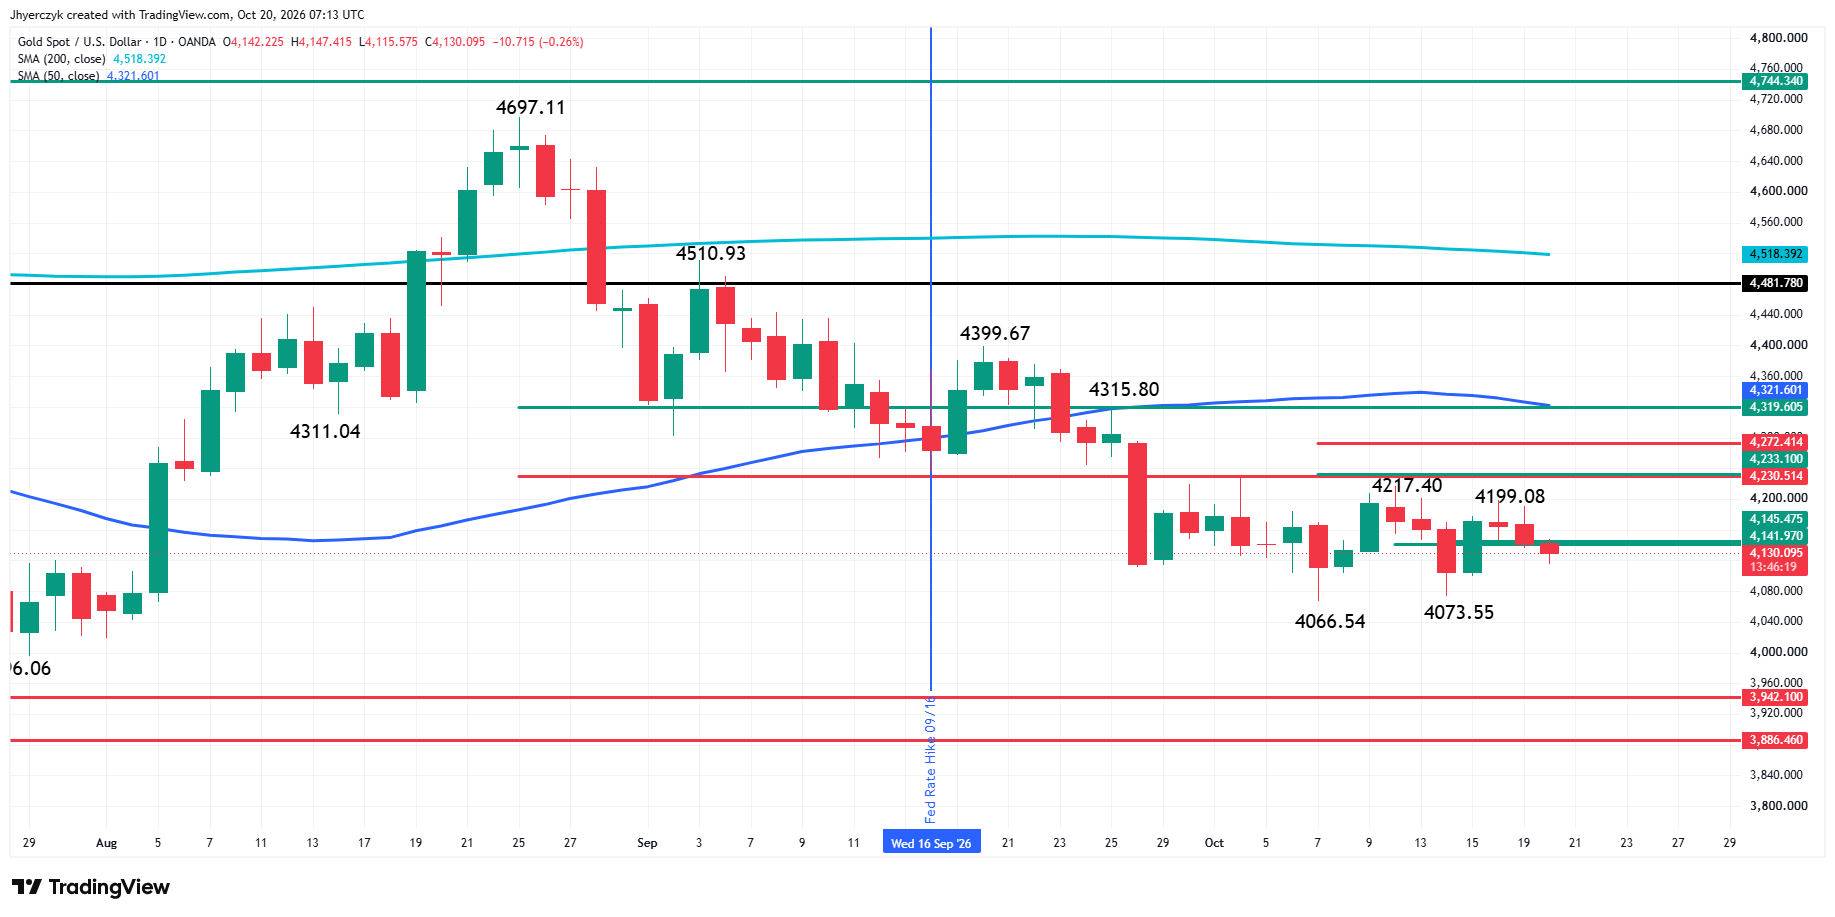
Spot Gold is trading slightly lower early Tuesday. The main trend is down according to the daily swing chart. A trade through $4,199.08 will change the main trend to up. A move through $4,073.55 will reaffirm the downtrend.
Additional resistance is a main top at $4,217.40. Additional support is a main bottom at $4,066.54.
Traders are also reacting to a pair of 50% levels at $4,141.97 and $4,145.47. Currently, the market is trading on the weak side of these pivots.
While a breakout over $4,199.08 is possible, traders are more likely to face a labored rally with short-term retracement zone resistance at $4,230.51 to $4,319.60. Above this area is the 50-day moving average at $4,321.71.
On the downside, a failure to hold $4,066.54 could open things up with potential targets at $3,942.10 and $3,886.46.
For Daily Spot Gold, my bias is to the downside because the main trend is down on the swing chart and the market is trading on the weak side of the 50-day moving average. A trade through $4,073.55 will strengthen my conviction. A move through $4,199.08 will change the trend and shift my bias to the upside.
Shorter-term traders could use the two pivots at $4,145.47 and $4,141.97 for direction. A bullish tone could develop over $4,145.47 and the bearish tone could strengthen under $4,141.97.
What to Watch
Crude, the dollar and Treasury yields are the live inputs for gold Tuesday. If the oil premium holds and the dollar continues to find support, sellers have room to lean on the market. A break in either trade would take some pressure off the long side.
For Weekly Spot Gold, my bias remains to the downside. The secondary higher bottom has brought in buying, but I still see it as support under a bearish weekly trend. I need to see buyers take offers and shift the minor trend before treating the low as a turn.
For Daily Spot Gold, my bias is also to the downside. The market is trading below its 50-day moving average and on the weak side of the daily pivots. Rallies remain vulnerable until buyers change the daily trend.
If you’d like to know more about how to trade gold, please visit our educational area.