
Natural Gas Tests New Lows Amid Warmer Weather Forecasts
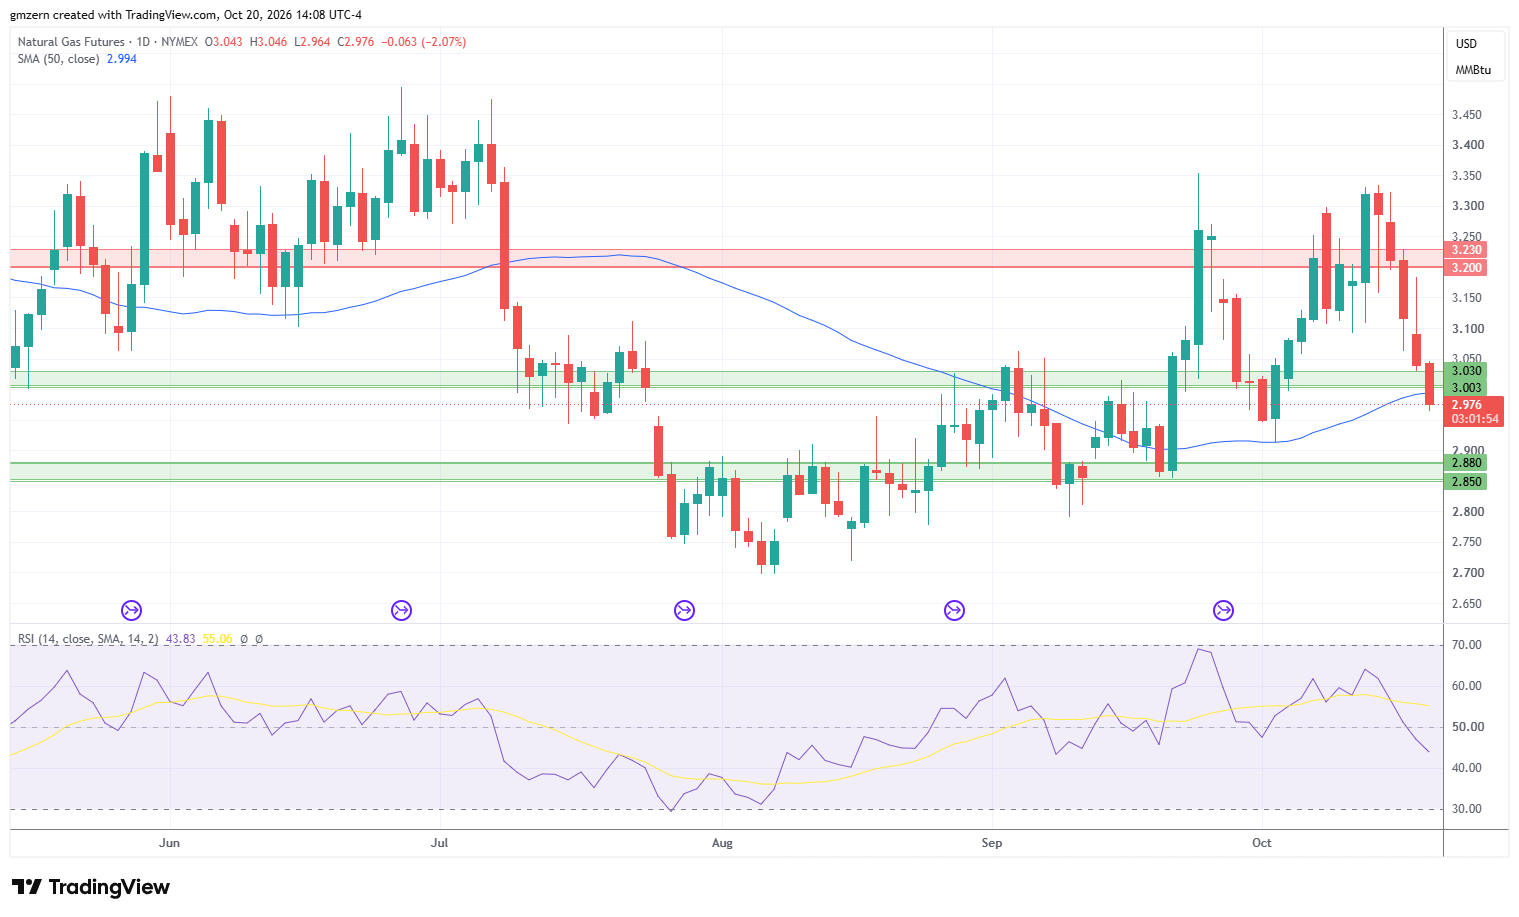
Natural gas is losing ground as traders focus on warmer weather forecasts, which indicate that demand will not increase.
Natural gas declined below the support at $3.00 – $3.03 and is trying to settle below the 50 MA at $2.99. In case this attempt is successful, natural gas will head towards the next support level, which is located in the $2.85 – $2.88 range. RSI is in the moderate territory, so there is plenty of room to gain momentum in the near term.
On the upside, a move above the $3.03 level will push natural gas towards the $3.10 level. In case natural gas settles above $3.10, it will head towards the resistance at $3.20 – $3.23.

WTI Oil Moves Lower As Traders Switch To December Contract
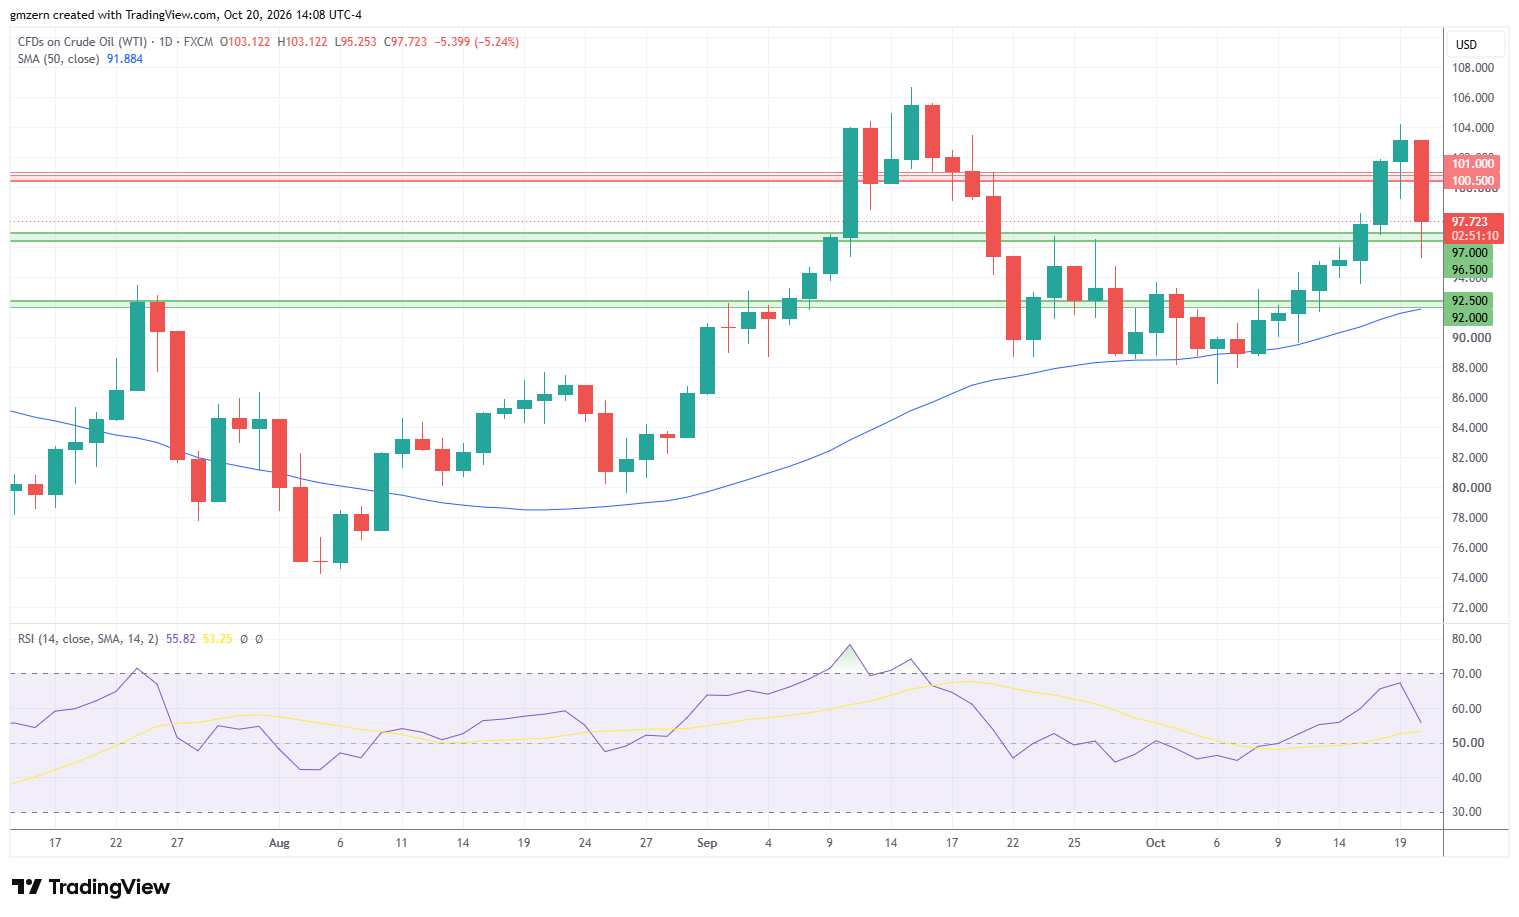
WTI oil pulled back as traders switched to December contract. Traders also stay focused on the news from the Middle East.
Today, several reports indicated that U.S. and Iran were close to a peace deal. The reports triggered a sell-off in the oil markets, although traders were somewhat cautious. Not surprisingly, these reports were refuted. As it turned out, U.S. and Iran had some negotiations, but they were not close to a peace deal.
Meanwhile, Iran has increased attacks on ships in the Strait of Hormuz. According ot Bloomberg calculations, 23 ships were attacked in the first two weeks of October. Iran is trying to stop vessels going through “unauthorized” routes. Such attacks raise fees and have a material impact on the oil market.
WTI oil has recently made an attempt to settle below the support at $96.50 – $97.00 but failed to develop sufficient downside momentum. In case WTI oil manages to settle below the $96.50 level, it will head towards the next support, which is located in the $92.00 – $92.50 range.
On the upside, a move above the $99.00 level will push WTI oil towards the nearest resistance, which is located in the $100.50 – $101.00 range.
Natural Gas Price Forecast
Every new Natural Gas analysis as it publishes, today's technical signal and key levels, live price — on one page.
See all Natural Gas forecastsBrent Oil Remains Stuck Near Key Resistance Level
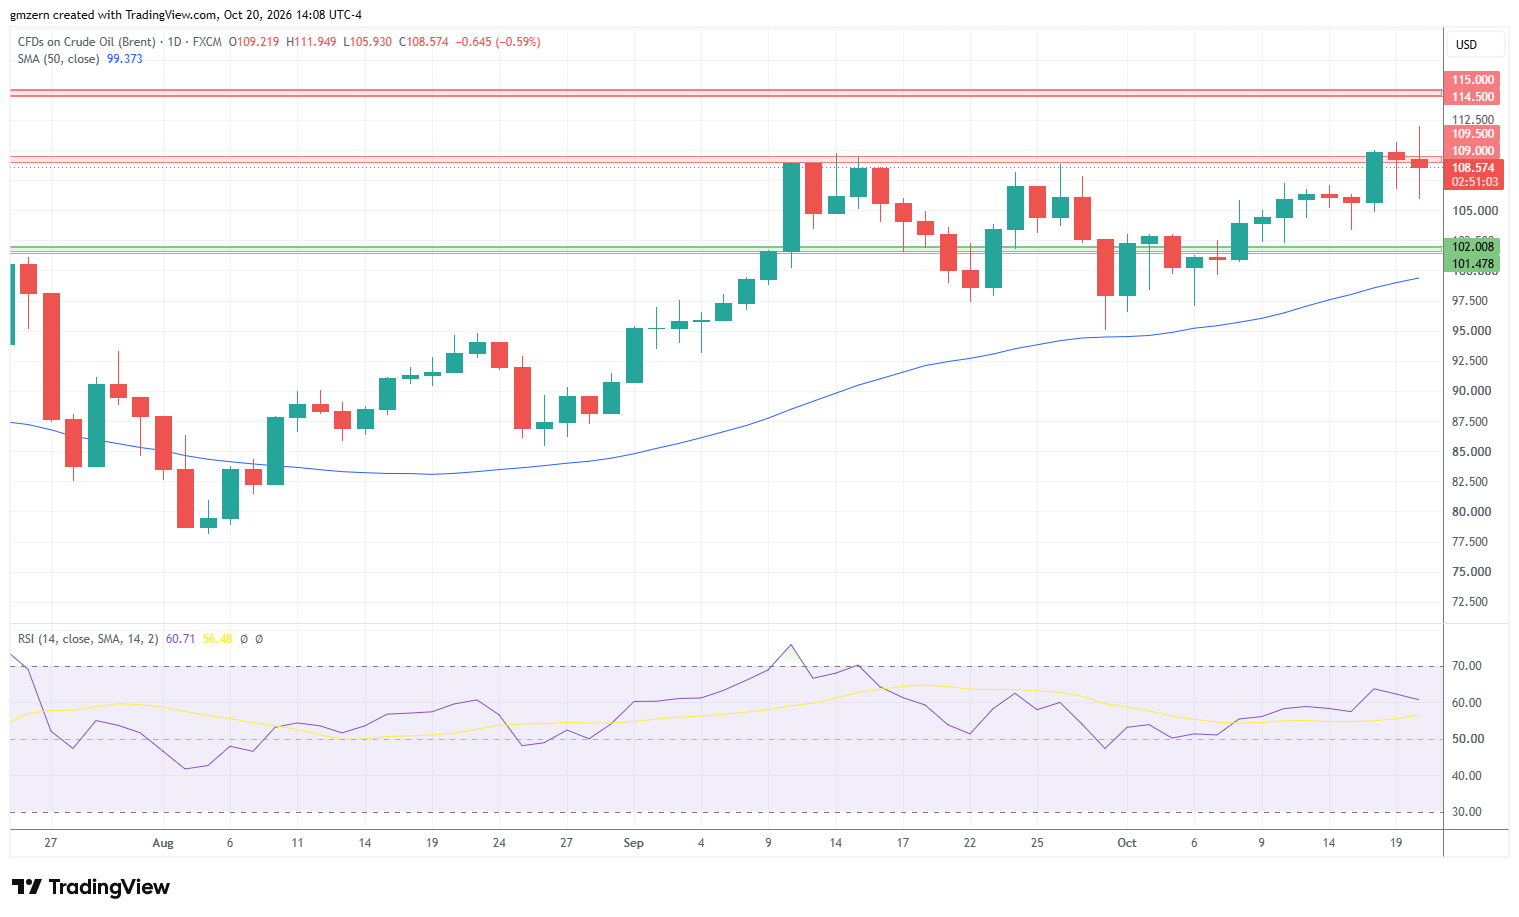
Brent oil pulled back from session highs as traders focused on U.S. – Iran negotiations. It remains to be seen whether negotiations will lead to any breakthrough as Iran is not ready for concessions.
I’d also note that U.S. and Iran were negotiating ahead of the start of the military operation against Iran back in February. Thus, negotiations do not lower the risk of escalation.
Meanwhile, UK said that it would deploy fighter jets to protect Saudi Arabia from Iran-backed Houthis. The attacks of the militant group have already put some pressure on Saudi Arabia’s economy.
In case Brent oil settles above the resistance level at $109.00 – $109.50, it will head towards the next resistance at $114.50 – $115.00. A move above $115.00 will indicate that the market is in a state of panic.
On the support side, a move below the $106.00 level will open the way to the test of the support level at $101.50 – $102.00.
If you’d like to know more about how commodity markets work, please visit our educational area.