
Complete Five-Wave Decline and Rebound From October 6 Low Underway
On September 9, I posted that the Elliott Wave Principle (EWP) showed a five-wave decline to 50,250-750 was the most likely path for the Dow Jones (DJIA). Ideally, the 3rd wave would reach 51,000 +/- 250, and the 4th wave 52,250 +/- 250. I followed this up with a post on September 30, showing
“…support around 50,500, the February high. In addition, the green 161.8% Fibonacci extension of W-1, measured from W-2, sits at ~50,484, … Thus, downside risk vs. upside reward over the next few days to weeks appears skewed toward upside reward.”
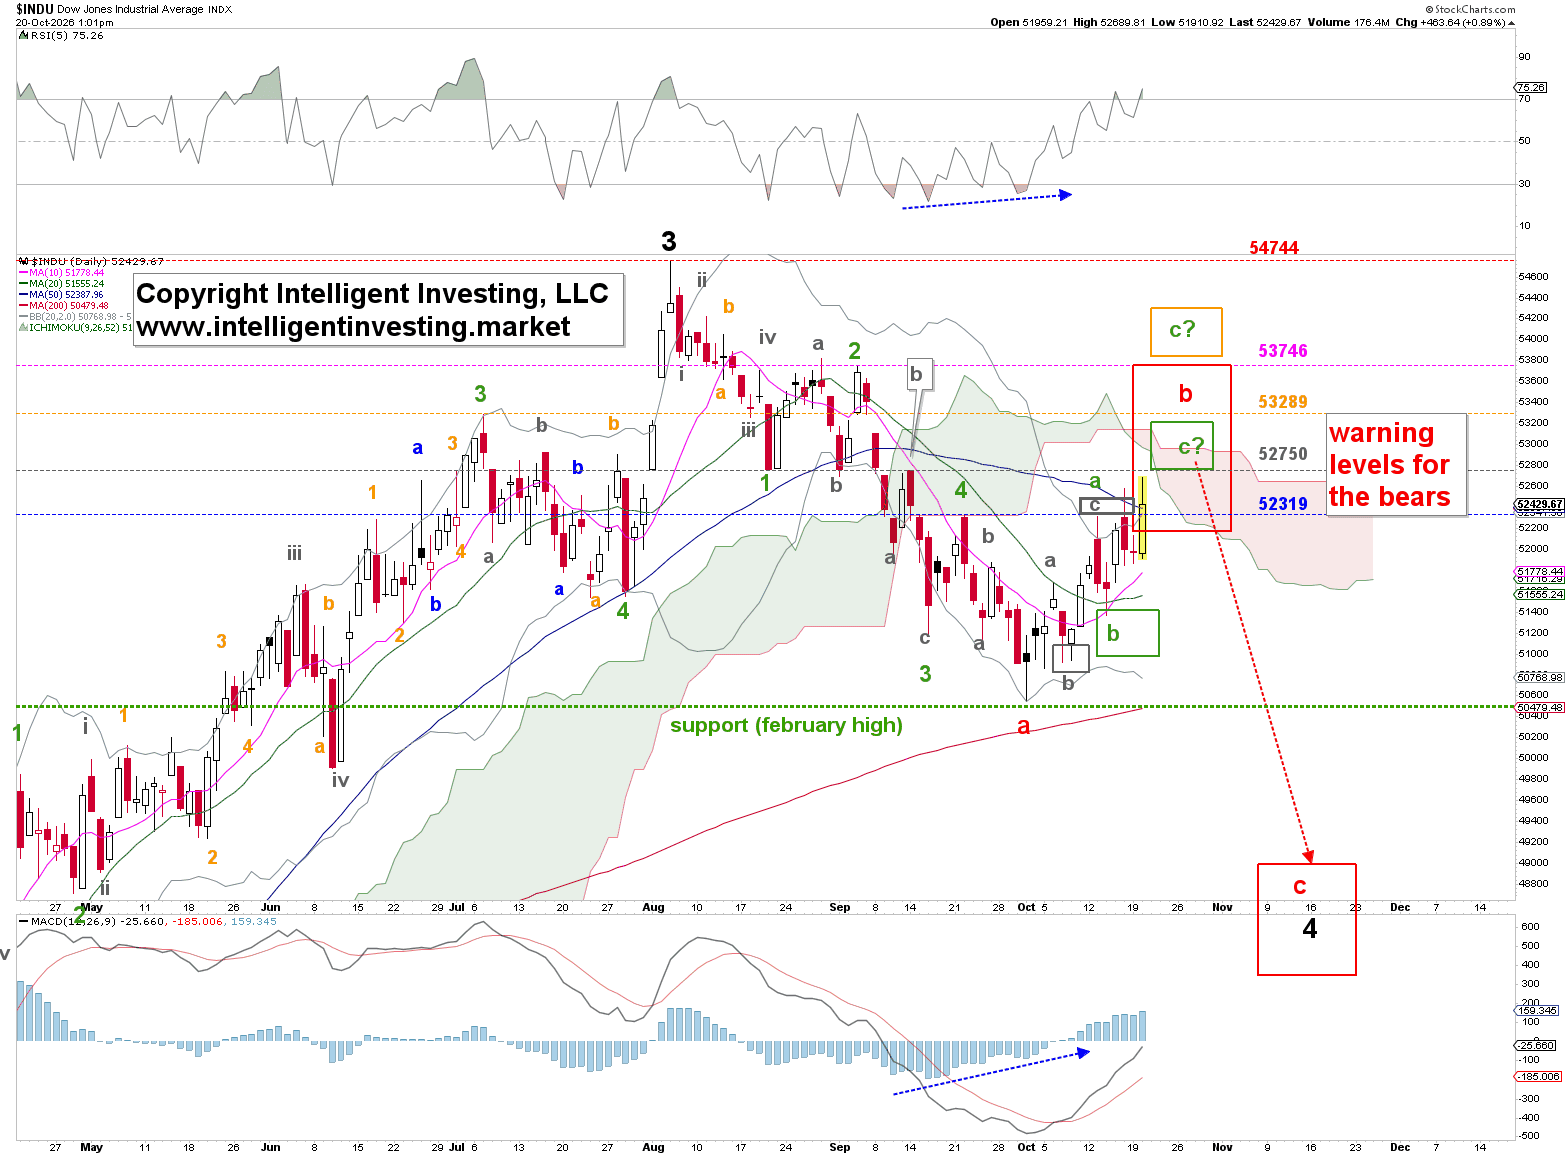
Fast forward, the index bottomed out at 51,186 on September 16 for W-3, peaked at 52,319 for W-4 on September 22, and reached 50,546 for W-5 on October 6. It is now trading in the low 52,000s. See Figure 1 below. Thus, the DJIA followed the ideal EWP path to the T.

October 6 Low Holds Key to New Highs Near 57,000
Figure 1 above suggests the current rally from the October 6 low may be only a bounce, red Wave-b to ideally 52,750-53,250, possibly as high as 53,750-54,250, followed by another decline (red W-c) that could complete a larger 4th-wave correction at the mid- to high 40,000s. However, based on the NYSE’s EWP count shown in our previous update, the DJIA is more likely to rally to new all-time highs: red W-ix in Figure 2 below.
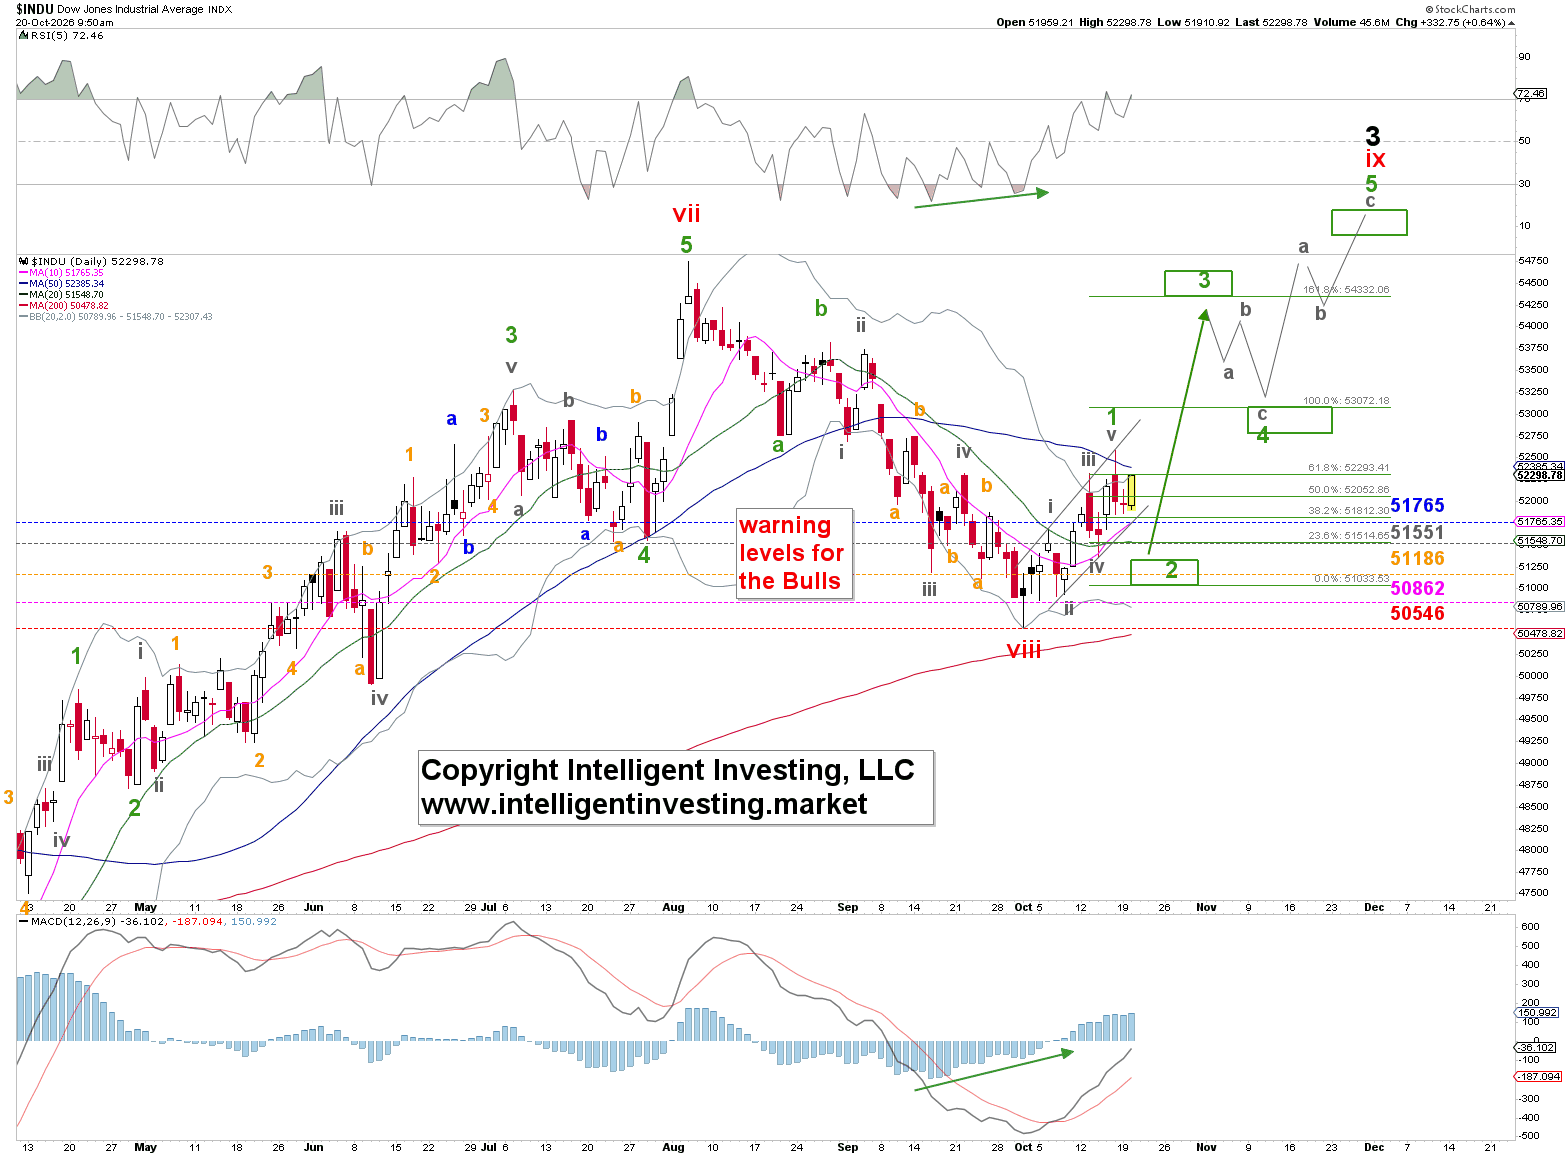
Thus, as long as the October 6 low holds, we can allow the DJIA to rally to new ATHs (57,000 +/- 1000) in a five-green-wave move, roughly as outlined in Figure 2 above. However, a break below that low, after first stalling around 53,500 +/- 500, opens the door to a waterfall decline into the 40,000s.