Silver
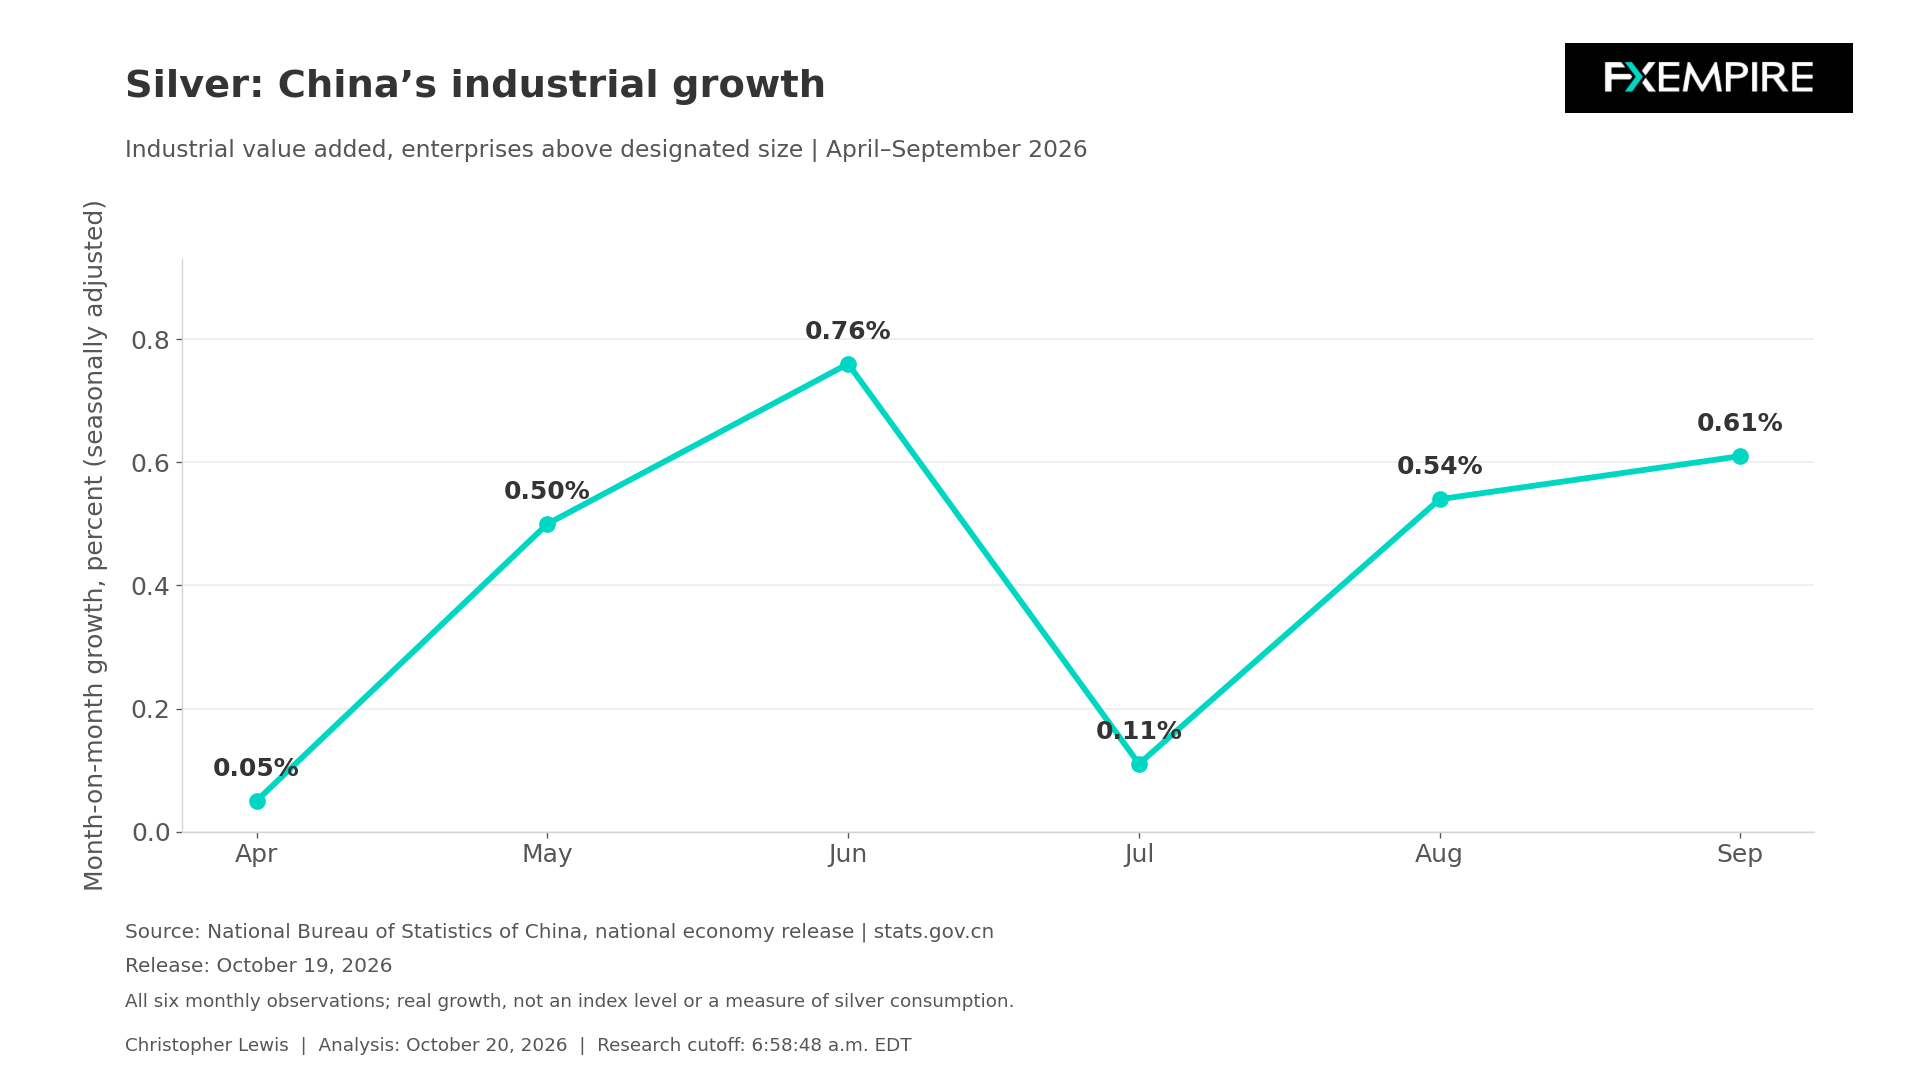
The latest fundamental evidence for silver points to an uneven combination of industrial resilience and less favorable financing conditions. China’s National Bureau of Statistics reported yesterday that September industrial value added at enterprises above designated size rose 5.5% year over year in real terms, faster than August’s 5.2%. Seasonally adjusted monthly growth was 0.61%.
Those are September production measures released Monday, not proof that silver orders or consumption increased during today’s session. The industrial signal matters because silver’s investment characteristics coexist with its role as an input in manufacturing. Stronger production has the ability to support the environment in which industrial users operate, but broad output growth cannot establish the number of ounces consumed. Product mix, inventories, changes in silver intensity, and purchasing decisions can all separate factory activity from immediate physical demand.
The official release limits how far that constructive argument can be taken. Fixed-asset investment excluding rural households fell 7.2% over the first 9 months, while property development investment declined 20.6%. Retail sales in September increased 1.1% year over year in nominal terms. These periods and measures are different from real industrial growth.
This suggests that stronger factory output is coexisting with weakness elsewhere rather than confirming some type of recovery across household spending, capital expenditure, or construction. That distinct possibility is relevant when discussing electrical equipment, electronics, or solar applications. Expansion in broad manufacturing aggregates would not be relabeled as a measured increase in silver demand.
Without current official breakdown numbers linking activity to actual use, the defensible claim would be a bit narrower. The industrial environment has improved in one important respect, while several demand channels remain somewhat vulnerable.
U.S. manufacturing also provides a modest positive signal, with the Federal Reserve’s October 16 industrial production release estimating that manufacturing output increased 0.3% for September following a revised 0.2% decline in August. Total industrial production rose 0.7%, but utilities contributed with a 3.5% increase.

Silver’s Monetary Outlook Becomes More Complicated
Treasury’s 10-year yield rose to 2.80% on October 19 from 2.74% on October 16. Higher inflation-adjusted government returns can increase the opportunity cost of non-yielding assets such as gold. Silver can also move with gold-related investment demand, although the industrial component means the two metals are not necessarily going to behave the same at all times.
Last week’s inflation data remains relevant to policy tension. CPI in September rose 0.6% monthly, with core CPI up 0.3%. September final-demand PPI increased 1.3% monthly as well, with both monthly readings seasonally adjusted. These are separate consumer and producer measures. They are not fresh announcements, but they do suggest that inflation continues to pick up.
The stronger scenario for silver would be confined, sustained industrial activity with rising real yields and evidence that physical users are absorbing available supply. The weaker scenario would involve persistent financing pressure along with industrial growth failing to strengthen.
The October 27 and 28 Federal Reserve meeting is a scheduled policy catalyst, while subsequent official production and inventory releases could test the industrial story. The chart below plots all monthly observations in the chosen April-through-September period for China’s seasonally adjusted industrial growth. It shows fluctuation in the pace of expansion rather than an uninterrupted acceleration or a silver consumption series. This can have a certain influence on industrial demand for silver, but does not necessarily always translate to higher prices.
Silver Price Forecast
Every new Silver analysis as it publishes, today's technical signal and key levels, live price — on one page.
See all Silver forecasts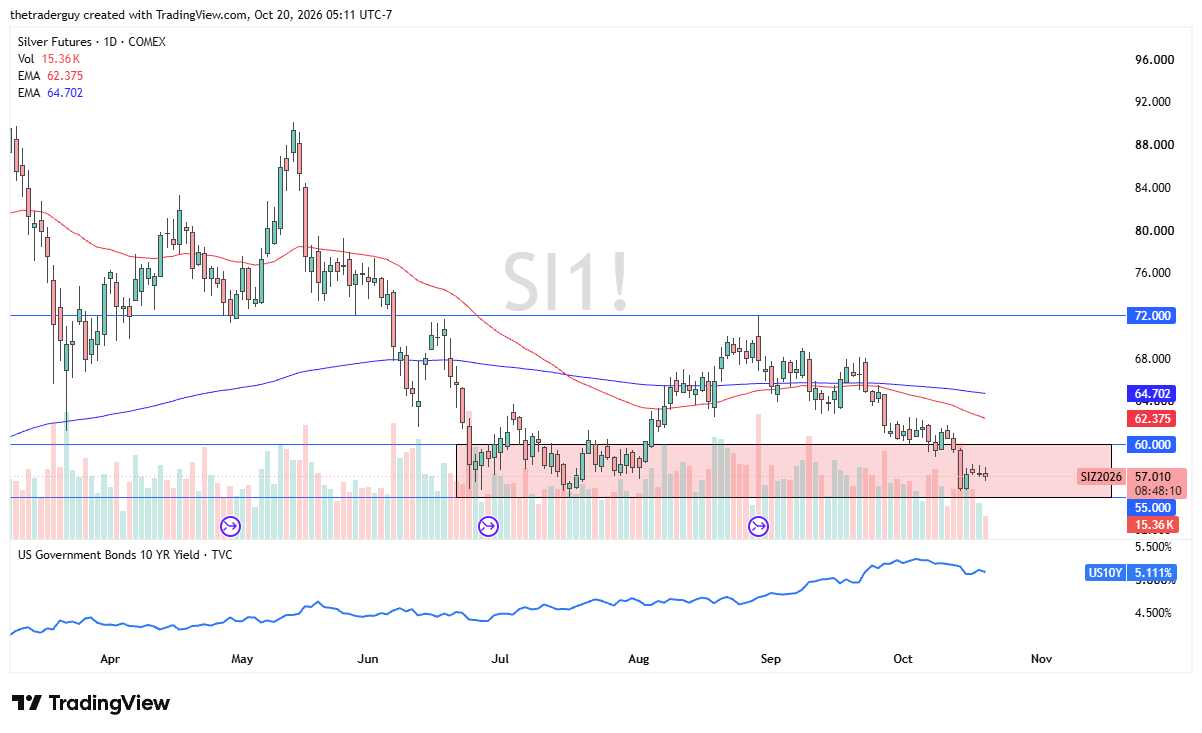
From a technical analysis standpoint, it looks as if silver is simply hanging around in a demand zone that expands from $55 on the bottom to $60 on the top. Silver currently looks very neutral and flat, which makes sense considering that the interest-rate situation in America continues to be elevated, but somewhat quiet over the last few sessions.