Gold
Gold’s immediate macroeconomic backdrop has shifted from last week’s falling real yields to a modest reversal. October 19 saw the Treasury’s daily curve put the 10-year inflation-protected real yield at 2.80%, up from 2.74% on October 16. It nevertheless remains below October 9’s 2.91%. That combination matters.
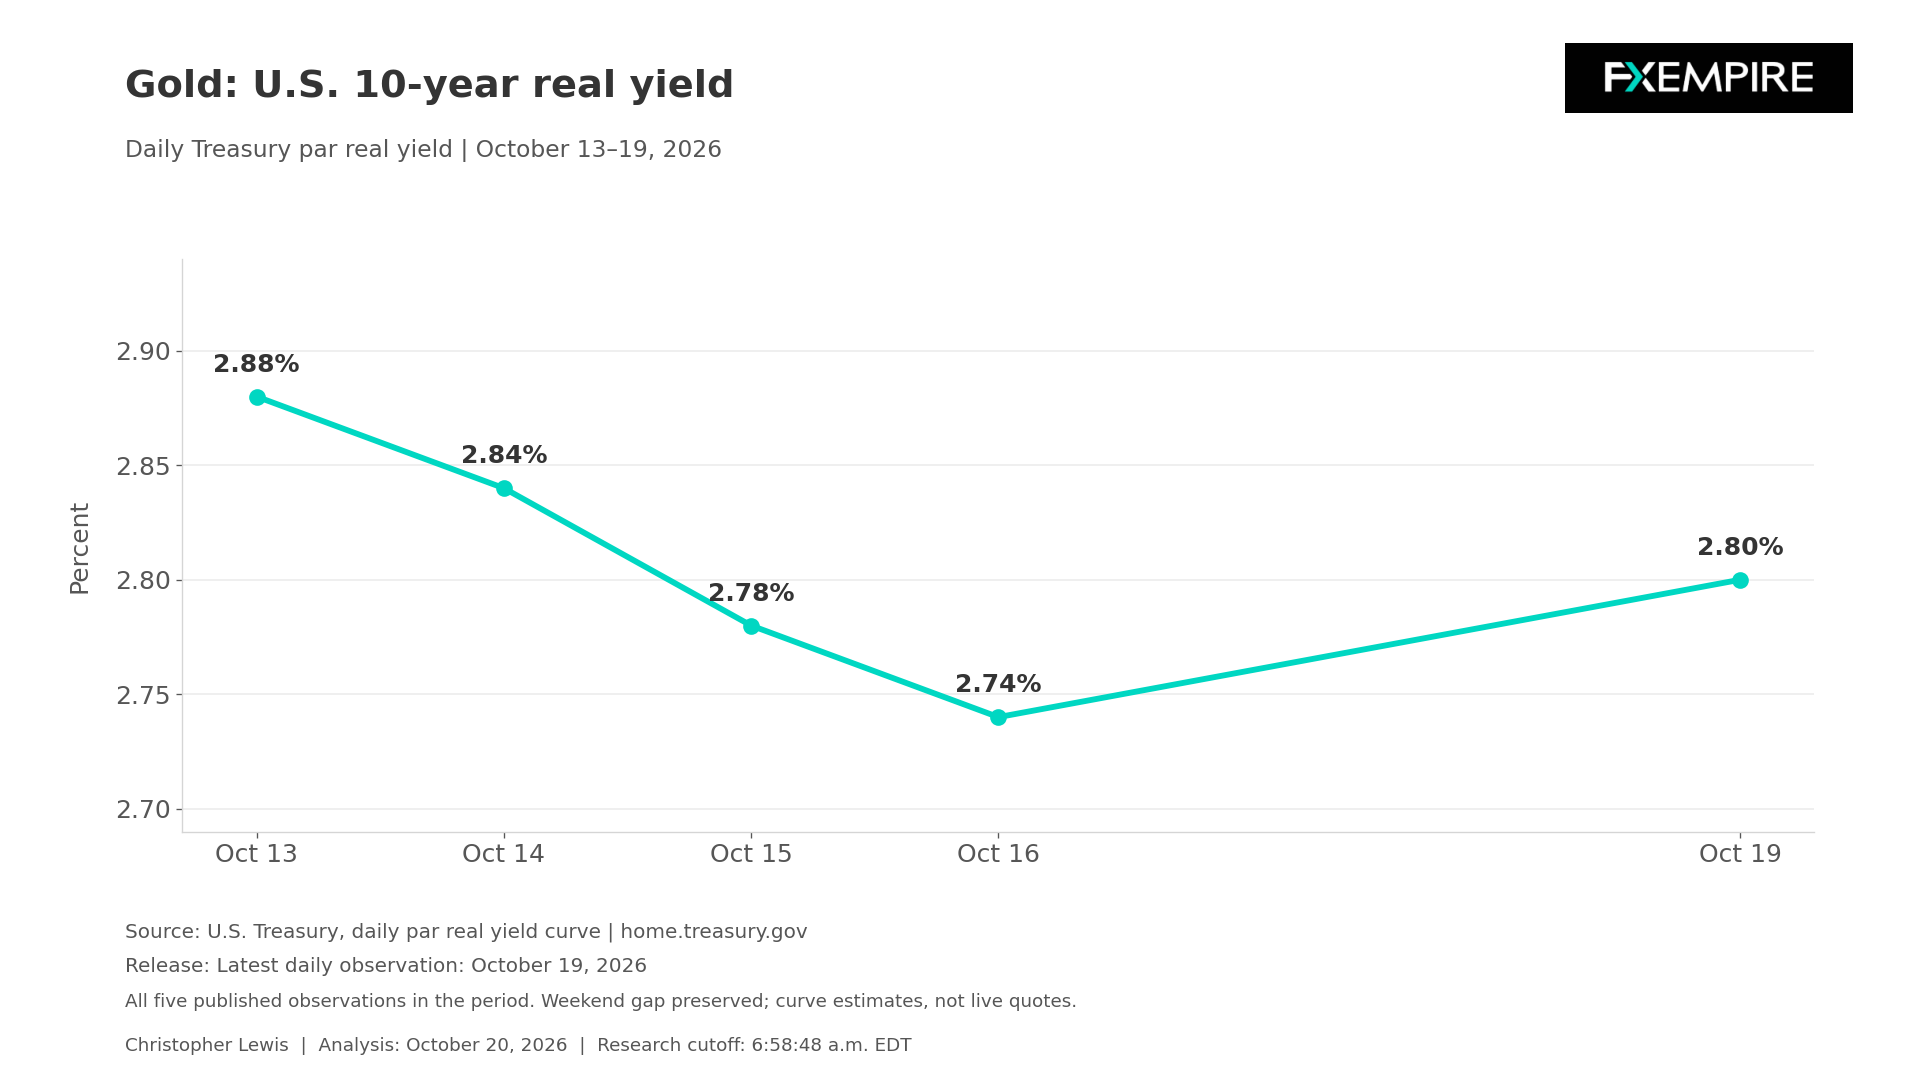
Monday interrupted the easing in one important competing return but did not erase the earlier decline. For gold, a higher real government yield can increase the opportunity cost of holding an asset that pays no income. Monday’s move makes the financing backdrop less accommodating at the margin, but it does not prove that gold fell because of yields, nor does it establish a stable relationship that holds every particular session. Investment demand, changes in currency, and risk appetite movements can also outweigh the interest-rate mechanism.
Nominal yields moved higher as well. The October 19 figures show a 2-year yield at 4.77% and the 10-year yield at 5.15%, compared with 4.74% and 5.09% last Friday. The simultaneous rise in nominal and real measures is more informative than the nominal move alone. It does caution against assuming any increase in market interest rates simply reflects greater compensation for inflation, which would have a different implication for gold itself.
Inflation remains a material part of the background, but the relevant releases came out last week. This would have been the September CPI, which rose 0.6% on a seasonally adjusted monthly basis and 3.7% over 12 months before seasonal adjustment. Core CPI increased 0.3% monthly and 2.6% annually. Gasoline’s 9.1% monthly increase accounted for more than half of the headline monthly advance. That concentration makes it useful to distinguish an energy-driven shock from uniform acceleration across consumer prices.
September PPI, released on the 15th, added a separate warning about producer costs. Final-demand prices increased 1.3%, seasonally adjusted over the month, and 6.3% over 12 months on an unadjusted basis. Excluding food, energy, and trade services, prices rose 0.5% monthly. PPI measures prices received by domestic producers. It does not make for an alternative reading of household inflation.
Gold implications run in two different directions. Persistent inflation could strengthen interest in preserving purchasing power, while an official response that remains restrictive from the Federal Reserve, with financing conditions rising, can raise the cost of owning gold. The relevant question is how those forces interact, whether an inflation release is automatically positive for gold, because sometimes it isn’t. Producer price pressure also need not pass immediately or completely into consumer prices.
The Federal Reserve’s next scheduled interest-rate decision is October 27 and 28. This upcoming decision is still somewhat of an open question, but it is worth noting that fed funds futures are suggesting that the Federal Reserve will raise interest rates in December, not in October.
Gold Price Forecast
Every new Gold analysis as it publishes, today's technical signal and key levels, live price — on one page.
See all Gold forecastsFor a stronger gold narrative, the helpful combination would be renewed declines in real yields alongside continued demand for protection against economic or policy uncertainty. Real-yield rebounds that sustain could weaken that case, especially if inflation pressure also moderates. These are conditional analytical scenarios. Neither requires assuming gold sensitivity to yields is constant.
The chart below focuses on the official real-yield series rather than manufacturing a current bullion quote. It shows the full set of published observations from October 13 through October 19, preserving the weekend gap.

Technical Analysis
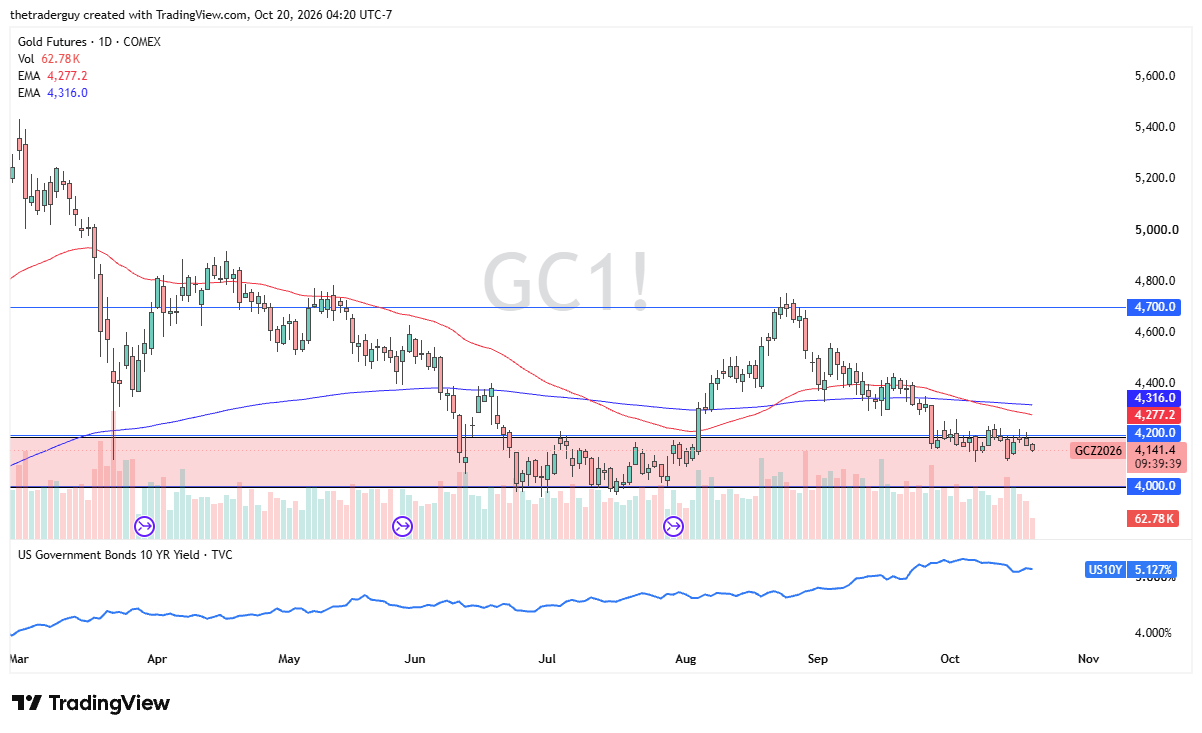
From a technical analysis standpoint, gold seems to be sitting in a major demand zone and is trying to sort out whether or not it can turn things around. The $4,200 level is the beginning of significant resistance above, while the $4,000 level underneath seems to be a hard floor the market does not wish to challenge. A move below the $4,000 level would be very negative. A move above $4,260 could have the buyers trying to push higher again.
As things stand right now, gold is a very neutral market as it is being pulled in both directions.