


Gold (XAU) and silver (XAG) prices remain under pressure after the release of the latest inflation data, which keeps the possibility of rate hikes in the near future. The chart below shows that the PCE price index increased by 0.5% in September as compared to 0.3% in August.
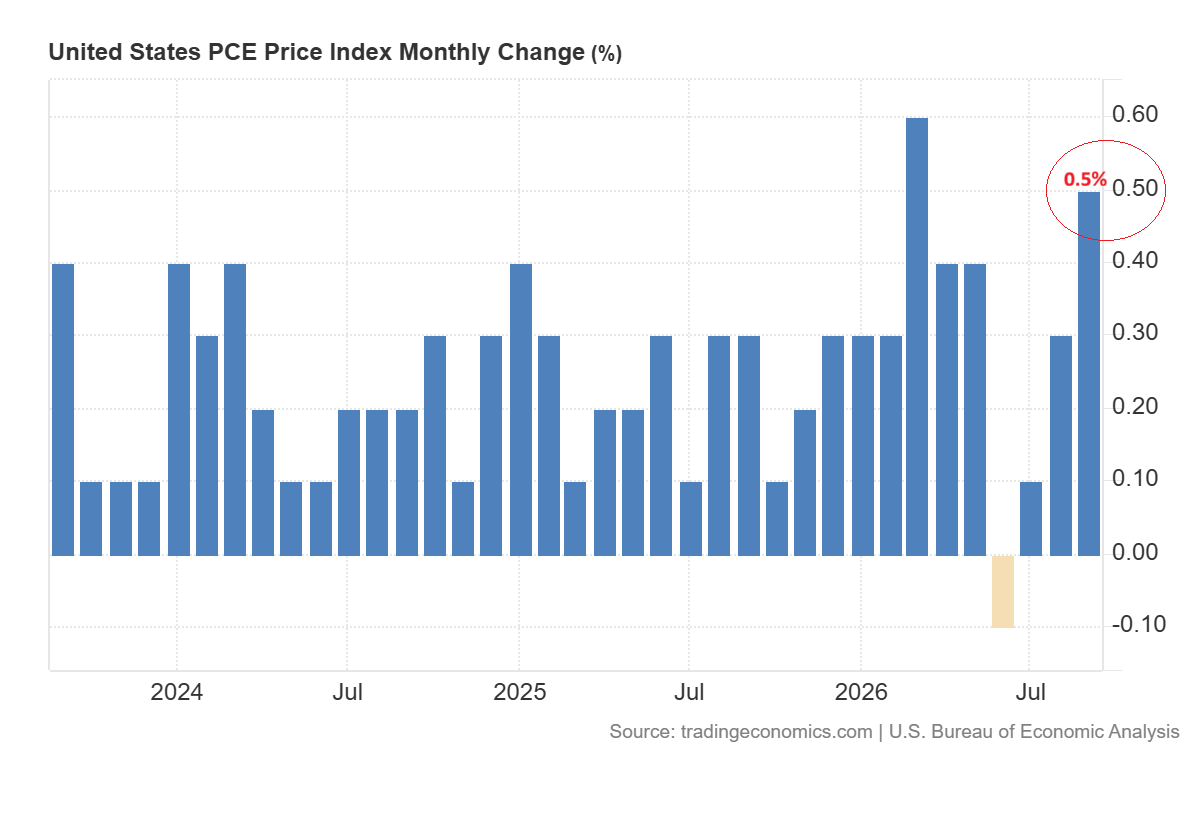
The annual core PCE inflation also remains at 3.1%, which is above the 2% target set by the Fed. The Federal Reserve kept rates unchanged in October but two officials voted for a rate hike. I think that the prospect of higher interest rates keeps gold and silver prices under pressure in the short term. The silver price faces even greater pressure compared to gold and dropped by 3.37% on Thursday.
Gold Price Forecast: Break Below $3,950 Could Bring $3,800 Into View
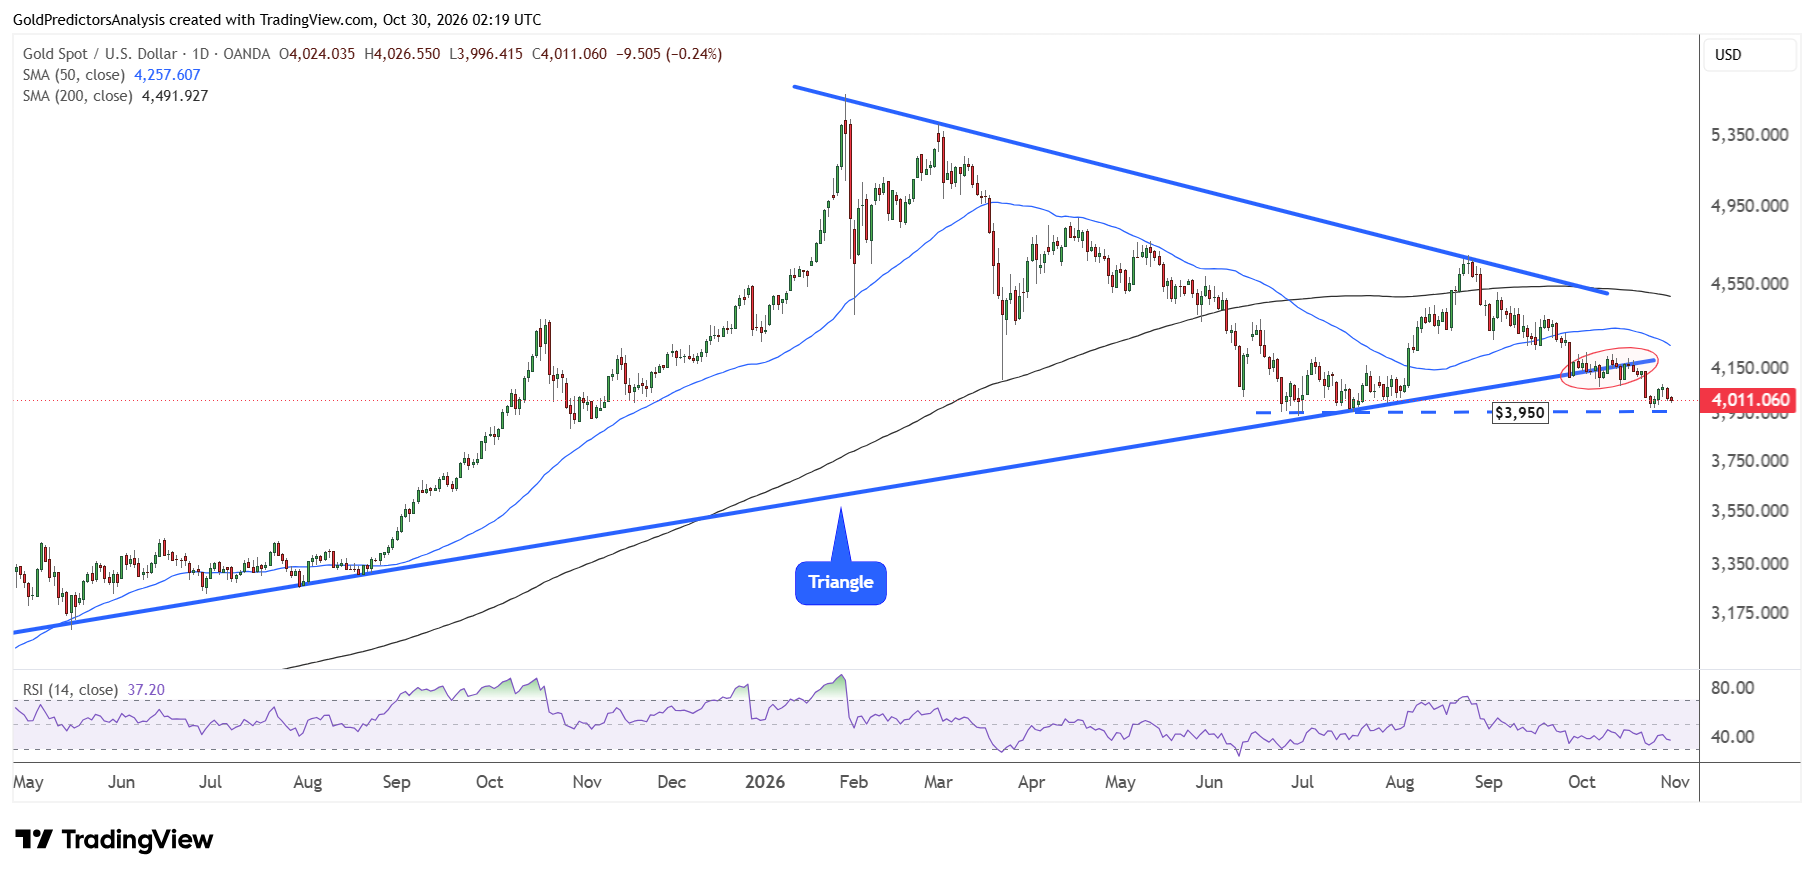
The daily chart for spot gold shows that the price has broken the triangle pattern in October. The price continues to drop towards the key $3,950 to $4,000 area. A break below $3,950 will likely indicate deeper correction towards the $3,800 area in the short term.
The RSI remains below the 50 level and continues to drop steadily. This suggests that the trend in gold still remains negative in the short term.
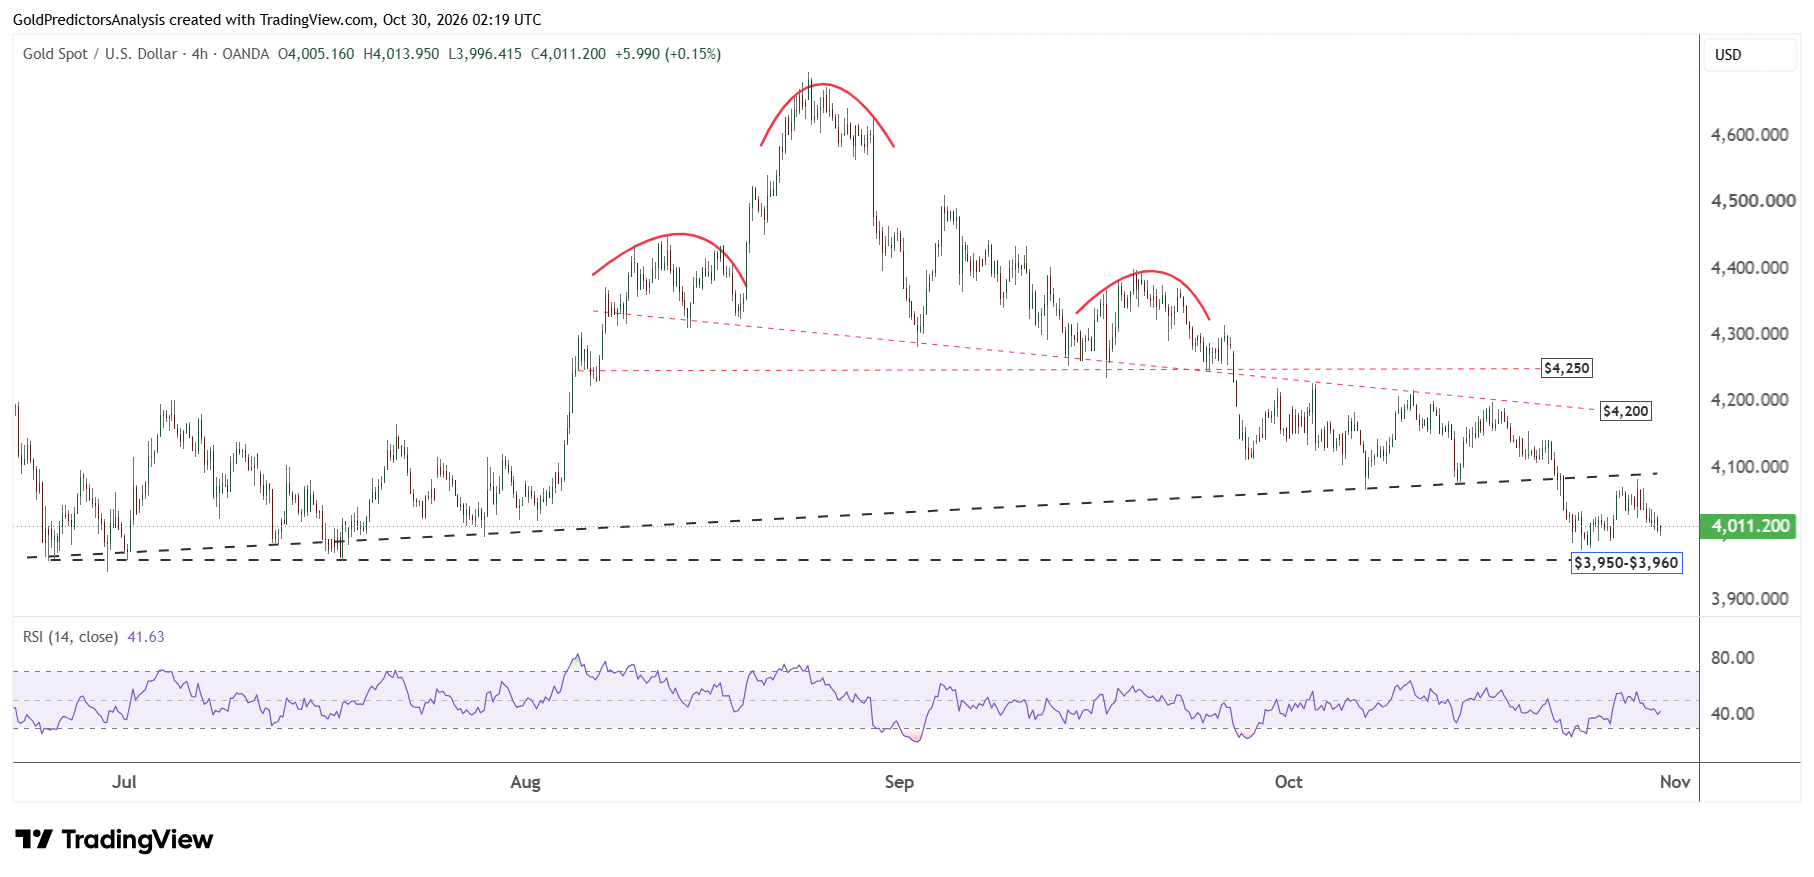
The 4-hour chart for spot gold also shows that the rebound from $3,975 has found strong resistance at the ascending trend line at $4,082. The price again continues to drop towards the $4,000 area.
A break below the $3,950 level will likely confirm negative price action and lead to continued drop in gold prices in the short term. But a recovery above $4,082 may open the way for further upside towards the $4,200 level.
Gold Price Forecast
Every new Gold analysis as it publishes, today's technical signal and key levels, live price — on one page.
See all Gold forecastsSilver Price Forecast: Decline Puts $48–$50 Support in Focus
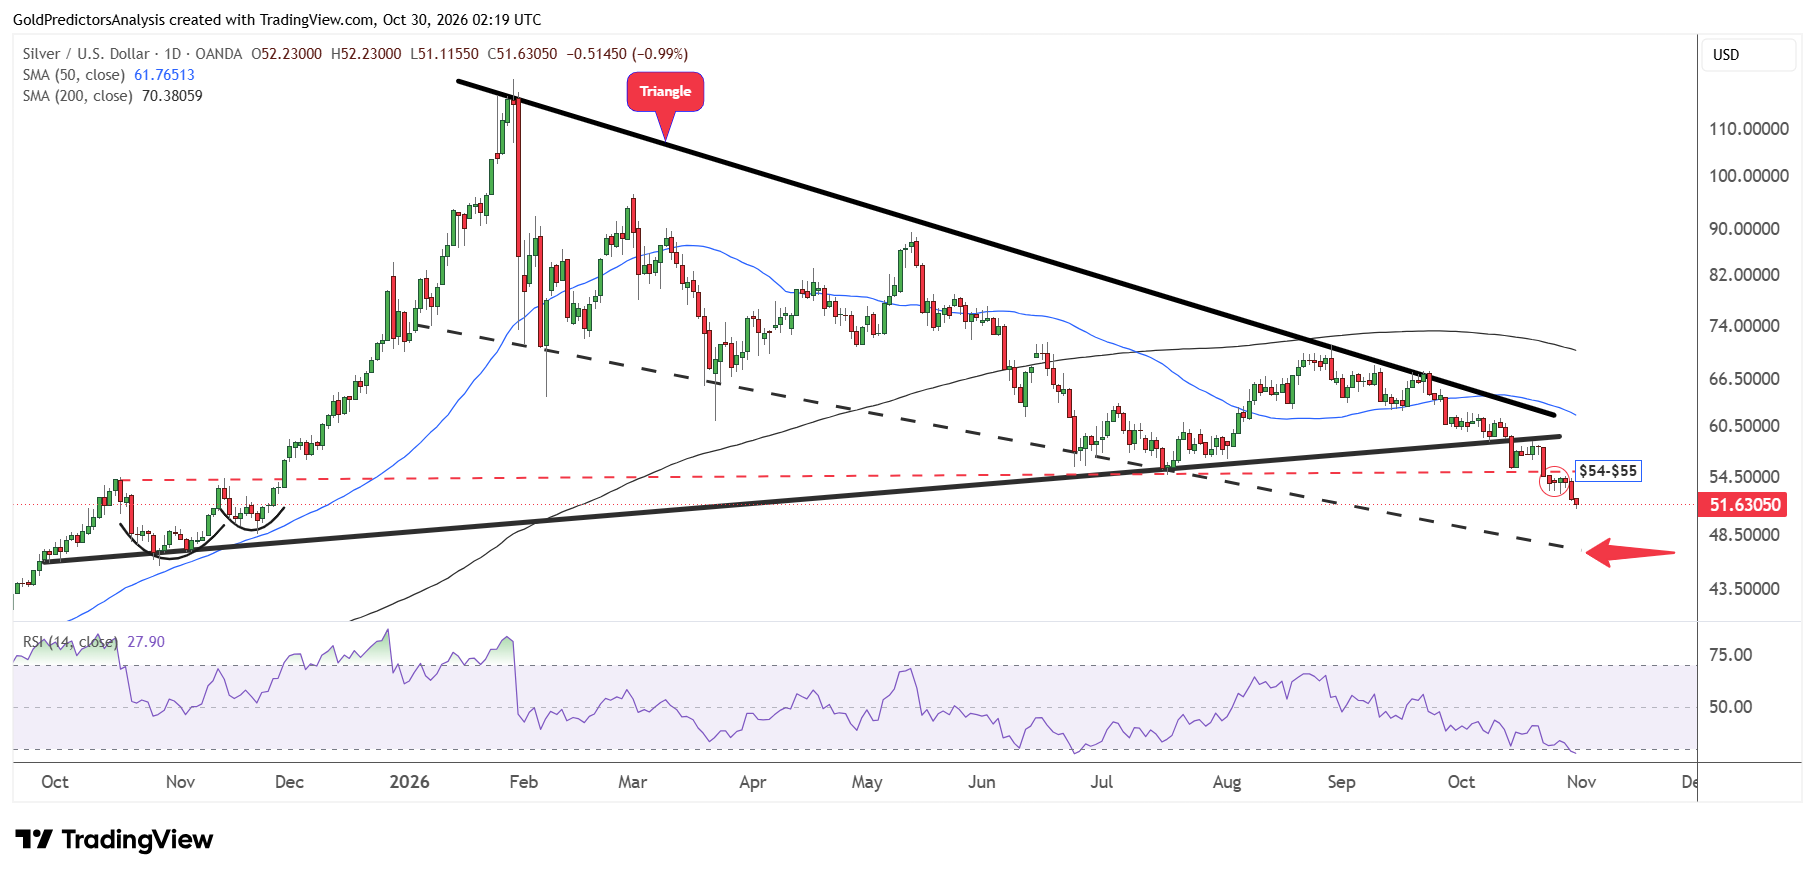
The daily chart for spot silver shows that the price continues to drop after the breakout from the triangle pattern in October 2026 at the $58 level. The price has also broken below the support at $55 and remains in a strong bearish trend.
This bearish pressure in silver may suggest that the price may continue to drop in the short term. This drop may continue toward the support of the descending trend line near the $48-$50 area.
A break below $48-$50 may extend the decline to the $45-$46 area. But the RSI is now approaching oversold levels. This suggests that prices may be nearing major bottom in the silver market.
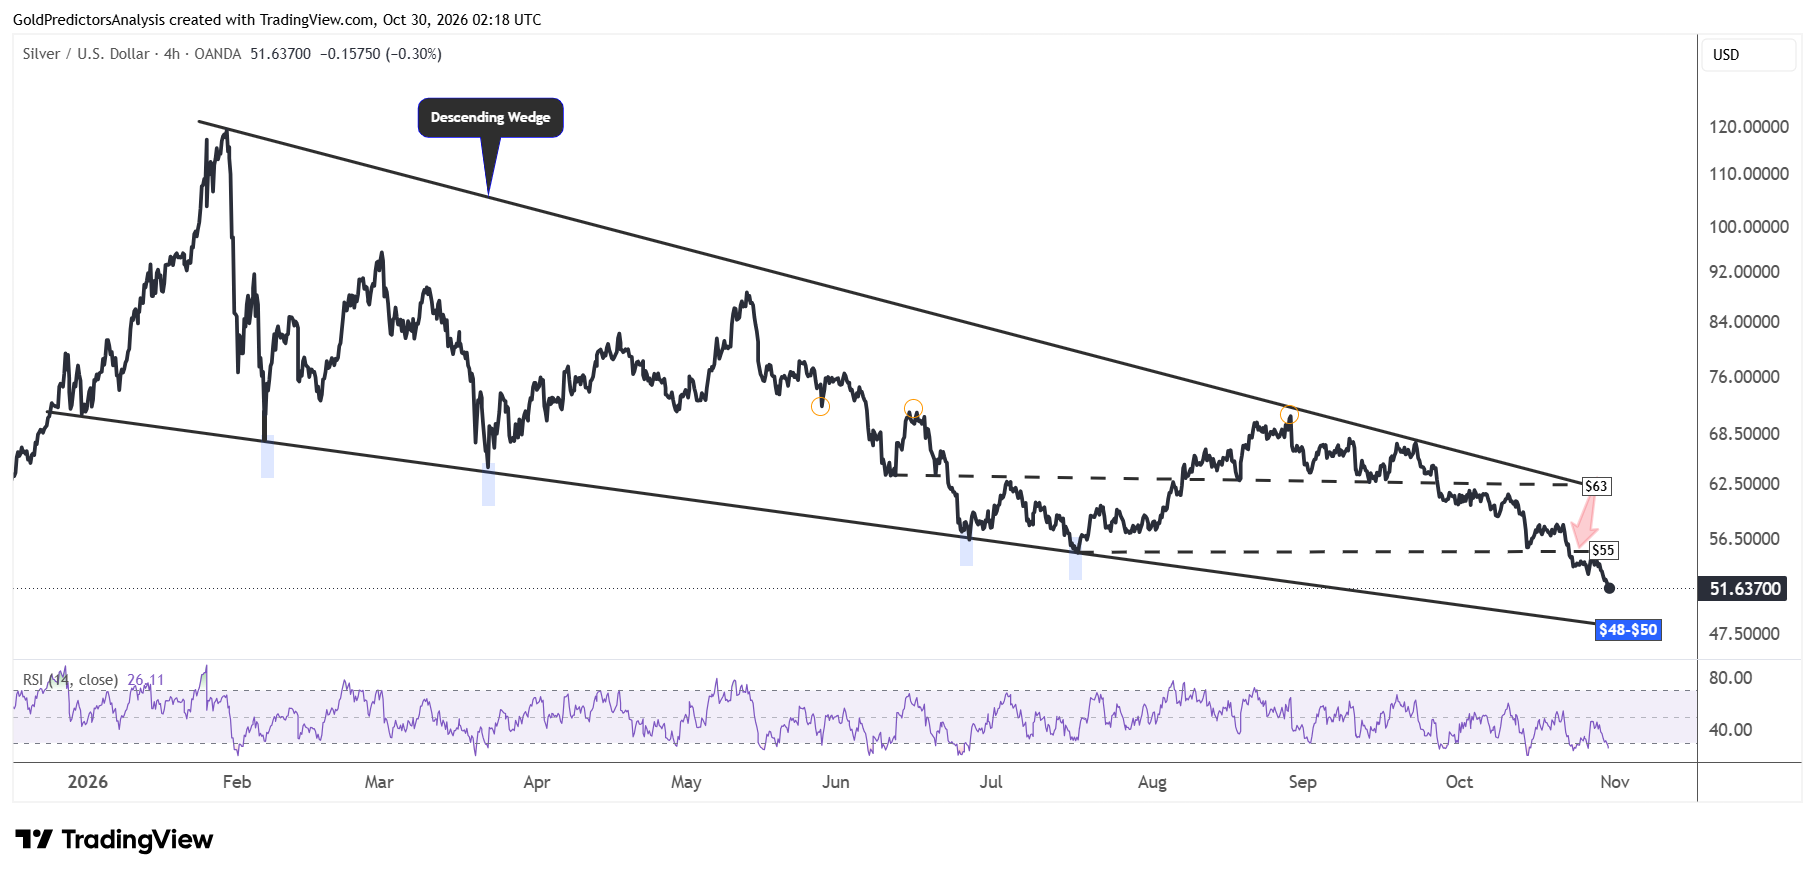
The 4-hour chart for spot silver also shows strong bearish pressure in the short term. This suggests that prices may drop towards the $48 to $50 area in the short term.
This support is defined by lower boundary of the descending wedge pattern. A recovery above $55 may ease the bearish pressure in the short term and open the way for further upside towards the $63 level.
Gold-to-Silver Ratio Nears 80 as Silver Underperforms
The silver price is dropping faster than gold. Silver has lost over 14% in October as of Friday, while the gold price has lost nearly 3.80%. The strong bearish pressure in silver prices has pushed the gold to silver ratio above the 73 level. This level has been the key resistance in the ratio.
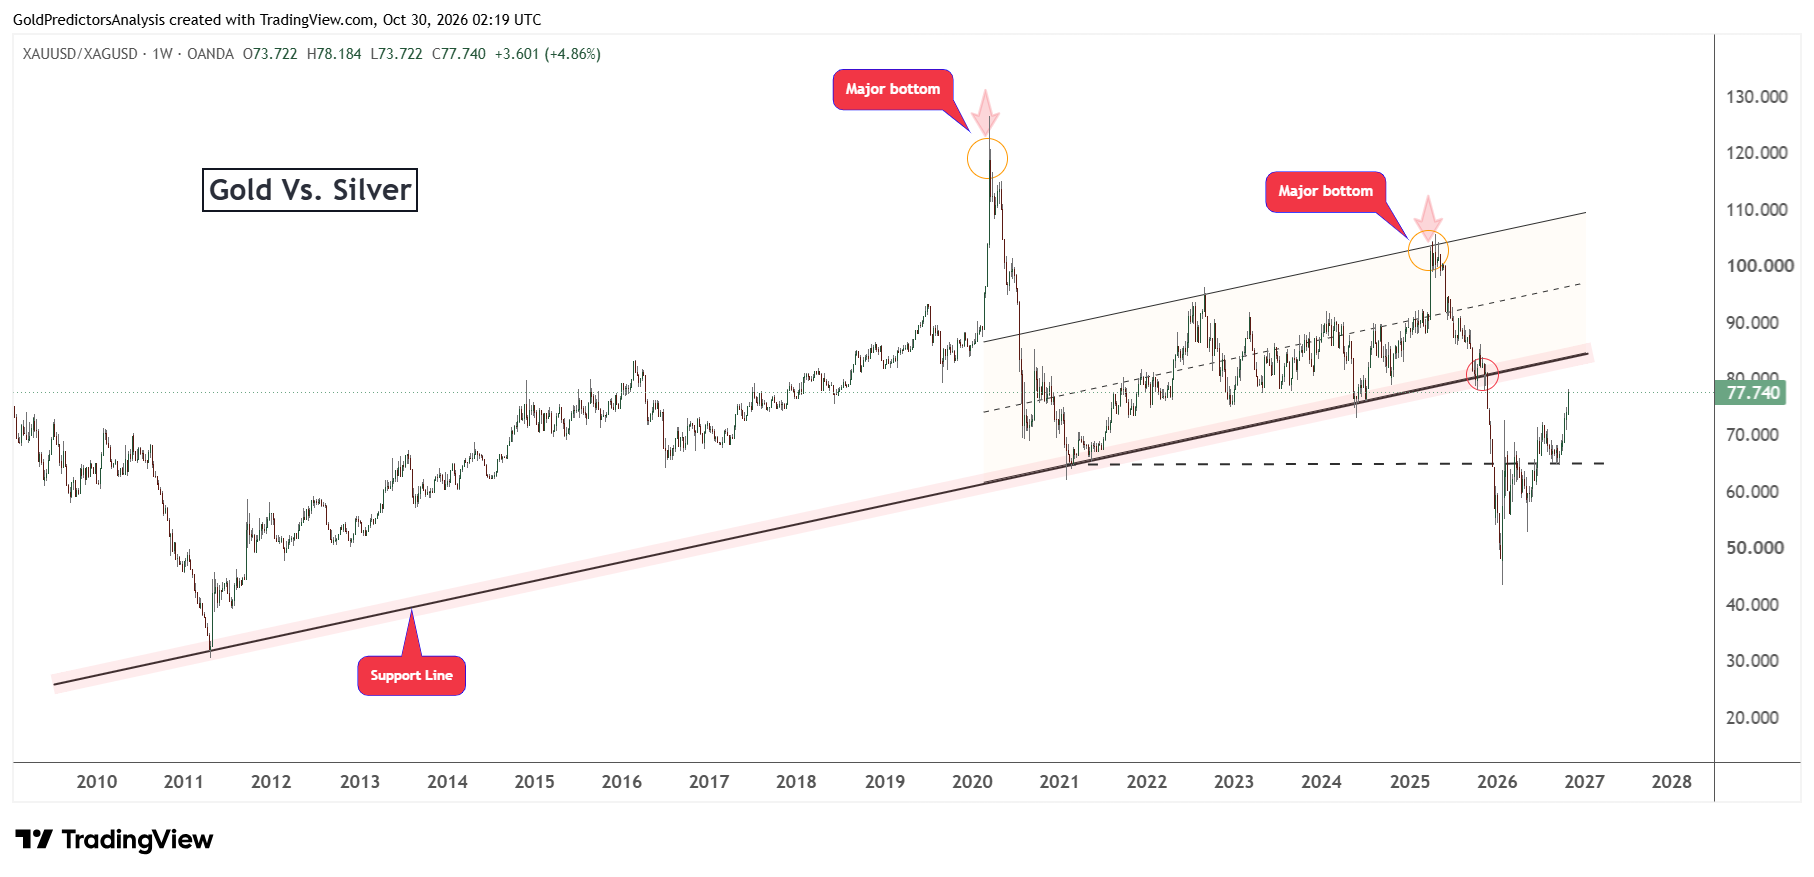
This breakout has pushed the ratio higher in October and it is now approaching the resistance area near 80. The major peaks in the ratio are correlated with the major bottoms in the gold and silver markets. Therefore, if the ratio finds a peak within the next few weeks and continues to decline, it may signal major bottom in gold and silver prices.
Moreover, silver prices are approaching the major support areas near $50 while gold prices are also approaching the major support zones during this decline. This means that this drop in gold and silver prices may attract renewed buying interest from investors.
What to Watch Next
Gold and silver prices remain under bearish pressure in October. The price look set to drop further in the short term due to expectations of high interest rates. The market is now waiting for Friday’s U.S. Employment Cost Index data for further clues about wage pressure.
A break below $3,950 will likely open the way for further downside towards the $3,800 area. On the other hand, the silver price must hold the $48 to $50 support in order to avoid deeper correction towards the $45 to $46 region.
The silver price requires a recovery above $55 and the gold price requires a recovery above $4,200 to ease bearish pressure. In my opinion, the next peak in the gold to silver ratio will likely signal major bottom in gold and silver prices.
Read more: Dow Ratio Warns of More Downside in Gold as Yields Rise