


Gold (XAU) price consolidates on Monday after the strong drop last week. Kansas City Fed President Jeff Schmid said that inflation is still too high which points to the high cost of energy. The market expects 92% chance of a Fed rate hike in December. The market also waits for comments from the Fed Chair, Kevin Warsh which may further provide direction to gold prices in the short term.
Silver (XAG) prices also remain under pressure after losing more than 6% last week. The strong US dollar and US Treasury yields keep the pressure on both metals. The US dollar index remains near the highest levels since April 2025. The short term price action suggests that gold and silver prices may remain under pressure as the US dollar remains strong.
Gold Price Forecast: A Break Below $3,760 Could Deepen the Sell-Off
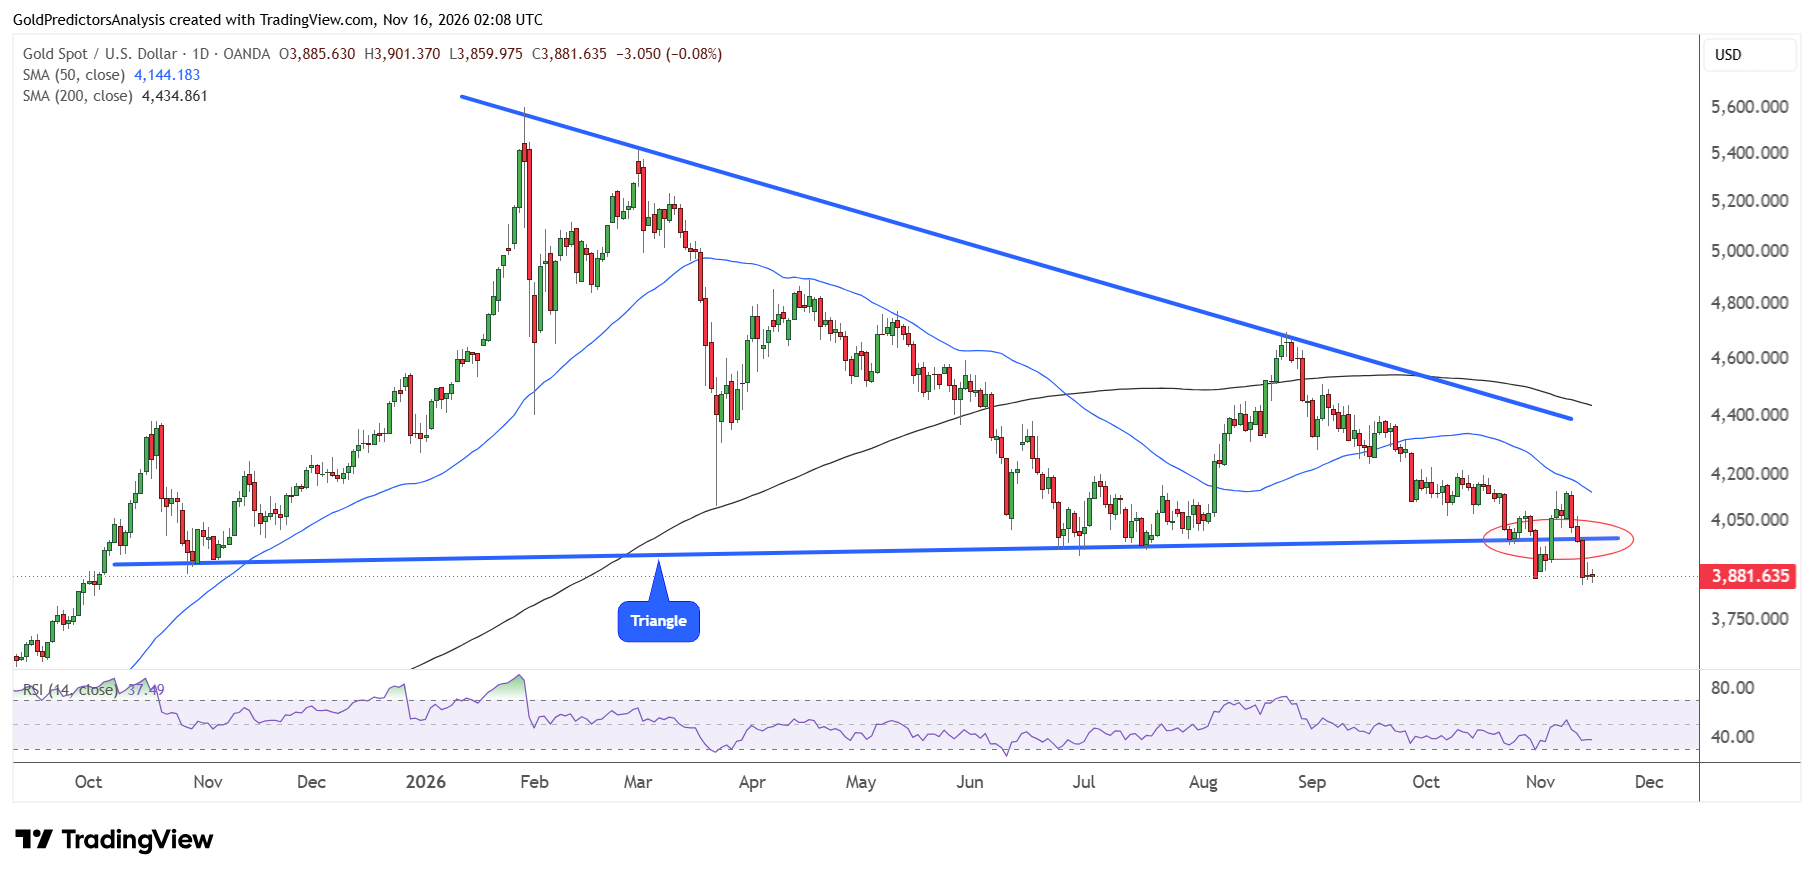
The daily chart for spot gold shows that the price remains under bearish pressure after the breakdown from the triangle near $4,000. The price is currently trading below $3,900 which suggests negative price action in the gold market.
The RSI also remains below the midline, which supports the negative outlook. The price remains below the 50-day and 200-day SMAs and is consolidating in tight range. The break below the triangle pattern suggests that the price is preparing for drop towards the $3,500-$3,600 region. The price must break above the 50-day SMA near $4,150 to confirm bottom and initiate a rebound.
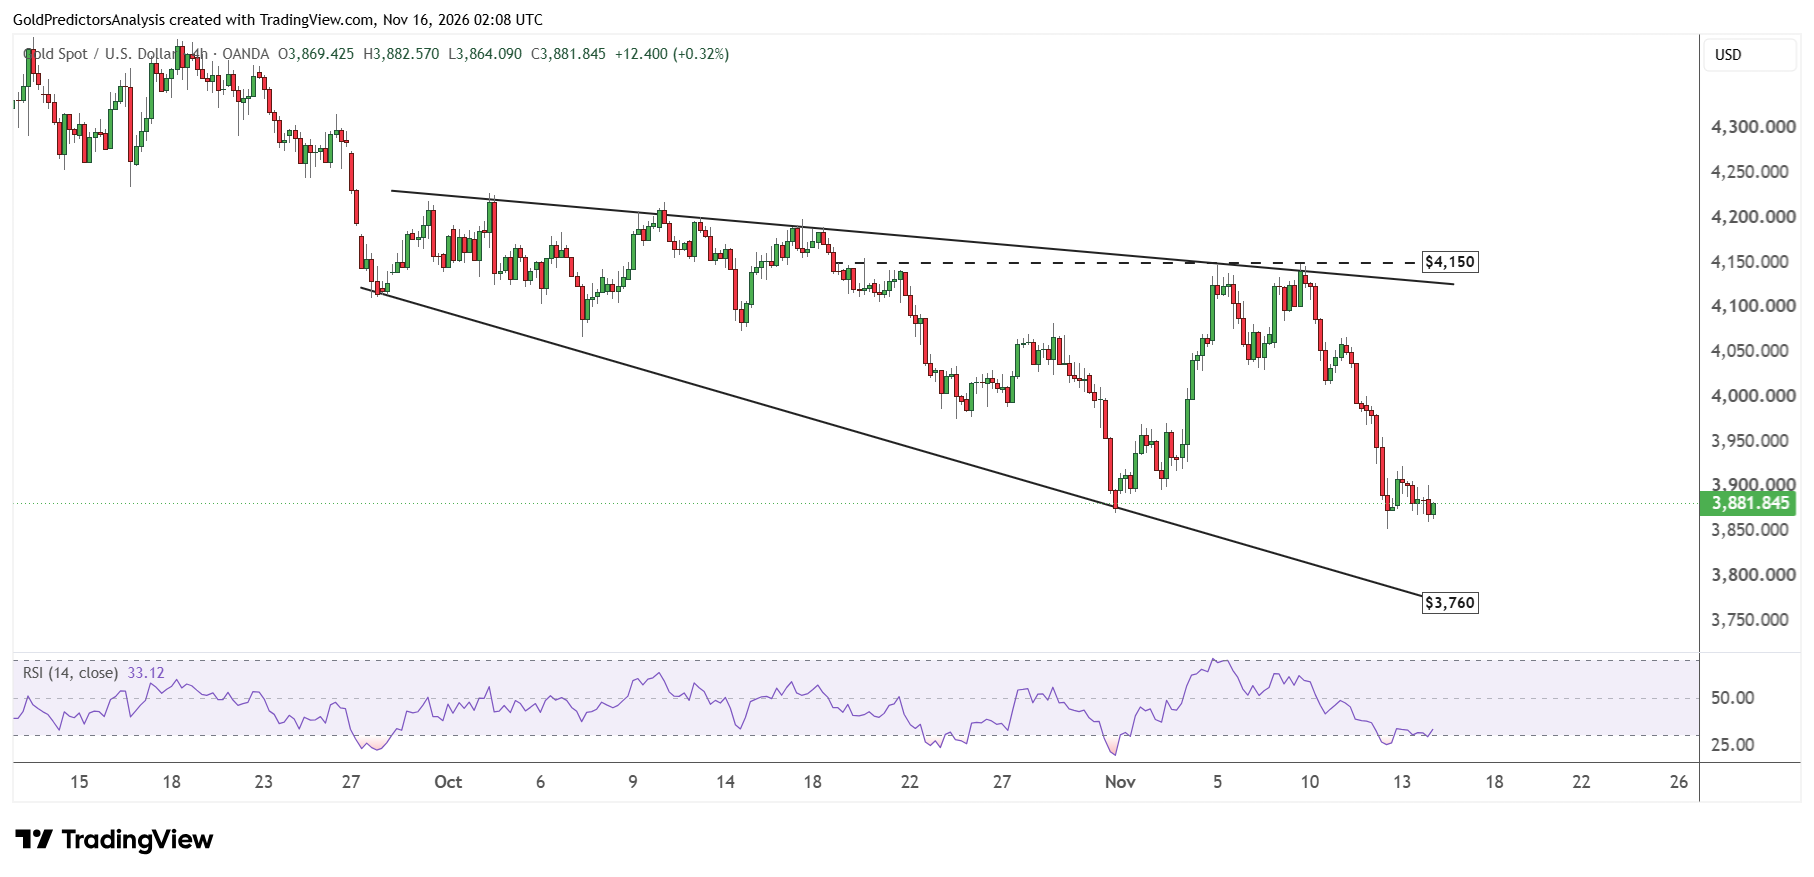
The 4-hour chart for spot gold shows heavy volatility in the short term. The price is forming the broadening wedge pattern. This wedge pattern suggests that the immediate support for spot gold remains at $3,760. But the strong resistance lies near $4,150. A break above $4,150 is required to push prices higher.
Gold Price Forecast
Every new Gold analysis as it publishes, today's technical signal and key levels, live price — on one page.
See all Gold forecastsSilver Price Forecast: Can $45 Stop the Sell-Off
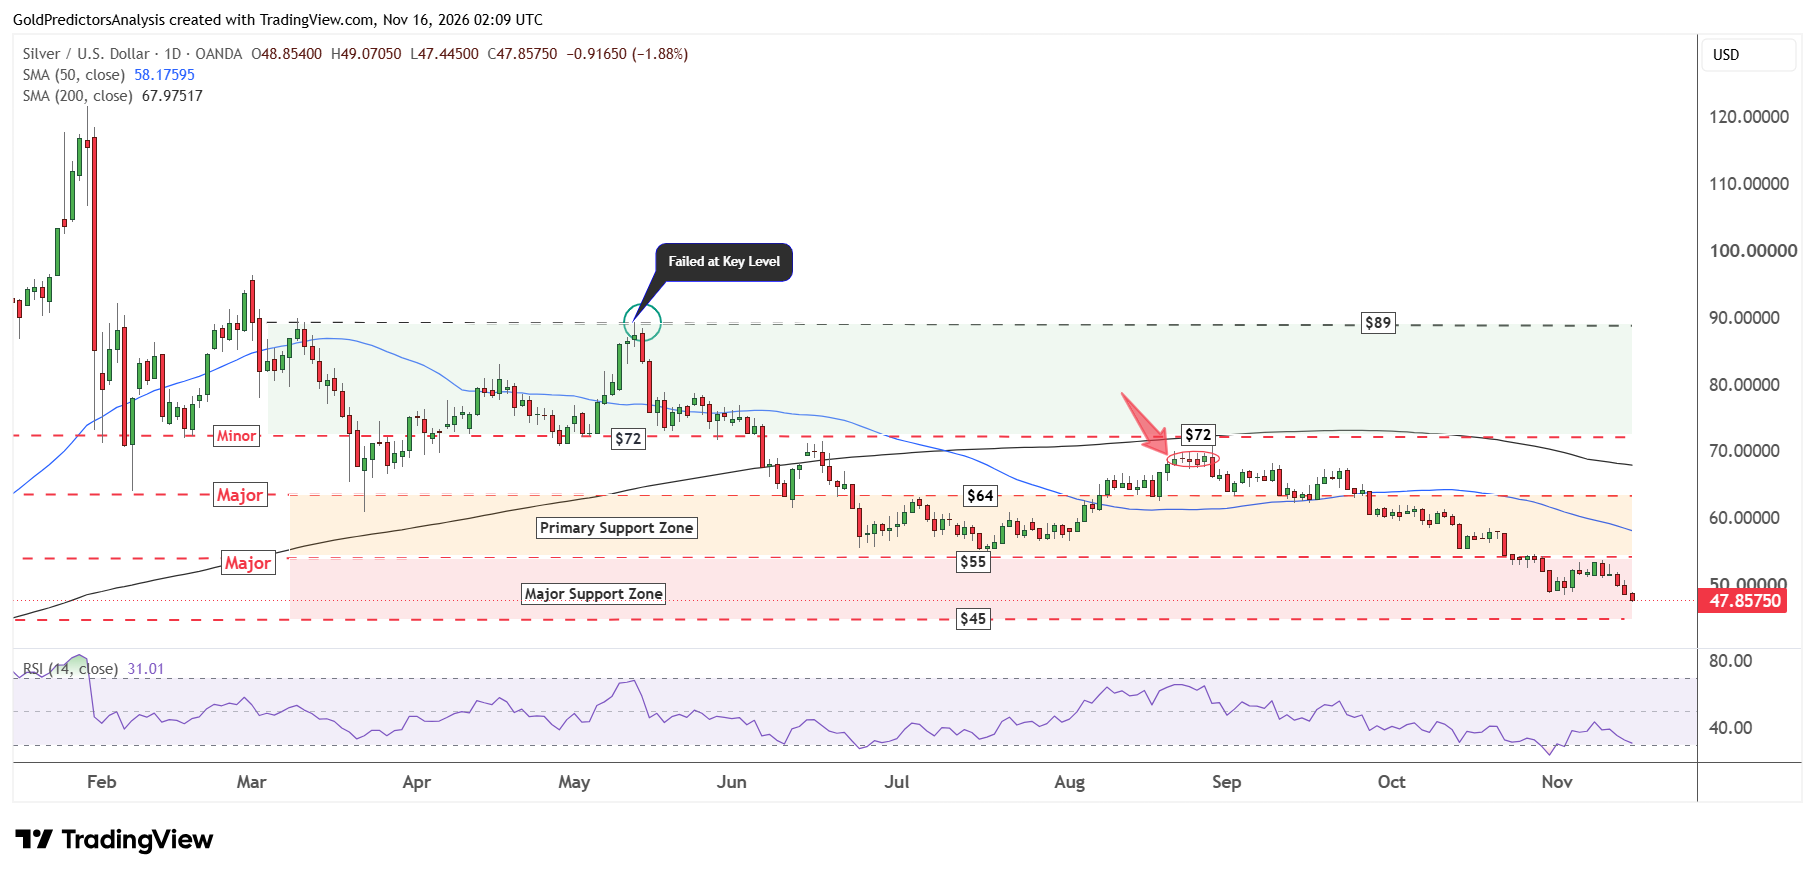
The daily chart for spot silver shows that price remains under pressure after breaking below $55. The price range between the $45 level and the $55 level is considered the major support zone.
The price is now moving quickly towards $45. A break above $55 is required to push prices higher towards $64. But a break below $45 may open the way for further downside towards $40.
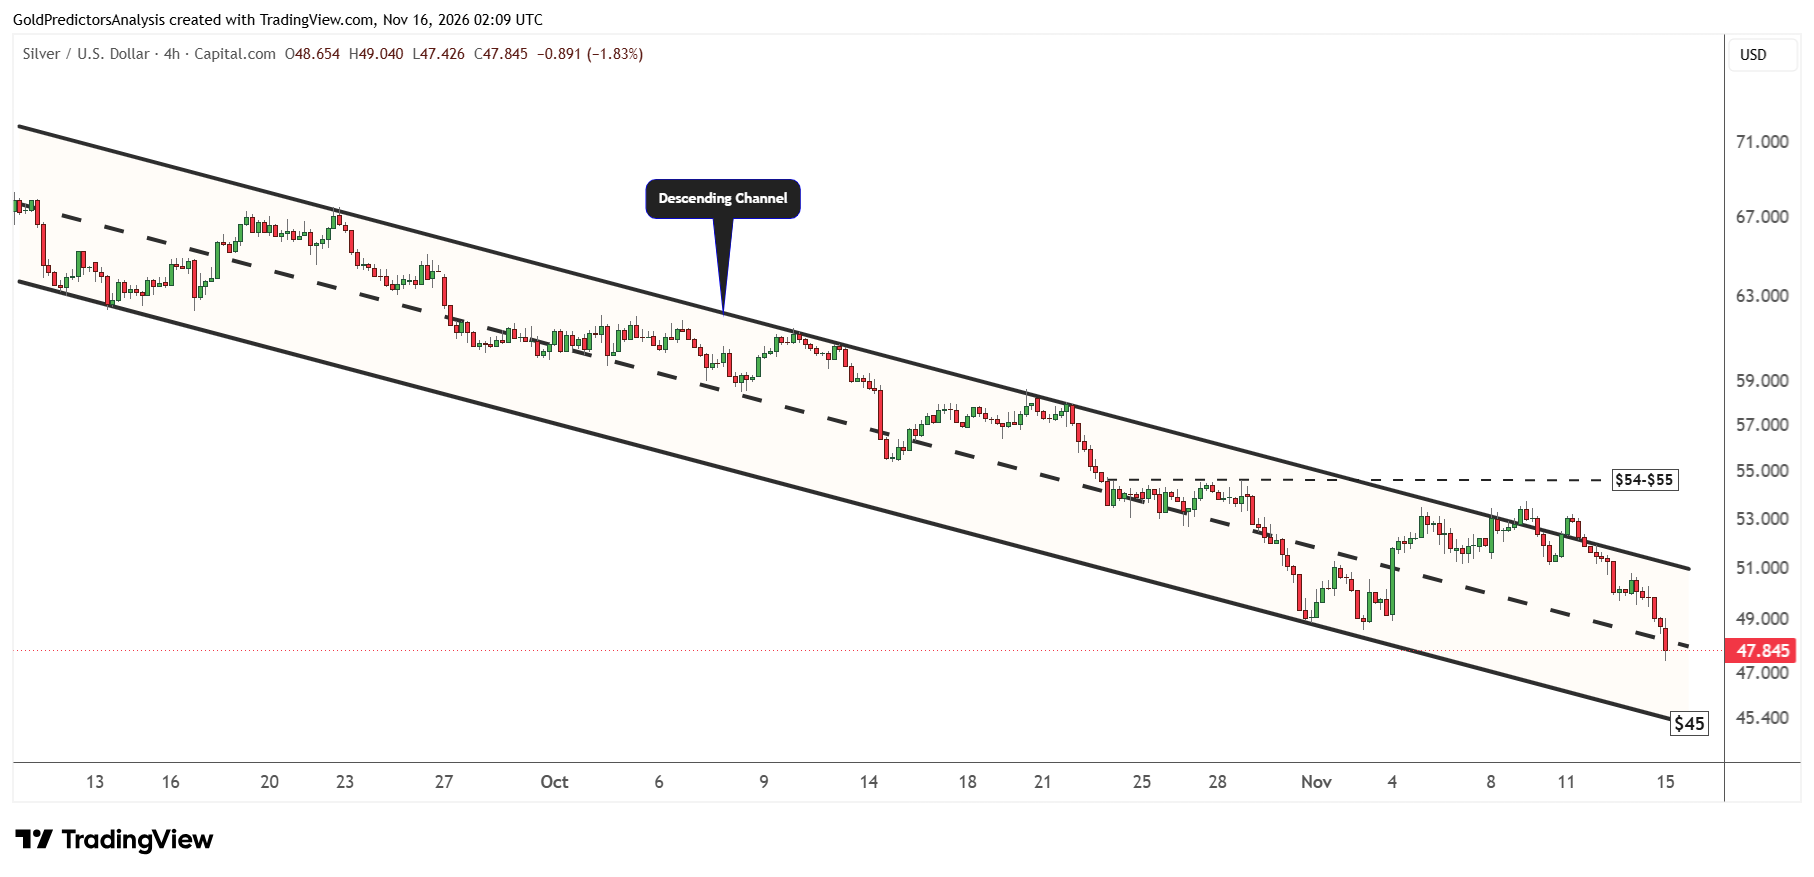
The 4-hour chart for spot silver shows the formation of descending channel from the highs of September 2026. The price failed to break above $55 and is now moving towards the lower boundary of this descending channel near $45. If the price reaches $45, it may create rebound towards $50.
Gold-to-Silver Ratio Breaks 80 as Silver Falls Faster Than Gold
Silver prices are facing more pressure than gold prices because silver is considered the industrial metal. The high interest rate environment is increasing the costs of borrowing for major industries, which may affect industrial demand for silver. Last week, gold prices dropped 4.57% while silver prices dropped 6.10%.
The strong bearish momentum in silver prices is pushing the gold to silver ratio above 80. The ratio is now moving towards resistance near 83-84. This resistance is seen by the ascending channel that has been broken previously. Historically, the major bottoms in gold and silver prices have coincided with major peaks in the gold to silver ratio.
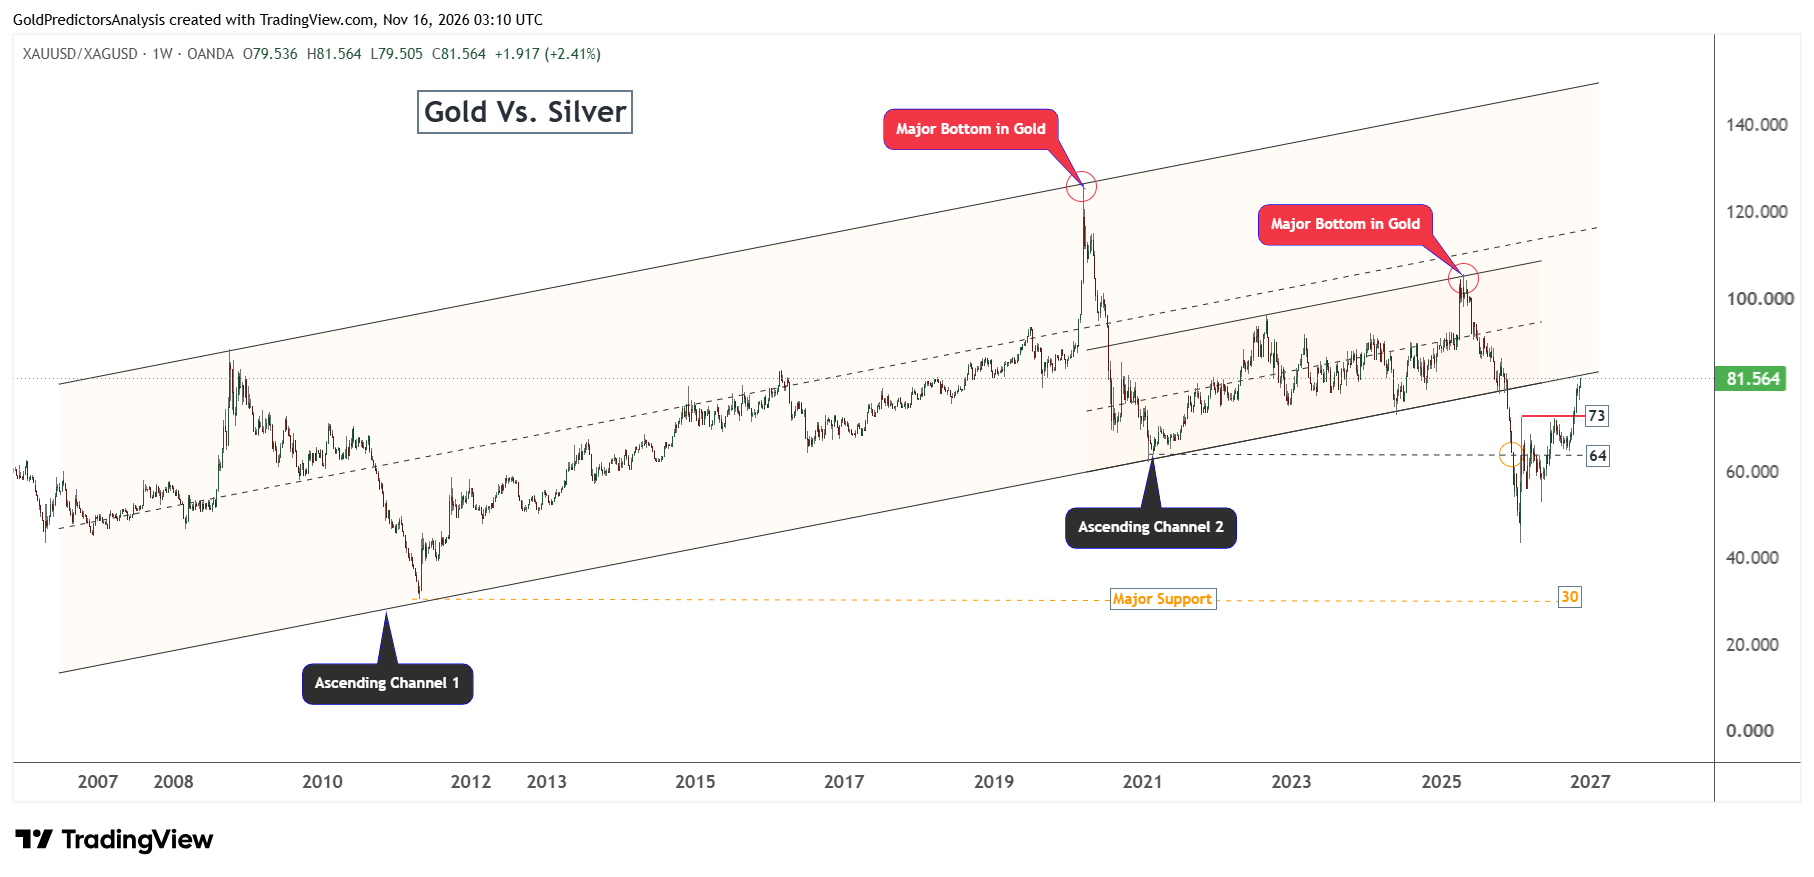
The record highs of $5,600 for gold and $120 for silver formed when the gold to silver ratio dropped to near the low of 43 in January 2026. If the ratio peaks again, it may coincide with the bottom in both metals to start the rally in metals.
Bottom Line
The rebound in gold prices looks weak as the US Treasury yields remain high. If the remarks from Kevin Warsh continue to push US Treasury yields high this week, the gold and silver prices may continue to drop further towards $3,800 and $45 respectively. A break below $3,760 in spot gold may open the way for further downside towards the $3,500-$3,600. Gold price needs to clear the $4,150 level to confirm that the selloff may be ending.
Silver price may face more pressure as long as the precious metals remain in a downtrend, as the high cost of borrowing weighs on industrial demand. A break below $48 may push the silver price to $45. If the silver price continues to drop below $44-$45, it may trigger deeper correction to $40. The next peak in the gold-to-silver ratio may support the next bottom in gold and silver prices.