


Silver (XAG) price lost over 6% last week and closed the week below $50. The hot inflation in US increased expectations of a Fed rate hike in December and pushed the US dollar and US Treasury yields higher. The weak industrial demand also increased pressure on silver prices. This article examines the recent selloff in silver prices to understand the next move.
Why Silver Fell Below $50
Spot silver closed the week at $48.77 and lost 6.10% for the week. Strong consumer inflation increased expectations for the rate hike in December and strengthened the US dollar and US Treasury yields. The strength in US dollar pushed the silver price below $50.
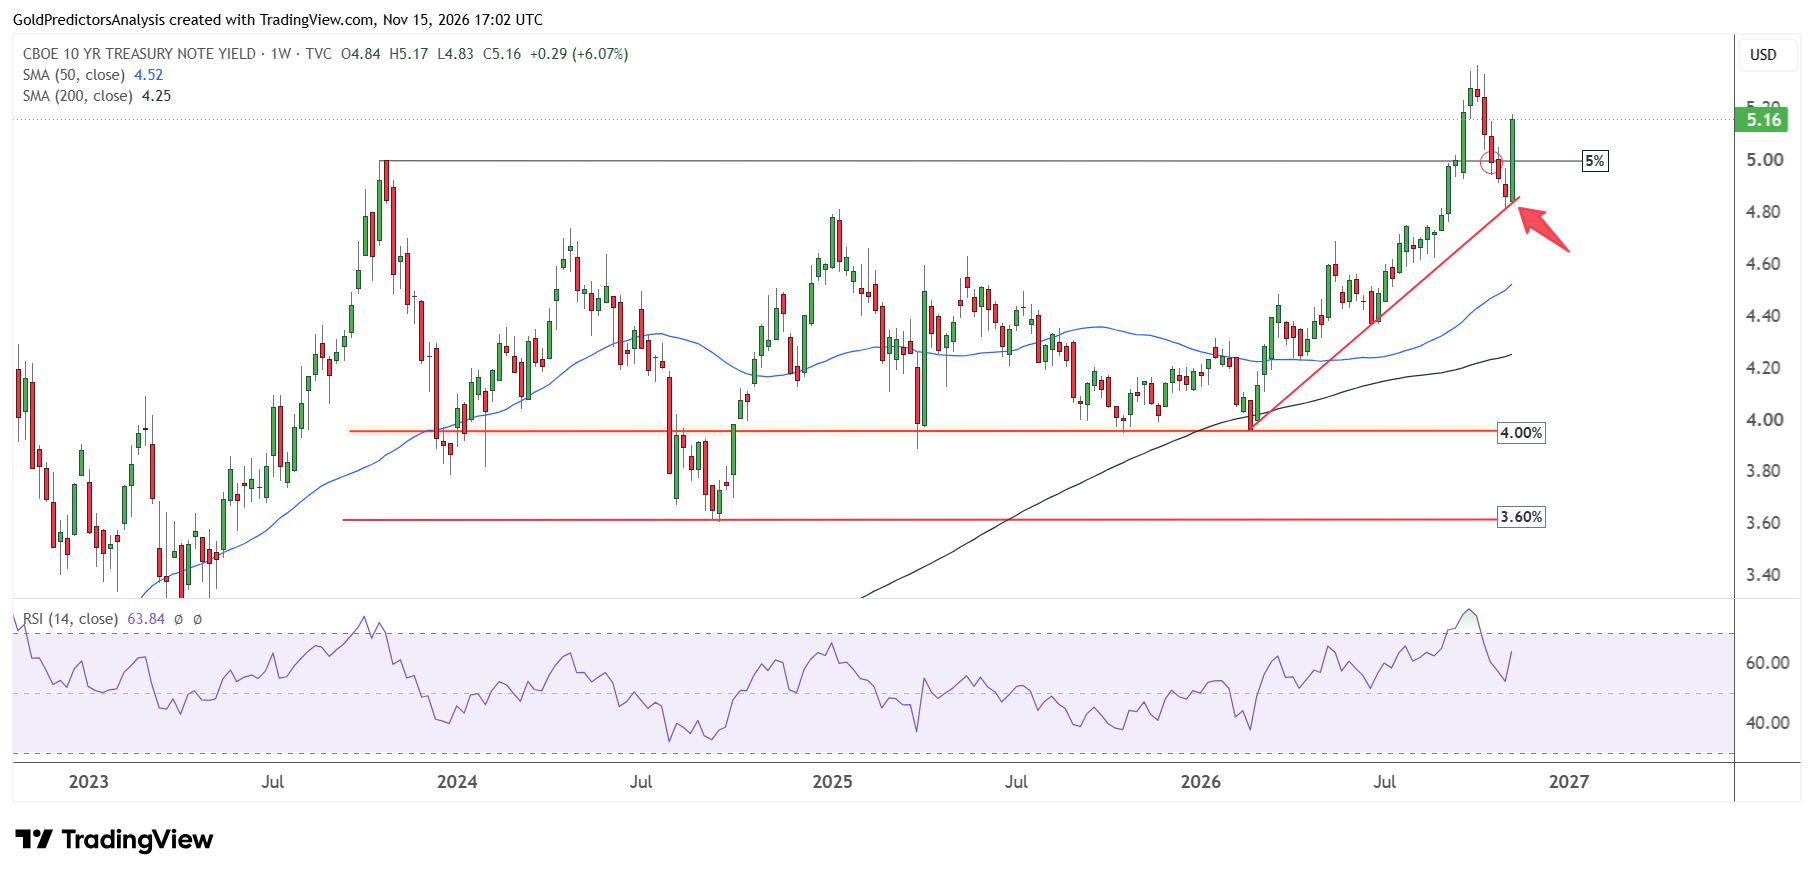
Treasury Yields Rise Above 5% as Rate Hike Bets Build
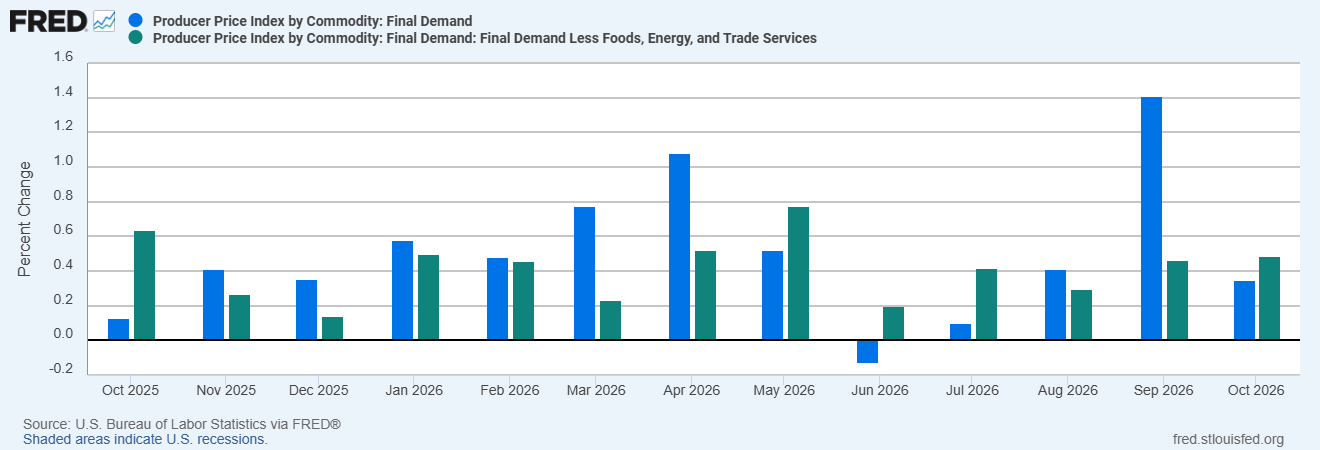
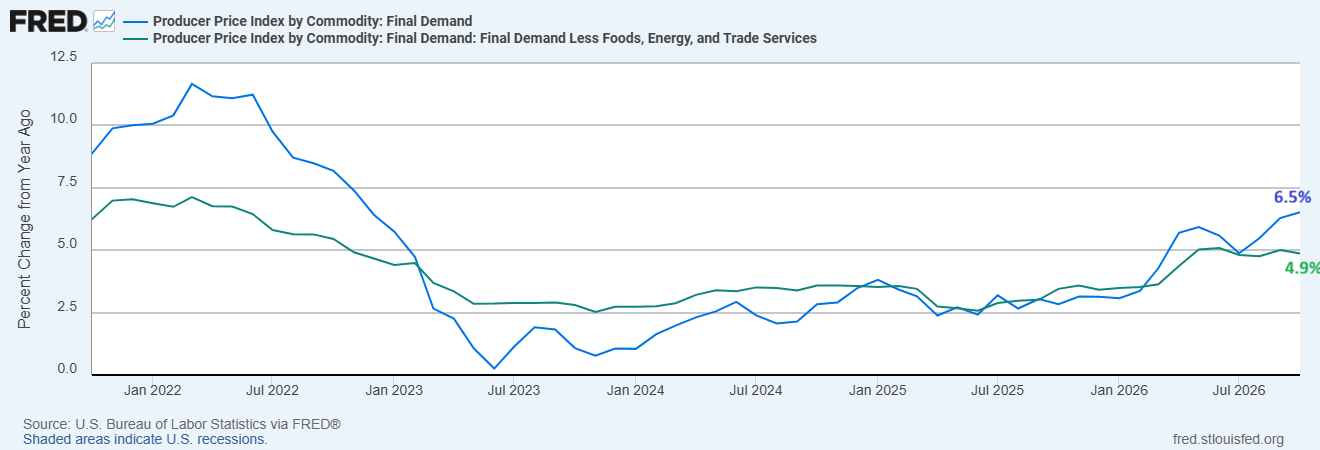
Producer prices increased 0.3% in October which is below the forecast of 0.4%. But the annual producer inflation increased to 6.5% from 6.3% which is the fastest pace in nearly four years. The market still expects an 88% chance that the Fed will raise interest rates by 25 basis points in December.
Silver Price Forecast
Every new Silver analysis as it publishes, today's technical signal and key levels, live price — on one page.
See all Silver forecastsThe 10-year Treasury yield increased to 5.16% from 4.83% last week. The inflation-adjusted yield increased to 2.91% from 2.63%. The chart below shows that the broader trend for yields remains strong in 2026.
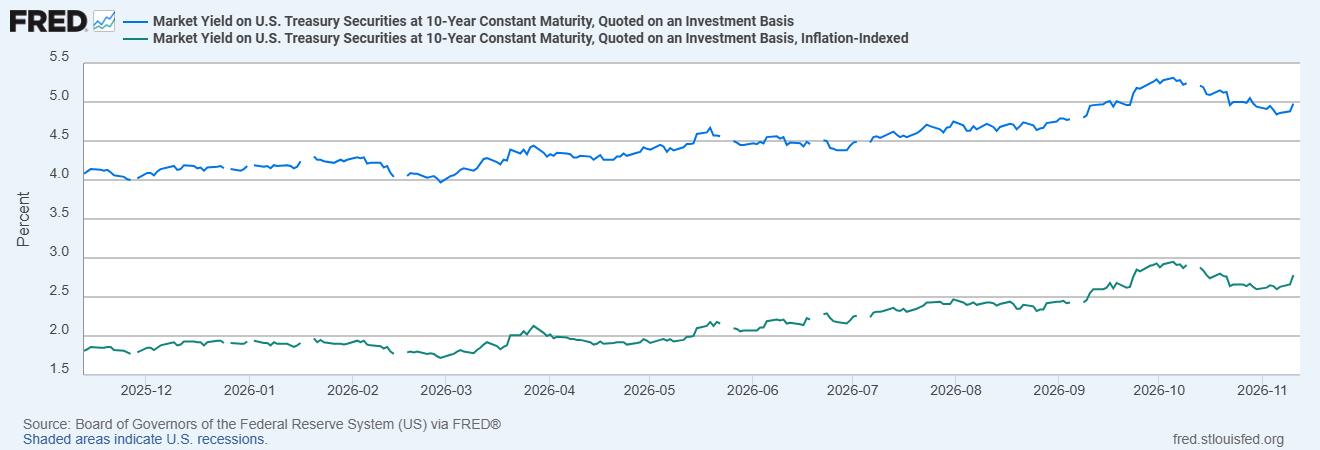
The chart below shows that the strong rally in 10-year US Treasury yields developed from the ascending trend line that stretches from the lows of February 2026. The positive weekly candle for last week suggests positive momentum that may continue into next week.
Boston Fed President Susan Collins also said that rates may need to increase further than she expected previously.
Silver Institute Expects Demand to Fall 5%
The demand for silver also looks weak. The Silver Institute expects the demand for silver to drop by 5% this year. The industrial demand is expected to drop by 3%. The solar installations in China have dropped significantly as solar manufacturers may have shifted to other substitutes due to high silver prices.
The Silver Institute expects the sixth straight annual supply deficit. The global holdings in silver-backed exchange-traded products have fallen by 55 million ounces since start of 2026. The recent drop in silver prices is due to the high interest rate environment as high energy costs are feeding into the economy. As long as real yields continue to rally, silver prices may remain under pressure.
What a Stronger US Dollar Means for Silver
US Dollar Index Faces Resistance at 106-107
The recent weakness in silver comes from the strength in US dollar index, which is now approaching key resistance areas. The monthly chart for the US dollar index shows that the index found strong support at the 96 level and created rebound. This support is visible using the ascending channel pattern that stretches from the lows of April 2011.
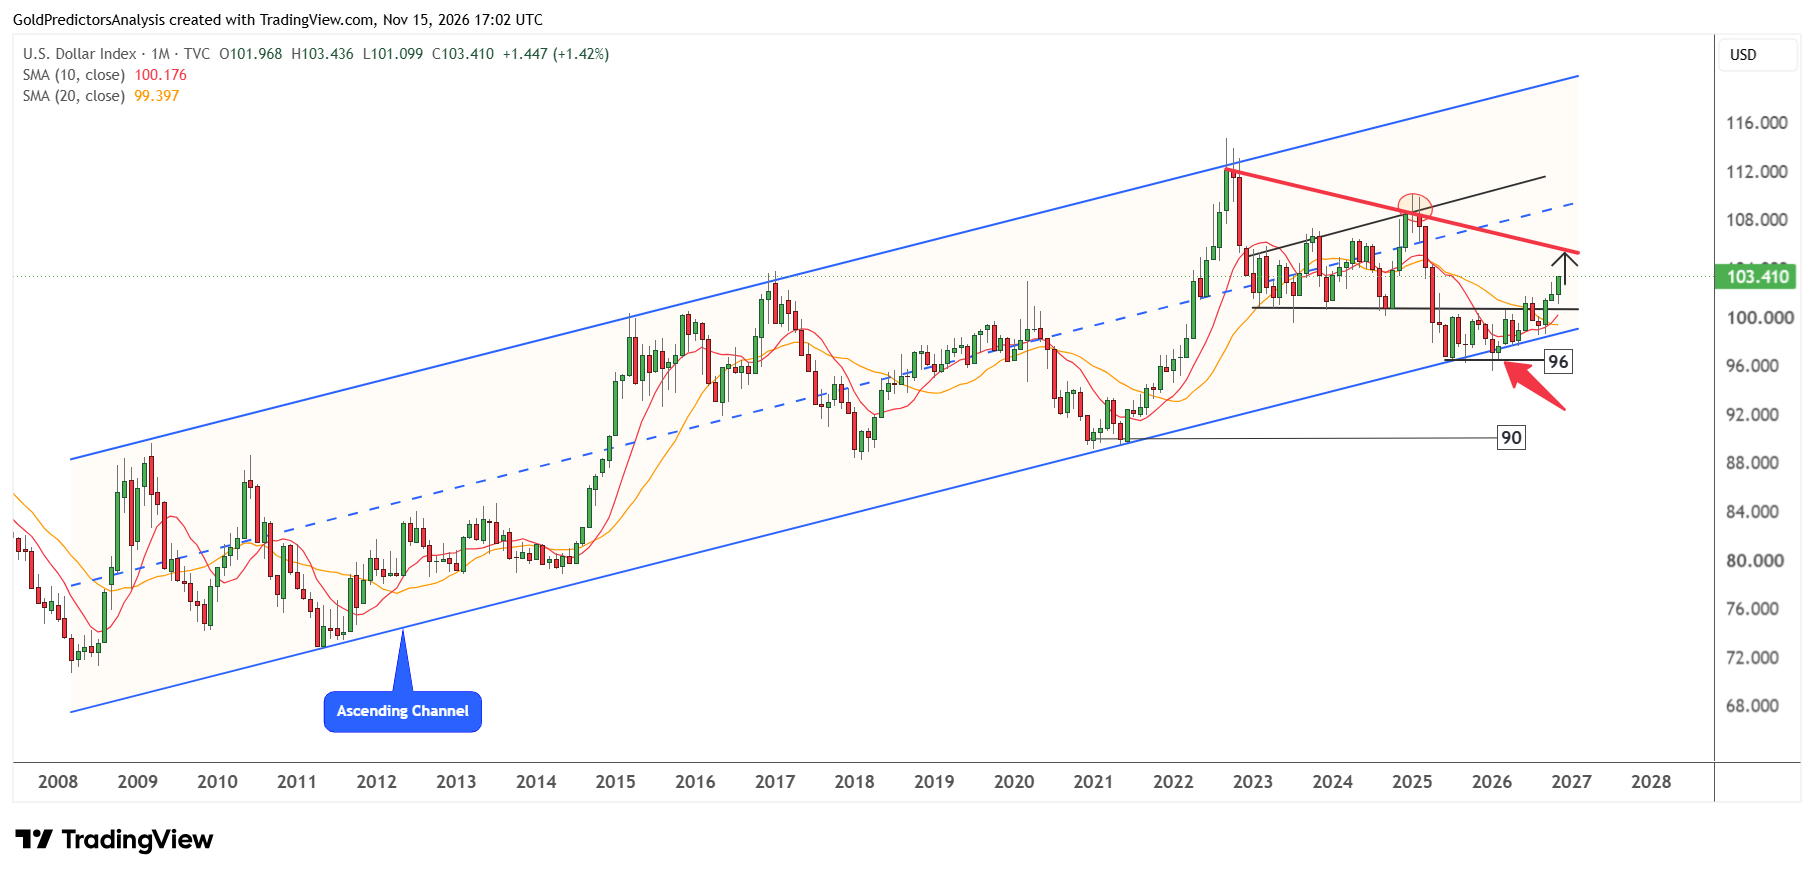
The index has now broken above the 100.50 level in September and closed above the 10- and 20-month moving averages. This suggests that the index may continue to strengthen in the short term towards the initial resistance area.
This resistance is defined by descending trend line that stretches from the highs of September 2022. This resistance lies near 106 to 107. If the US dollar index breaks above the 107 level, it will likely open the way for strong rally towards the 110 level. This breakout in the US dollar may keep silver prices under pressure for longer period.
Weekly and Daily Charts Point to More Dollar Strength
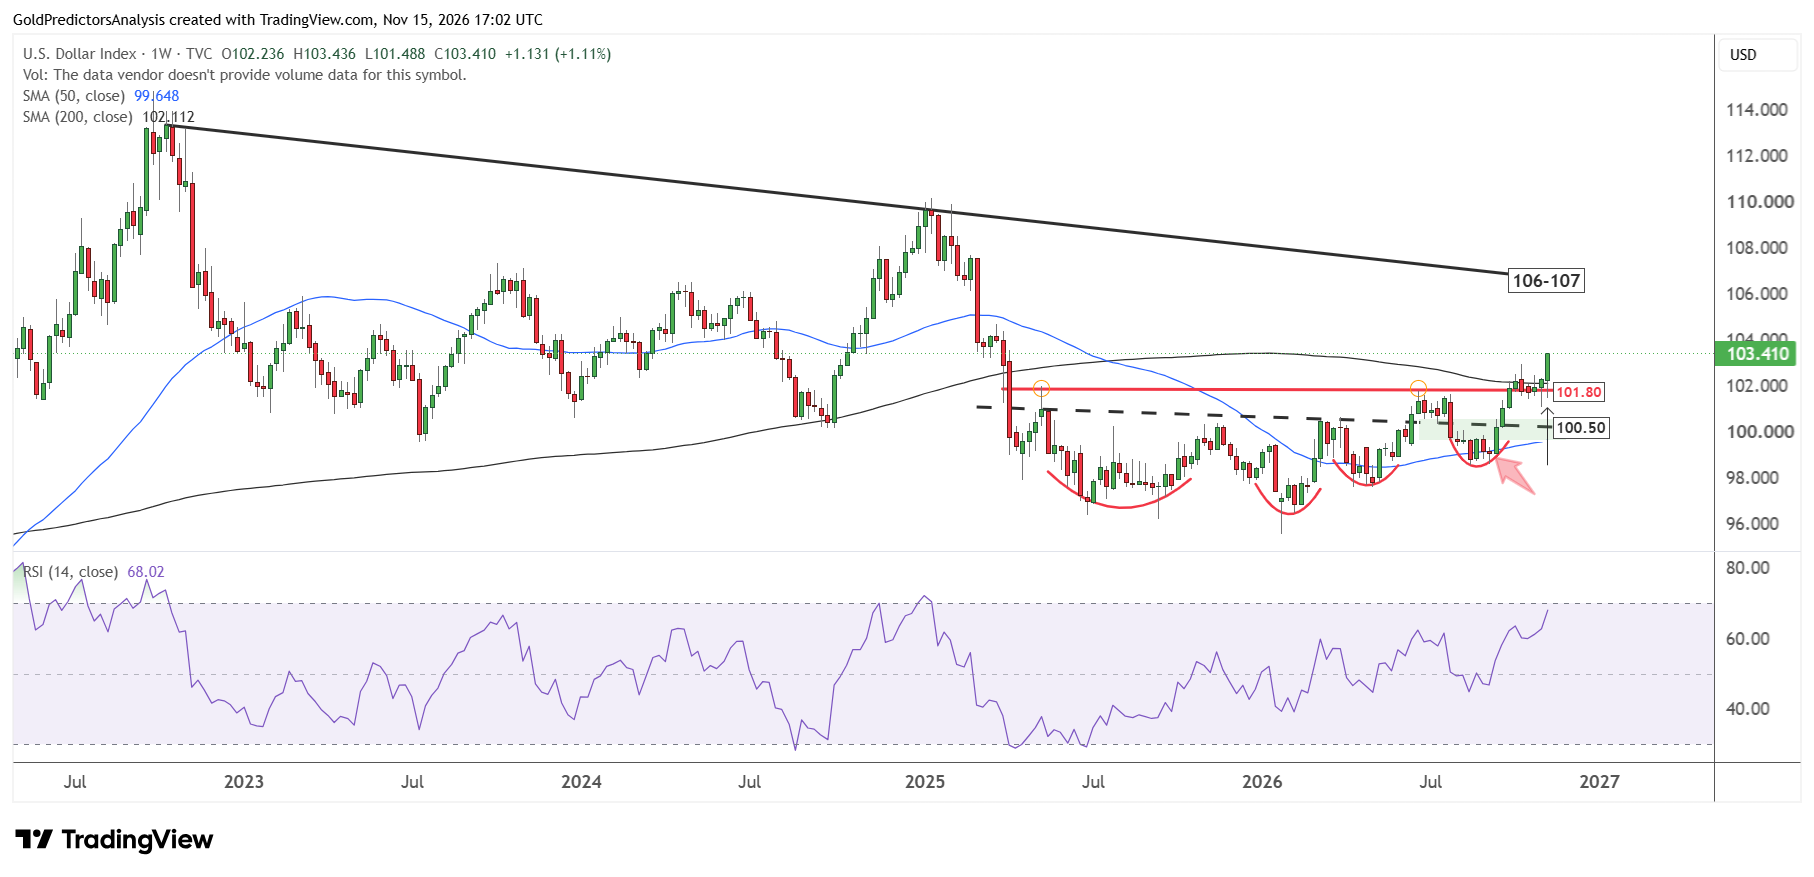
The weekly chart for the US dollar index shows constructive price action from April 2025 to October 2026. The index has already moved above the 200-week SMA and is now pushing towards the resistance at 106 to 107. The consolidation above the 96 level suggests positive price action. In my view, the index may remain strong in the short term which may keep silver prices under pressure.
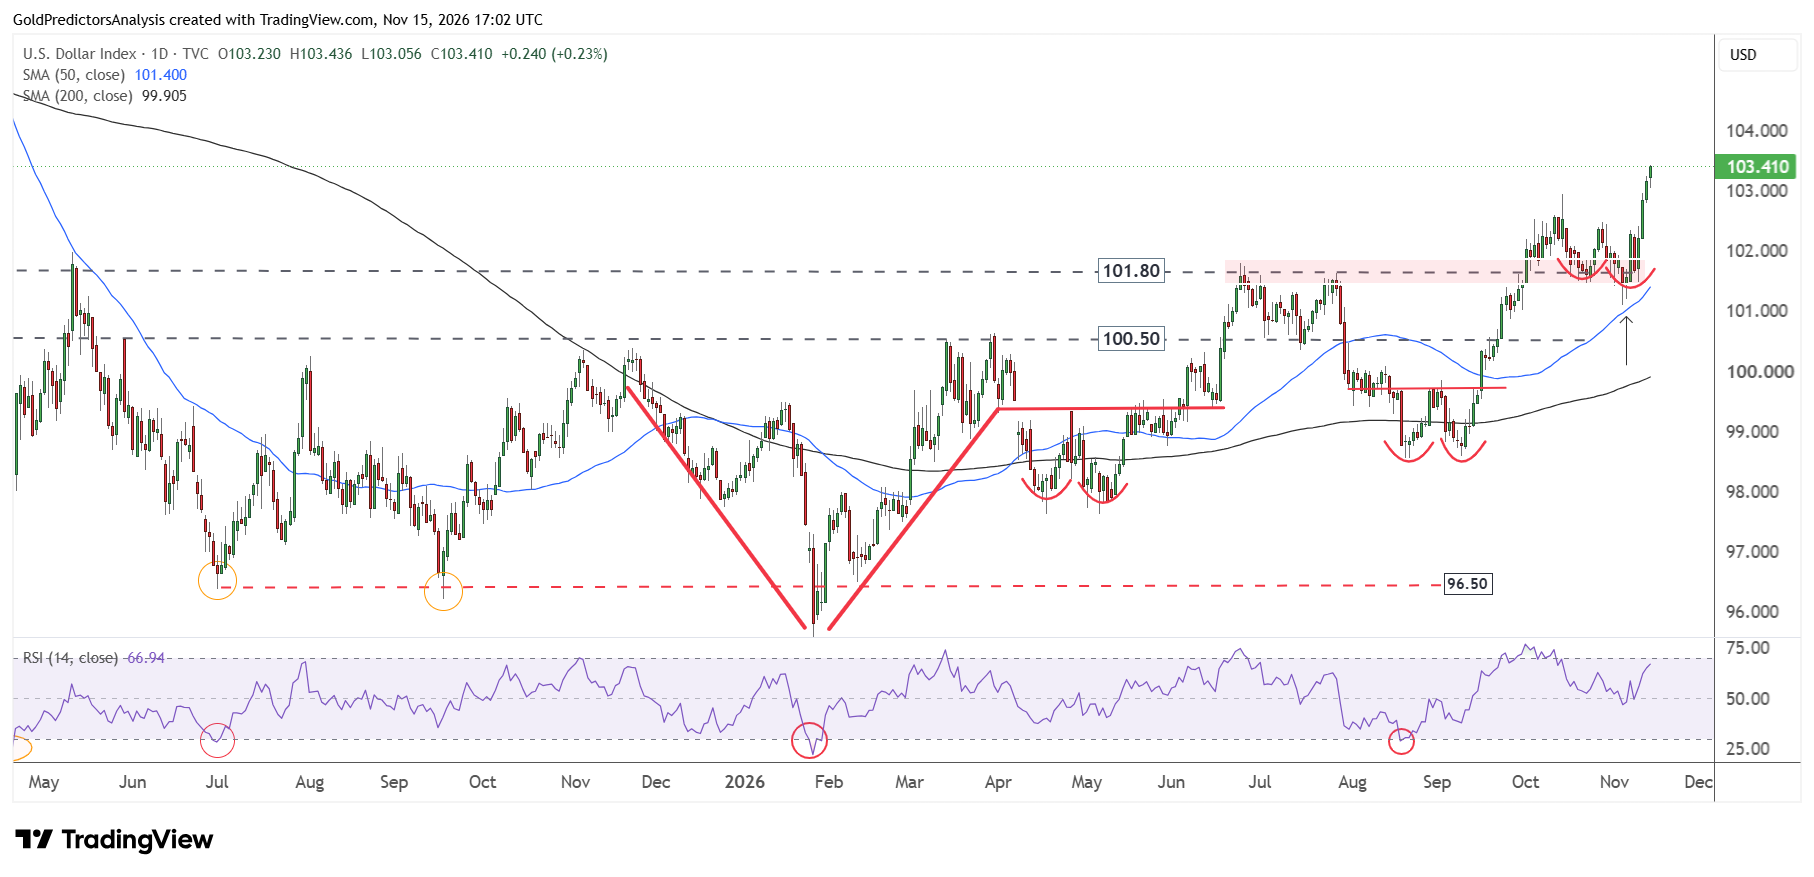
The daily chart for silver also shows constructive price action. The chart shows the formation of V-shaped pattern in February and March 2026. The chart also highlights the double bottom in April and May and then another double bottom in August and September 2026.
The index has moved above 101.80 and suggests bullish momentum in the short term. The RSI started to rebound from the midline when the US dollar index formed a low at the 101 level. This suggests that the direction for the US dollar index may remain positive in the short term.
Silver Price Forecast and Key Support Levels
From technical perspective, the silver price remains under pressure near the long term support region around $50. The price lost 9.25% in September and 18.66% in October. The price has now closed below $50 and continues the drop towards the $45 area.
Why $45 Matters for Silver’s Long-Term Trend
The highs of April 2011 define the support for 2026 at $50 while the highs of August 2011 define the support at $45. The silver price has potential for a rebound if the price remains above $44-$45. However, if the US dollar index remains strong and breaks above the 107 level, it will suggest further downside for silver prices towards the support region at $36-$37. This region is considered the area of interest for long-term investors.
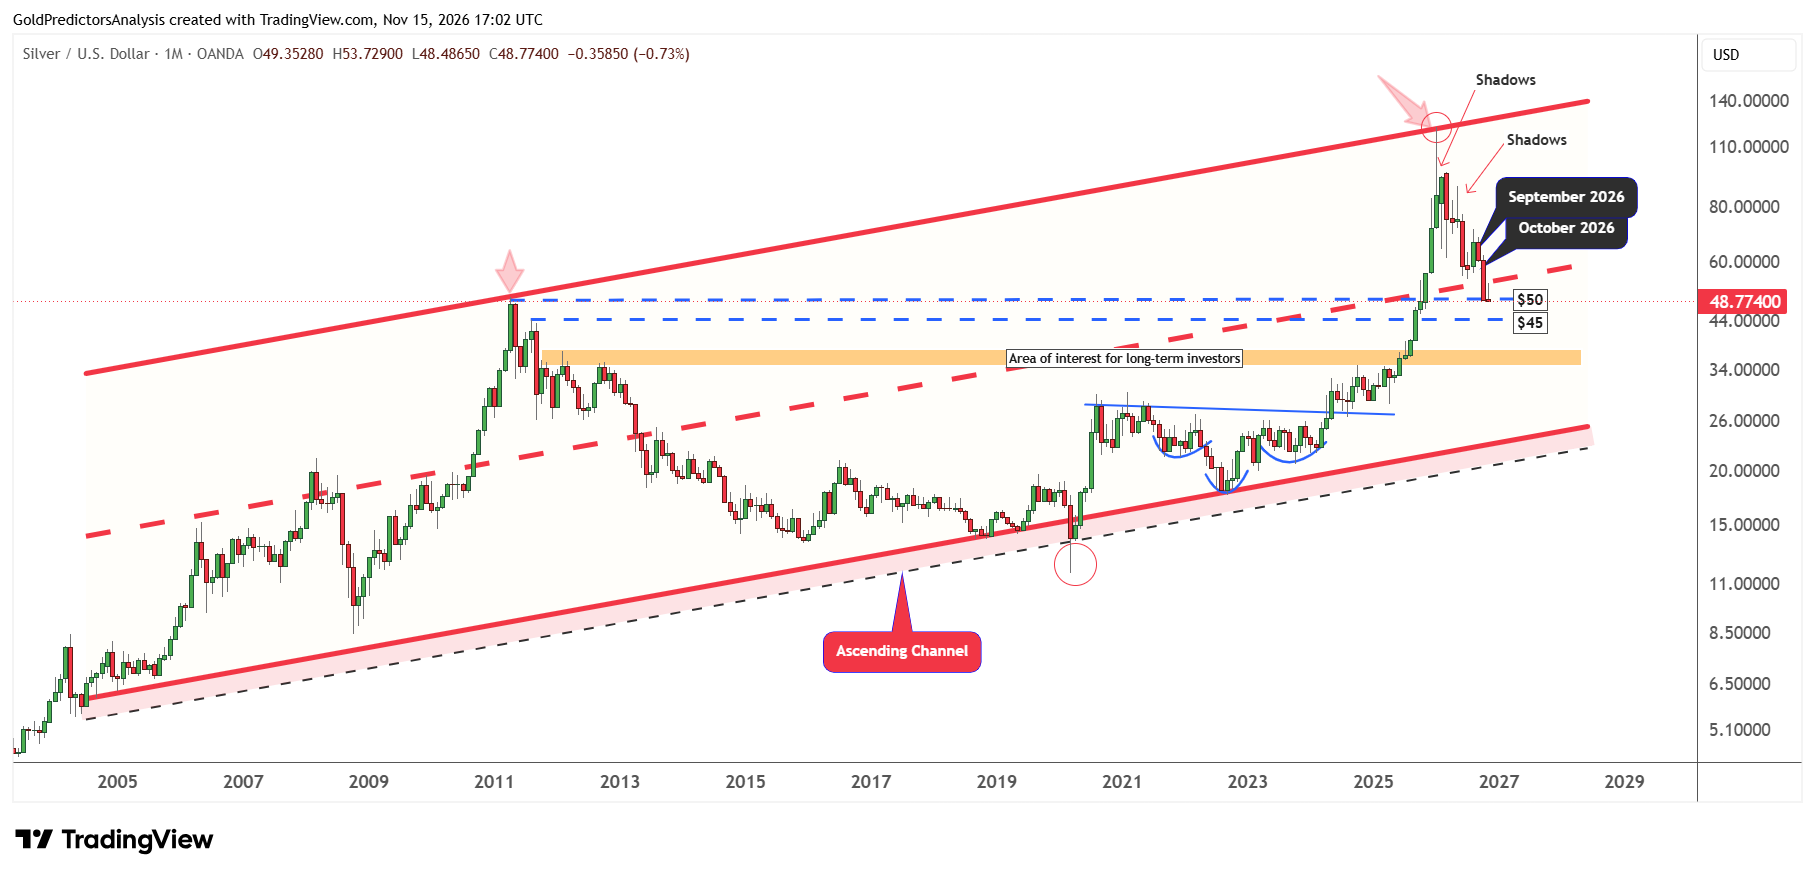
The overall price structure for silver remains bullish despite this strong drop. This bullish structure is observed on the monthly chart where the price has formed the inverted head and shoulders pattern at the support of an ascending channel.
The formation of this pattern within the ascending channel supports strong bullish outlook in the long term. This means any deeper correction in silver may attract new buyers.
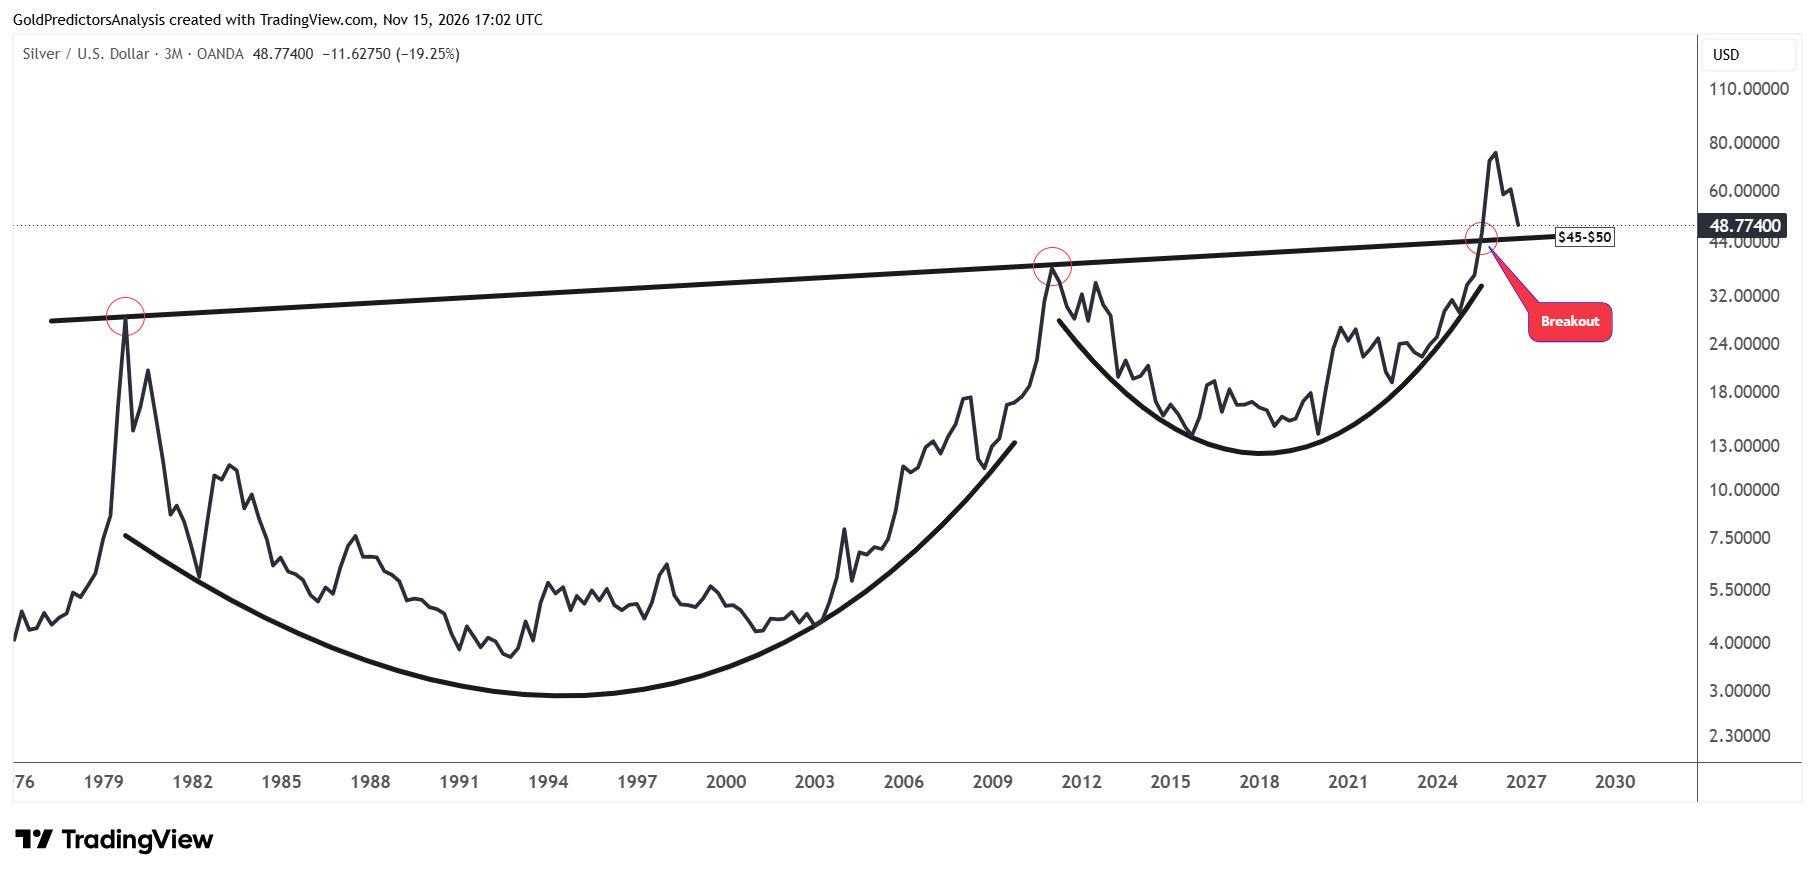
The quarterly chart also shows the importance of this support. The line chart shows that the price formed the cup and handle pattern and the neckline of this pattern stretches from the highs of October 1979 and runs through the highs of January 2011.
The price broke this neckline in July 2025 to reach the record highs near $120. The price is now approaching the neckline again near $45. Therefore, any correction towards this area may attract buyers in the silver market and make this as key support.
A Break Below $48 Could Bring $40 Into Play
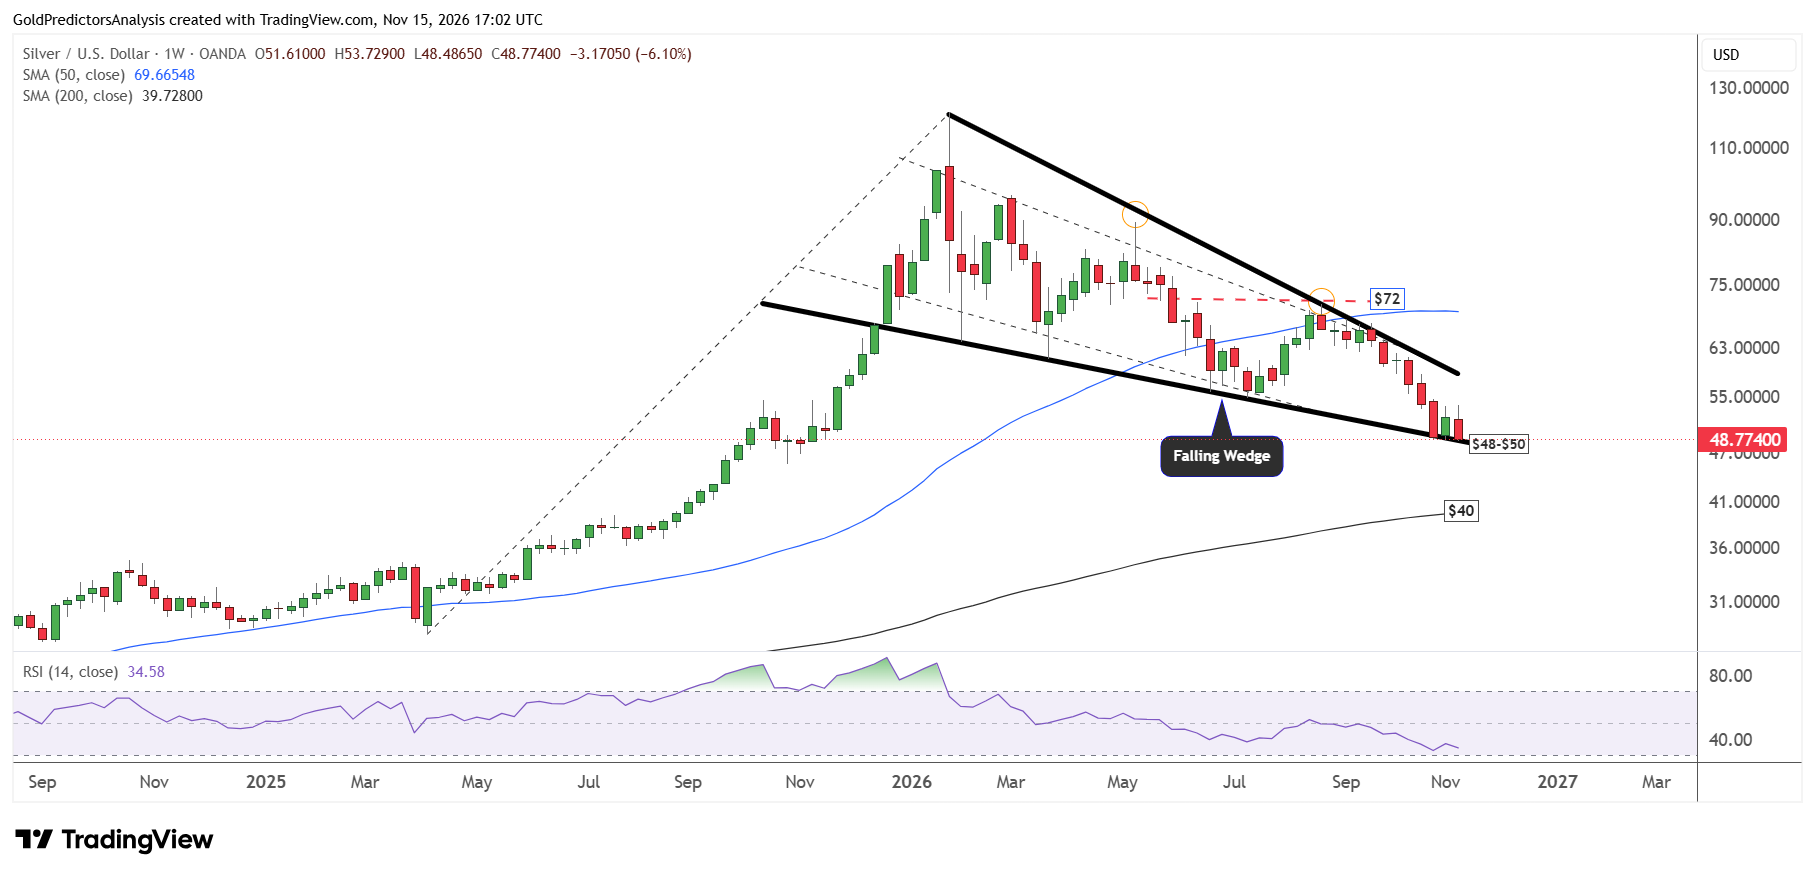
The silver price remains under bearish pressure in the short term as the price is now looking to break below the downtrend line of the falling wedge pattern at the $48 level. A break below this line will likely open the way for further drop to the $40 area.
The 200-week SMA defines this support. The RSI remains below the midline which suggests negative trend in the short term. But silver may attract strong buying interest from long-term support once this correction is over.
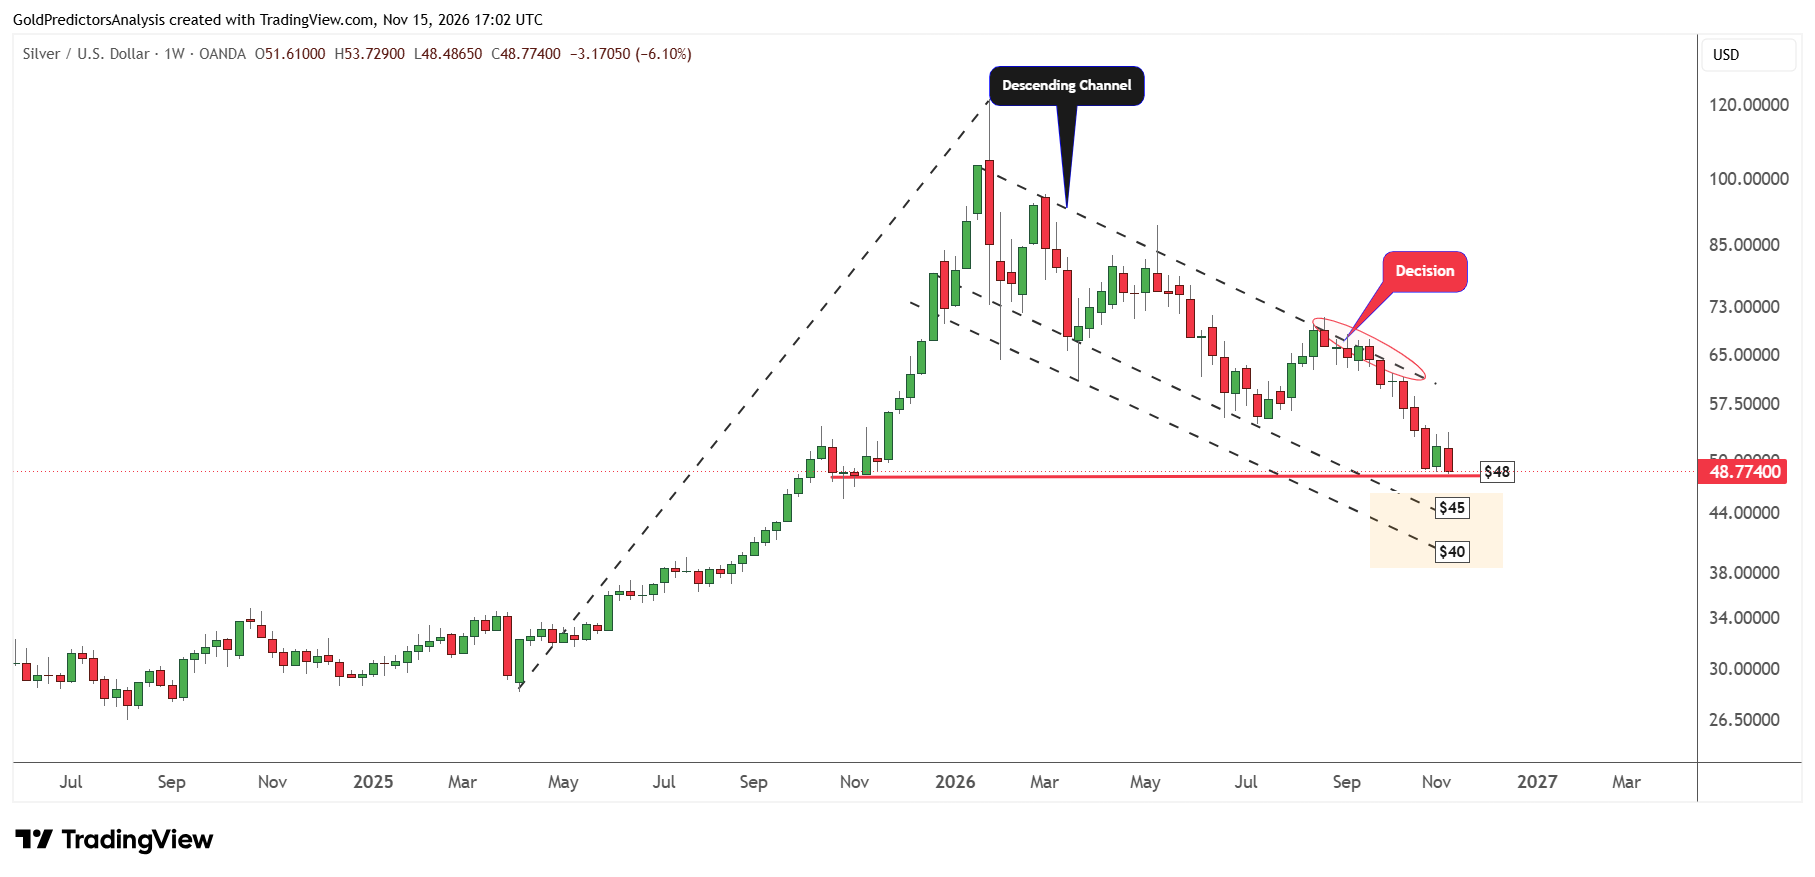
The chart below shows the lower targets in silver if the price continues to drop below the key support levels. It is observed that a break below $44-$45 may push the price towards the lower support of $40 that is defined by the descending channel pattern. This channel stretches from closing levels of January 2026.
Silver’s 2025 Breakout Is at Risk Below $50
The strong volatility in silver prices can be observed on the silver price chart using the linear scale. The monthly chart for silver shows that the $50 level is significant as it has capped rallies in silver prices in 1980 and 2011. The breakout above this level developed in 2025 which pushed prices to $120.
A monthly and yearly close below this level would increase the risk of deeper correction in silver prices. A break below $45 will put the long-term bullish outlook for silver under more pressure.
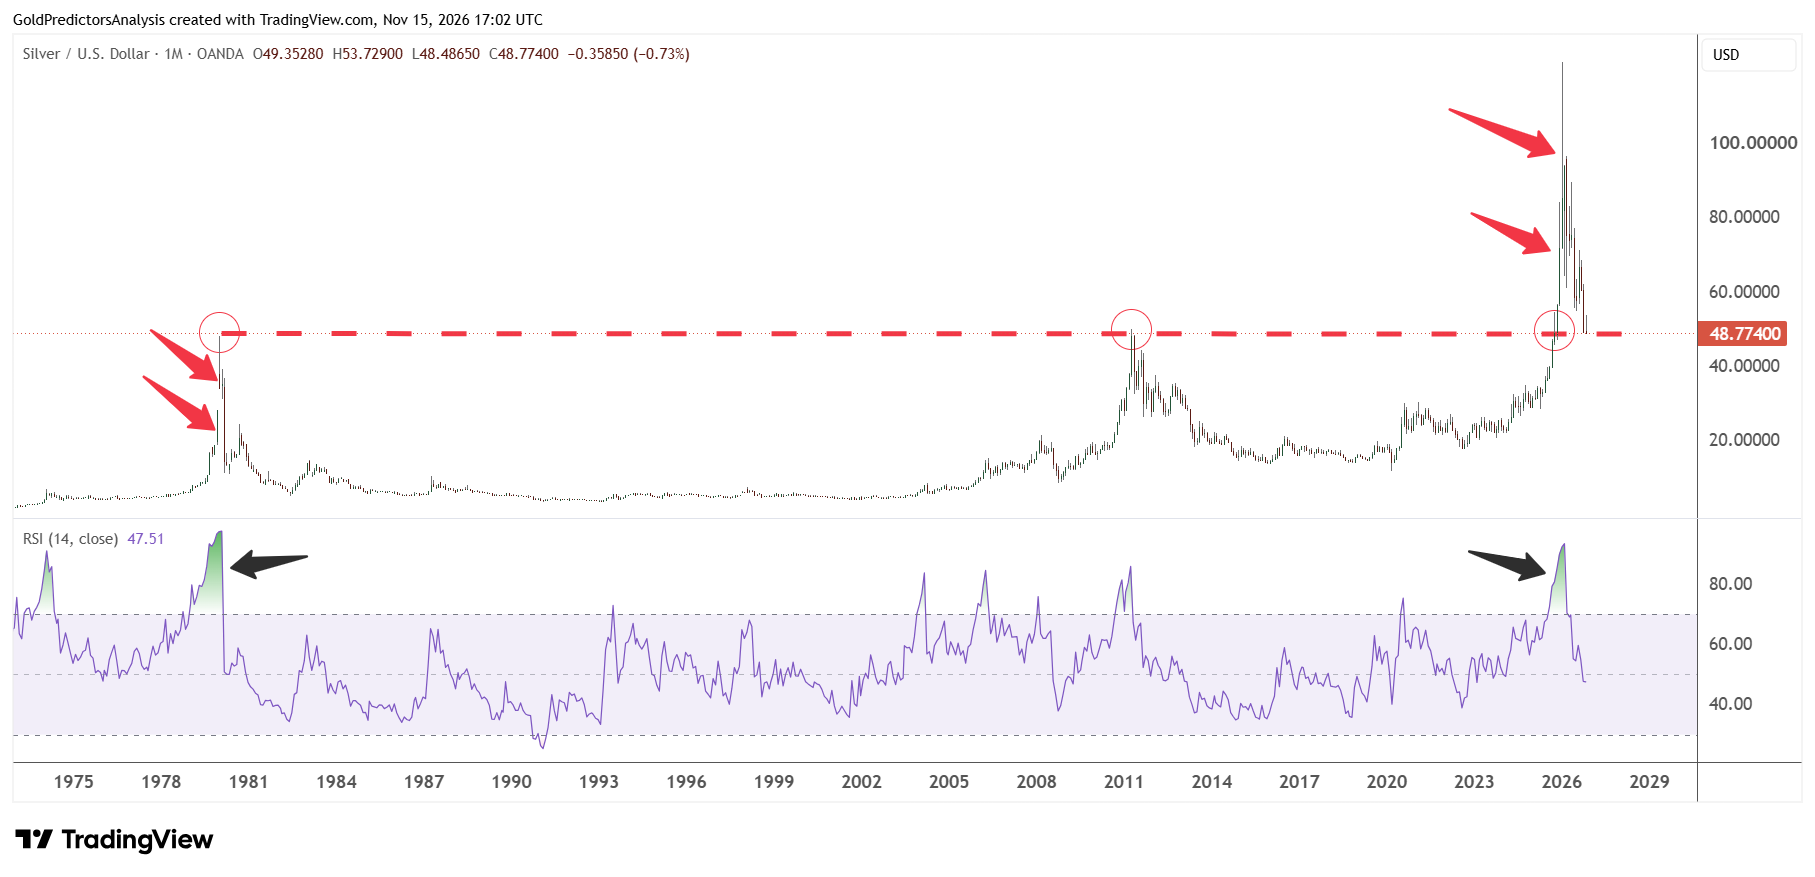
The RSI on the monthly chart has also dropped below the midline. The RSI reached the same levels in 2026 as it did in 1980. The correction in 1980 in silver prices was significant. If silver prices continue to drop below $45 and fail to close 2026 above $50, it may increase the risk of deeper correction and sideways movement into 2027.
What to Watch for Silver This Week
The strong inflation data from the US has pushed US dollar above the 102.80 level and triggered a strong rally in US Treasury yields. The positive momentum in US Treasury yields has kept silver prices under pressure. The weak industrial demand also added to that pressure.
A break below $48 in spot silver may open the way for further downside to $44-$45. A break below this level will likely push silver to $40. But if the US dollar continues to rally above the 107 level, it may increase the risk of deeper decline in silver prices toward $36-$37. The outlook for silver remains bullish in the long term and the next important support remains at $45. The price must recover above $60 to initiate the recovery in silver.
Read more: Tech Sell-Off Raises Risk of a Drop to $45 in Silver