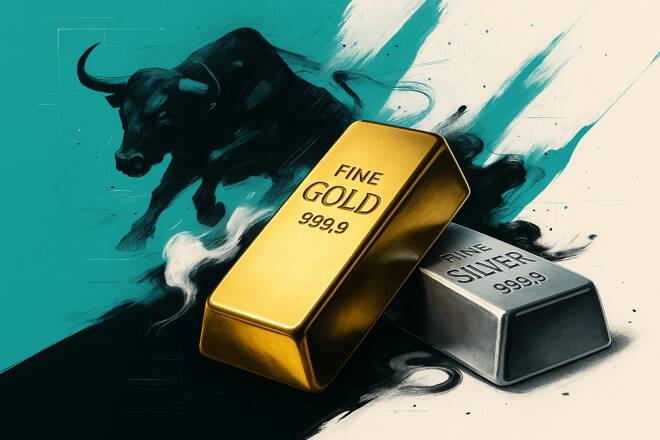
Gold (XAU) price continues to rally above $3,780 in early Asian trading on Monday. The move followed U.S. inflation data that matched expectations, keeping hopes alive for more Federal Reserve rate cuts this year. The lower rates reduce the opportunity cost of holding the non-yielding metal, adding strength to its bullish trend. Moreover, geopolitical tensions further enhance safe-haven demand, providing gold with an additional layer of support.
The focus now shifts to comments from Federal Reserve officials later today. Markets will parse remarks from Waller, Hammack, Musalem, Williams, and Bostic. If their tone turns hawkish, the U.S. dollar could rebound and pause the current short-term rally in gold. However, a dovish signal would reinforce current expectations of easing and extend the upside for the metal. This makes Fed communication a key driver of near-term direction.
The August PCE report confirmed inflation at 2.7% annually, while core PCE held steady at 2.9%. These figures aligned with forecasts, suggesting the Fed has room to continue gradual cuts without stoking fresh inflation concerns. This outlook creates a favourable macro backdrop for gold, with easing policy and stable inflation working together to support further gains.
The daily chart for spot gold shows that the price has broken a bullish continuation pattern after the breakout from $3,500. This suggests that spot gold remains in a healthy bullish trend, with no apparent signs of a correction. Therefore, prices may continue to increase toward the $3,900–$4,000 region in the coming days and weeks.
The 4-hour chart for spot gold shows a breakout from the ascending channel, confirming a bullish continuation pattern. Prices broke above $3,700 and reached the $3,800 region before correcting back toward $3,700. This strong rally from $3,700 suggests that gold prices are likely to continue higher. Therefore, the short-term momentum in spot gold remains strongly bullish.
The daily chart for spot silver (XAG) shows that it has formed bullish price action above the $28.00 region and then broken higher above the $35.00 region. Prices continue to rise, producing bullish rallies and breaking new resistance levels.
Currently, the price is extremely overbought in the short term. However, the momentum remains firmly bullish, suggesting that prices could continue to rise toward the $48-$50 range. Any correction in silver prices toward the $41.00–$42.00 region would likely present a strong buying opportunity for long-term investors.
The 4-hour chart for spot silver indicates that the price has broken above the ascending broadening wedge pattern, located near the $45 area. This breakout suggests that silver prices are emerging from extreme volatility and entering a phase of parabolic surge. A breakout above the $48–$50 area would further strengthen the strong rally in silver, marking new historical record levels.
The daily chart for the USD Index shows a rebound from long-term support near the 96.50 level, reaching the resistance of the bear-flag pattern. This rebound suggests that the index remains in a consolidation phase within a broader bearish trend. Strong resistance is located at the 100–100.50 zone, and the next move is likely to be to the downside.
The 4-hour chart for the US Dollar Index shows substantial consolidation between the 96 and 100 levels. The index recently hit immediate resistance at 98.60 and is now correcting back toward the 98 level. This consolidation does not change the overall bearish outlook. Once the range is resolved, the next move will likely be lower. However, a break above the 102 level would invalidate the negative trend and signal further upside.
If you’re interested in learning more about what drives precious metals prices, please visit our educational area.
Muhammad Umair is a finance MBA and engineering PhD. As a seasoned financial analyst specializing in currencies and precious metals, he combines his multidisciplinary academic background to deliver a data-driven, contrarian perspective. As founder of Gold Predictors, he leads a team providing advanced market analytics, quantitative research, and refined precious metals trading strategies.