


Gold has fallen rather significantly early in the Thursday session, despite the fact that yields are falling. This can be laid at the feet of the United States reportedly pulling diplomats out of Saudi Arabia, as more attacks after the midterm elections are being whispered about.
Long-term Real Yields Continue to Drift Lower
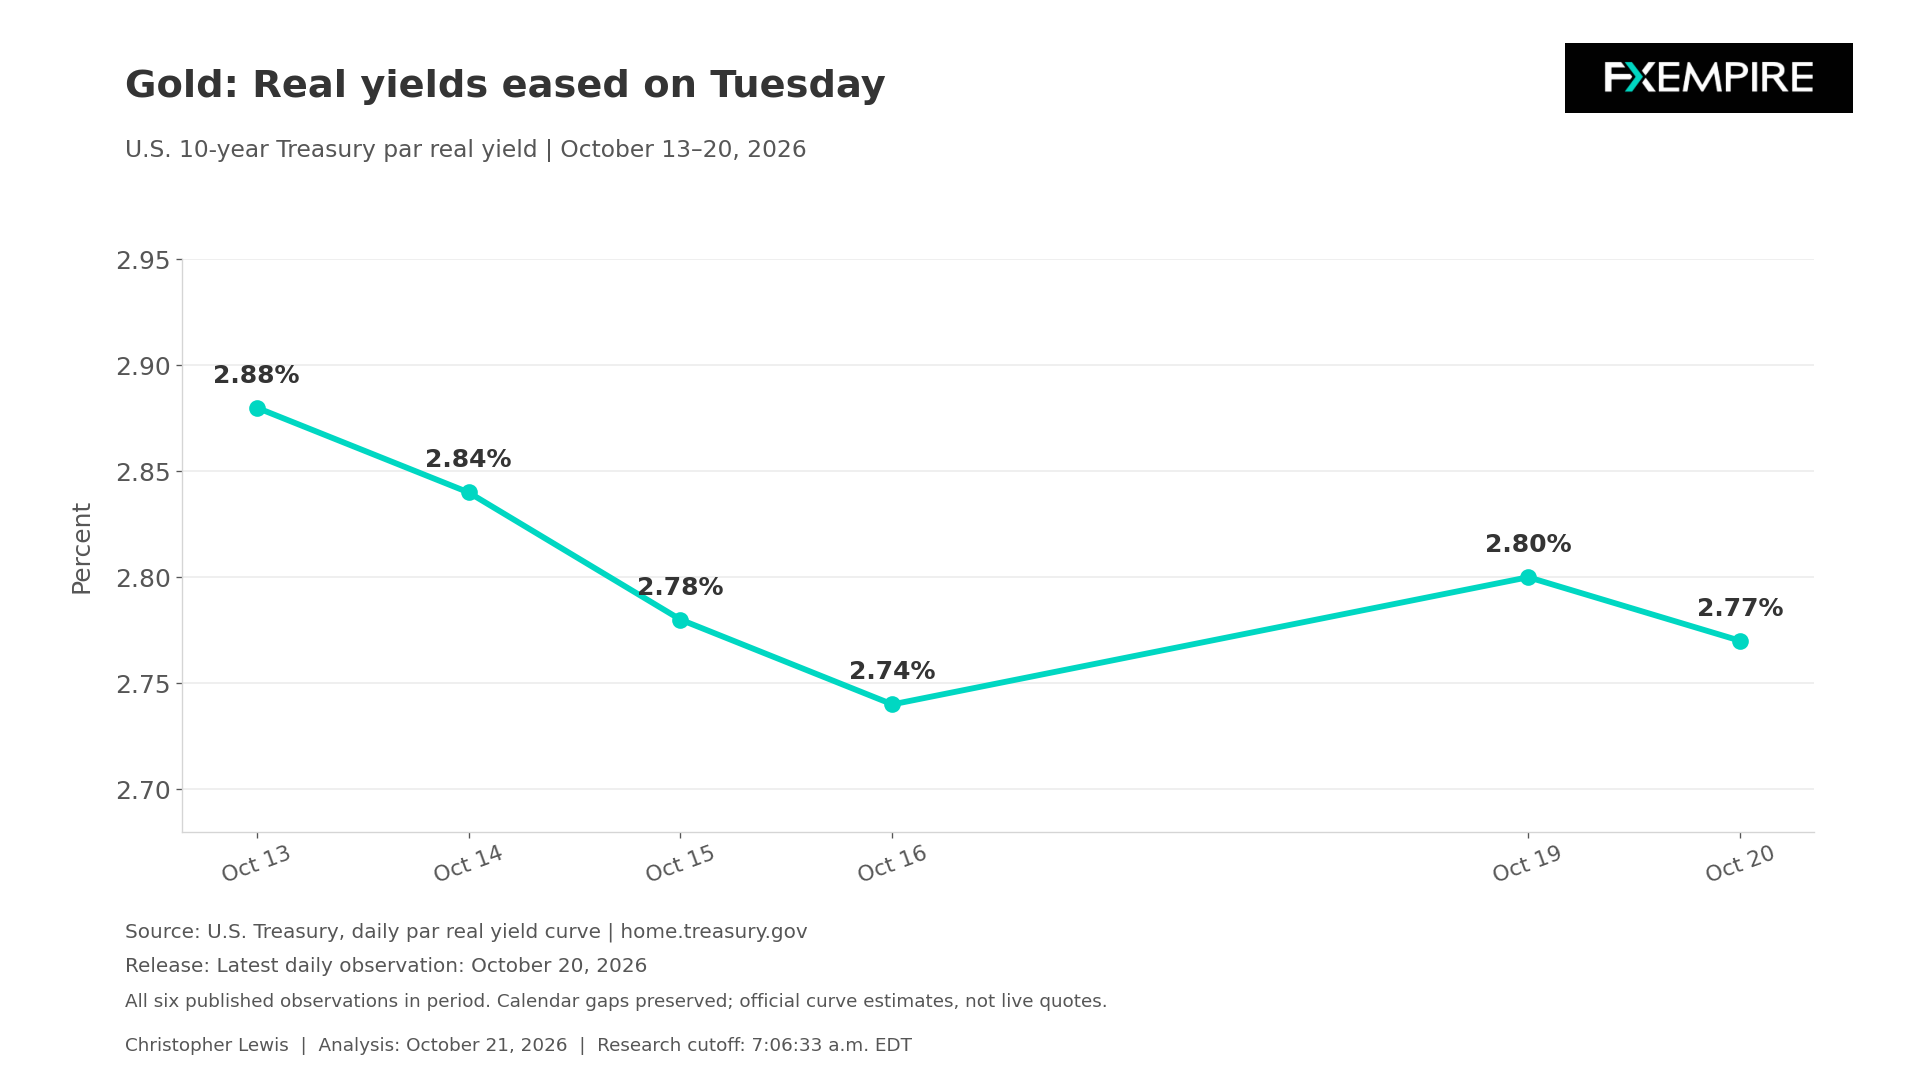
Long-term real yields in the United States have been drifting lower even before this announcement, including the 10-year real yield dropping to a reading of 2.77% from 2.88% recorded on October 13. This is typically a good signal for gold to appreciate, but it is also still historically elevated. Therefore, inflation-adjusted government returns can reduce the opportunity cost of holding an asset such as gold that has no yield. But when it is still fairly elevated, it does not have that effect quite yet.
Simply put, we are moving in the correct direction for gold bulls, but there still seems to be some way to go. That being said, the size of the drop in real yields is fairly short-duration and not big enough to declare that there is a complete change in monetary policy or the monetary environment.
Nominal Rates
Nominal rates also show why the phrase “yields fell” needs clarification. The 10-year Treasury yield declined from 5.15% to 5.12% to kick off the week, but the 2-year increased from 4.77% to 4.79%. In other words, the market has not seen a uniform easing across maturities. This combination is consistent with different pressures on near-term policy-sensitive rates and longer-term financing conditions.
Last month’s CPI rate being subtracted from the nominal yield would mix backward inflation measures with a forward-looking return. That shortcut obscures the financial signal the markets are tracking. The real yield series provides a more consistent comparison along the recent daily observation, as opposed to simply taking the nominal yield.
Gold Price Forecast
Every new Gold analysis as it publishes, today's technical signal and key levels, live price — on one page.
See all Gold forecastsTension Between Economic Resilience and Restrictive Financing
Census and HUD reported on October 20 that September housing starts were at a seasonally adjusted annual rate of 1.221 million, an estimate 5.2% below revised August. This also adds more context. The report’s uncertainty interval around that monthly change is plus or minus 11.8 percentage points, so the estimated decline was not distinguishable from zero. Housing permits were at a 1.4 million annual rate, down 0.2% monthly.
Softer rate-sensitive activity can encourage expectations of eventual policy relief, but one noisy housing estimate will not be enough to establish an economy-wide downturn. It will simply end up being yet another piece of the puzzle.
September CPI
Inflation remains the competing constraint. September CPI, released on October 14, rose 0.6% month-over-month after seasonal adjustment and 3.7% over 12 months before adjustment. Core CPI increased 0.3% monthly and 2.6% annually. The September PPI, released on October 15, increased 1.3% monthly after adjustment and 6.3% annually before adjustment.
This creates two possible outcomes for gold. Concern about purchasing power can strengthen demand for protection, while a forceful monetary response can raise the return available on competing assets. PPI increases also need not pass through to the customer. Inflation, margins, and demand affect that process.
Fed Meeting Coming Next Week
The next scheduled Federal Reserve meeting is October 27 and 28. This decision is expected to be the Federal Reserve holding, but a sustained decline in real yields combined with evidence of slowing activity could reinforce more accommodation via the Federal Reserve and therefore give a boost to gold.
The chart below tracks every published 10-year real yield observation starting October 13, with calendar gaps preserved on the graph. That being said, the situation in the Middle East seems to have taken front and center yet again, and therefore we may see continued fear in a market that remains nervous about the conflict between the Americans and the Iranians.
Technical Setup
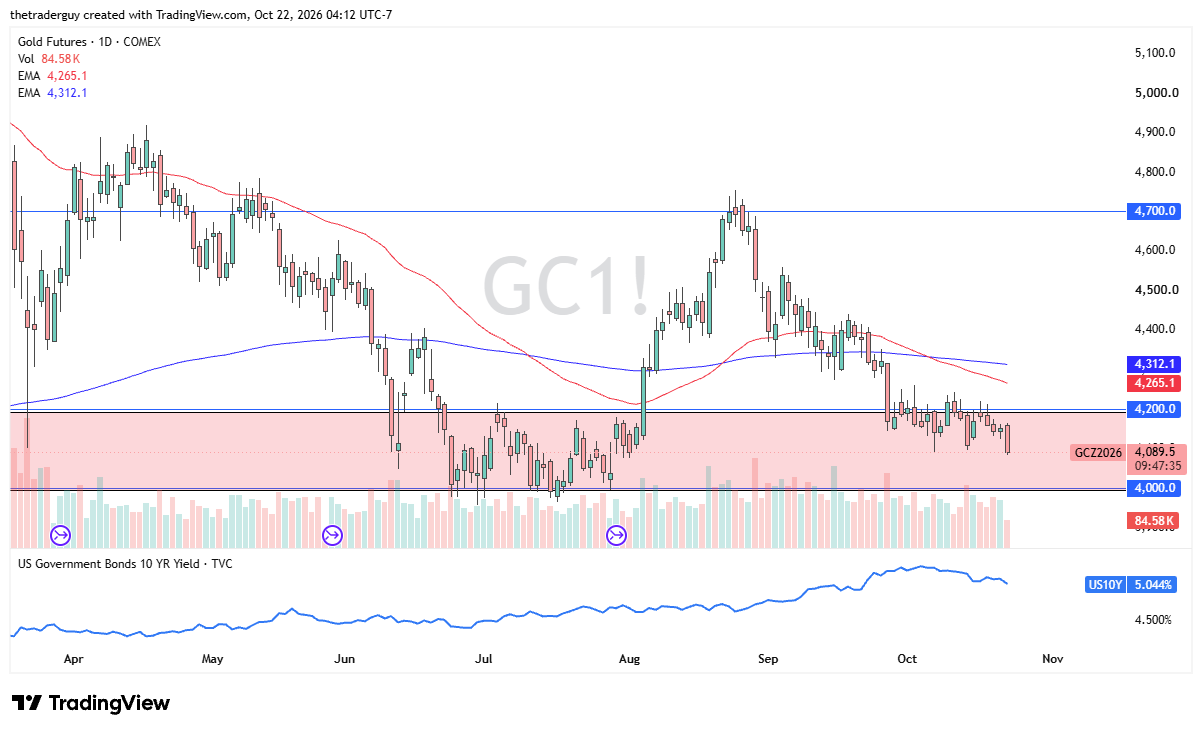
Gold is currently reacting to the bad news coming out of the Middle East. As things stand at the moment, the $4,000 level is an area that must hold if gold is going to keep any bullish attitude at all. Watching this area for a bounce is how I am looking to play the market. A move below that level would be very bearish, to say the least.