


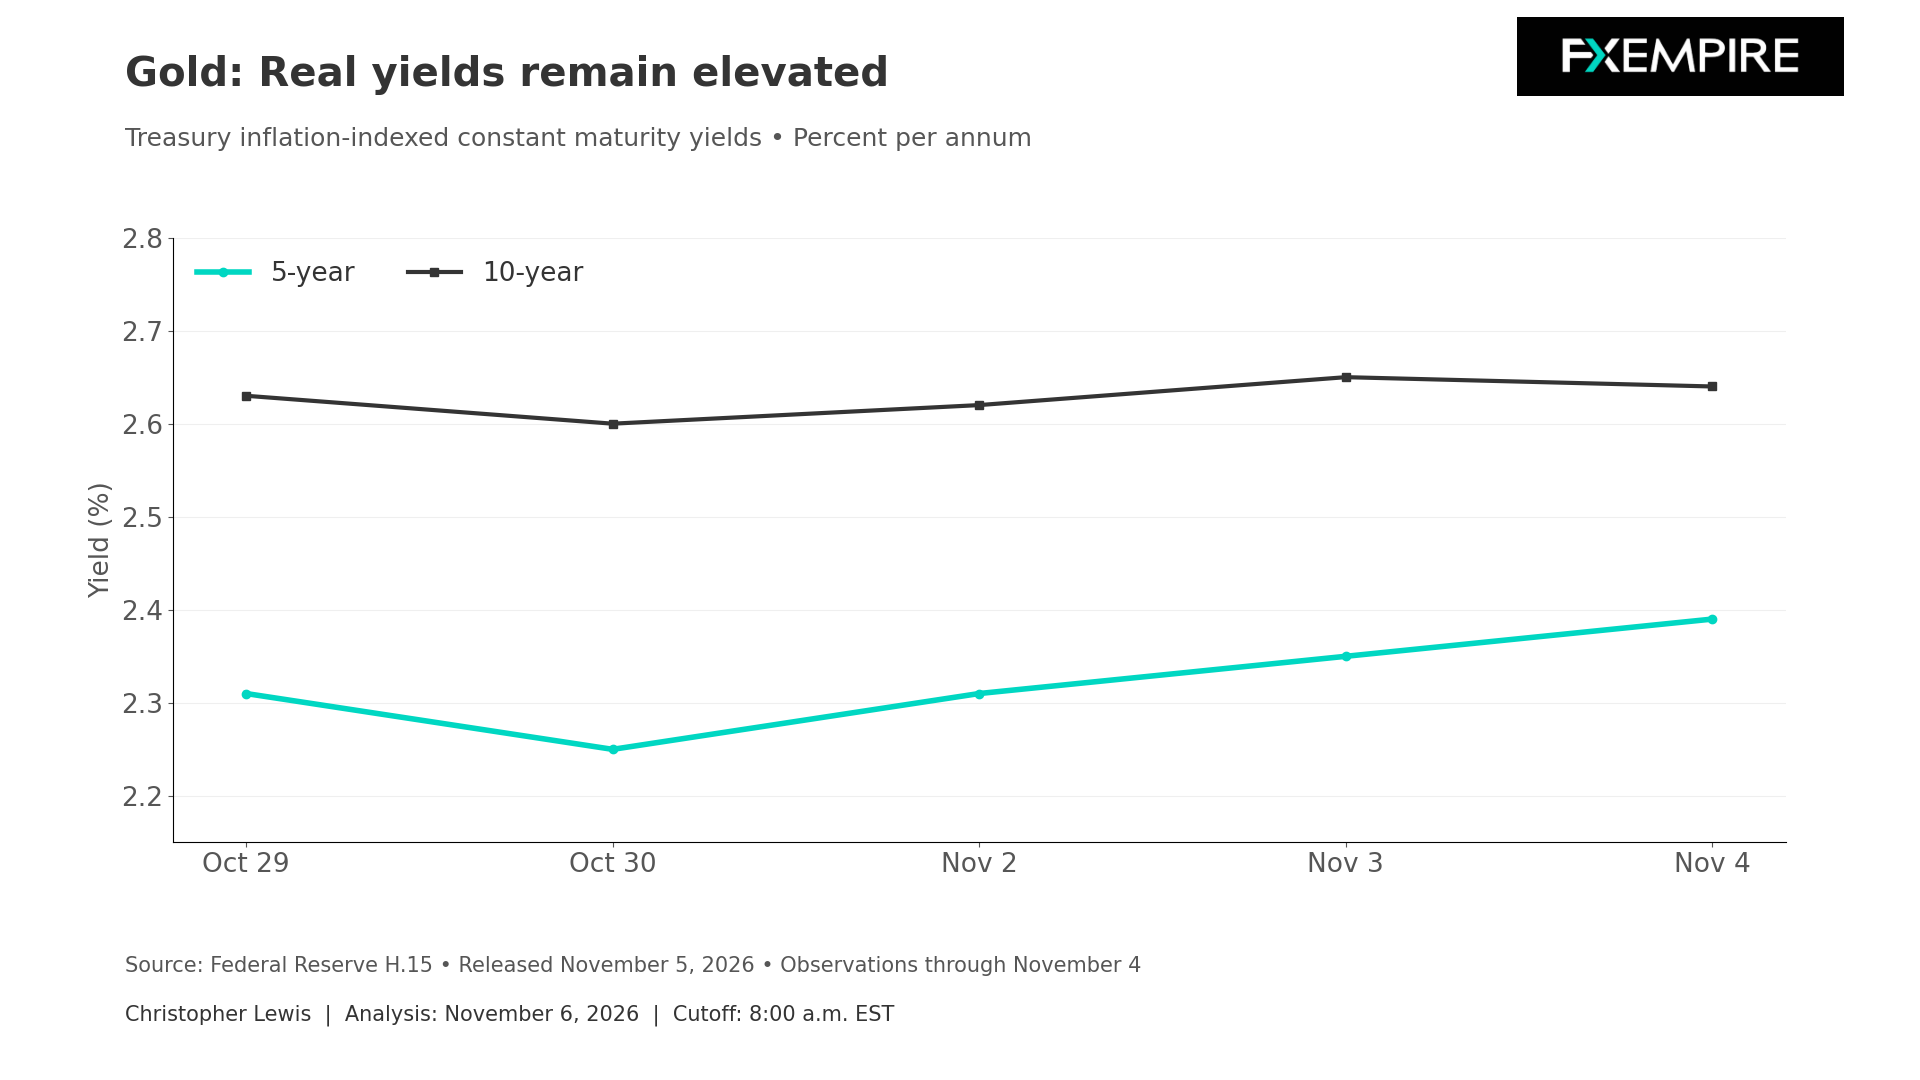
Gold currently faces a demanding interest-rate backdrop. On Friday, the Federal Reserve’s November 5 H.15 publication reported a 10-year inflation-indexed Treasury yield of 2.64% for November 4, while the 5-year equivalent was 2.39%.
These are not live quotes, but they show that traders continue to get paid to hold paper and inflation-protected government debt against a non-bearing asset such as gold. Across the five observations from October 29 through November 4, the 5-year real yield increased from 2.31% to 2.39%, while the 10-year rate changed little overall.
The chart below captures the difference between the two, but it does not necessarily demonstrate that yields cause a particular gold price move. It just shows why financing conditions are working against gold. Real yields represent one influence on gold, but not the complete valuation model. Investors may accept the absence of income when seeking diversification or protection against uncertain outcomes. Consequently, gold can remain resilient while real yields rise. The useful question is whether those competing sources of demand are strong enough to overcome the opportunity cost.
Monetary Policy Offers Little Basis for Assuming Immediate Relief
On October 28, the Federal Reserve maintained its target range at 3.75% to 4%. Two dissenters preferred a quarter-point increase. This decision leaves the policy debate sensitive to incoming evidence and should not be thought of as a commitment to cuts.
PCE
Inflation data are an important part of the evidence. The BEA’s October 29 release showed September PCE prices rising 0.5% month over month and 3.6% year over year. Excluding food and energy, increases were 0.3% and 3.1%. These are September conditions, but they do remain relevant background information.
For the gold market, persistent inflation creates competing channels. Concern about purchasing power can encourage demand for the metal, but at the same time, inflation that elicits tighter policy or higher real yields can make holding it more expensive from an opportunity-cost perspective.
CPI
The CPI release reinforced the need to distinguish headline energy pressure from underlying inflation. The BLS reported September headline CPI of 0.6% on the month and 3.7% over the year. The core measure increased 0.3% and 2.6%. Gasoline accounted for more than half the monthly headline increase. CPI and PCE cover different baskets and use different models, so their levels are not necessarily interchangeable.
Gold Price Forecast
Every new Gold analysis as it publishes, today's technical signal and key levels, live price — on one page.
See all Gold forecastsUS Employment Continues to Outperform
At today’s 8:30 a.m. payroll announcement, the United States added 165,000 jobs last month, well above the expected 65,000, and the previous month was revised higher. Average hourly earnings rose 0.4%, and the unemployment rate was 4.1%.
This clearly shows that the Federal Reserve will still have to be worried about an economy that just is not going to slow down easily. I think at this point in time, the gold market is going to need confirmation from rate markets before a softer policy narrative becomes anything close to persuasive.
A sustained decline in real yields would reduce one headwind. Renewed increases would preserve it, even if safe-haven demand temporarily offers a bit of an offset to pressure.
Technical Analysis
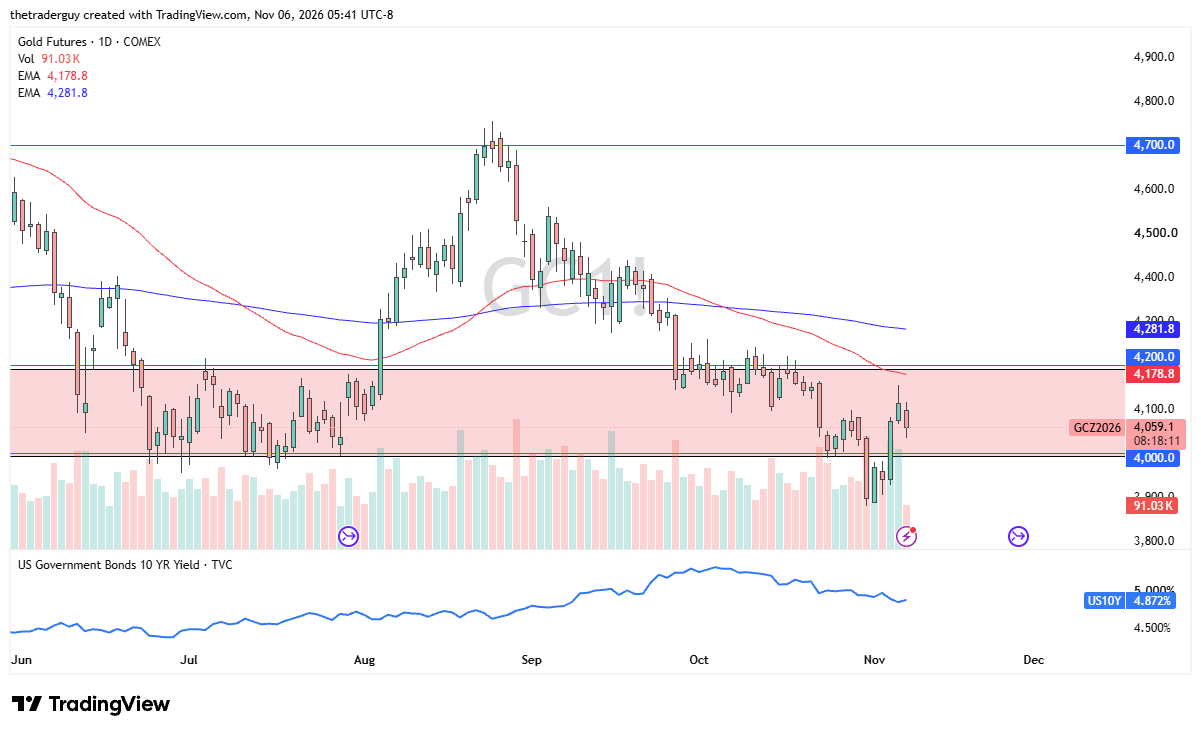
The technical analysis for gold suggests that we may continue to see downward pressure. We have turned around from the crucial $4,100 level after the jobs report, and any follow-through that breaks below the $4,000 level would be troublesome for gold bulls. It takes a break above the $4,200 swing high at this point to convince me that the buyers are about to take the reins again.
If you’d like to know more about how to trade gold and silver, please visit our educational area.