



Gold Steadies but Buyers Are Not Convinced
Gold held near $4,050 Friday after Thursday’s sharp selloff but the session felt more like a pause than a turn. Crude pulled back from triple digits, Treasury yields eased from their highest levels since January 2025 and the dollar stalled. That combination stopped the selling. It did not start a recovery. Volume was lighter, the range was tight and neither side showed real commitment heading into next week’s FOMC meeting.
Spot Gold settled at $4,052.85, up $3.07 or +0.08%. The small gain followed Thursday’s 1.94% decline.
Gold has fallen about 23% since the U.S.-backed war with Iran began in late February. Friday showed the metal can stabilize when crude and yields pull back. It did not show that buyers are ready to chase prices higher with the Fed meeting next week and the war still escalating.
Crude and Yields Gave Gold Room but Not a Reason
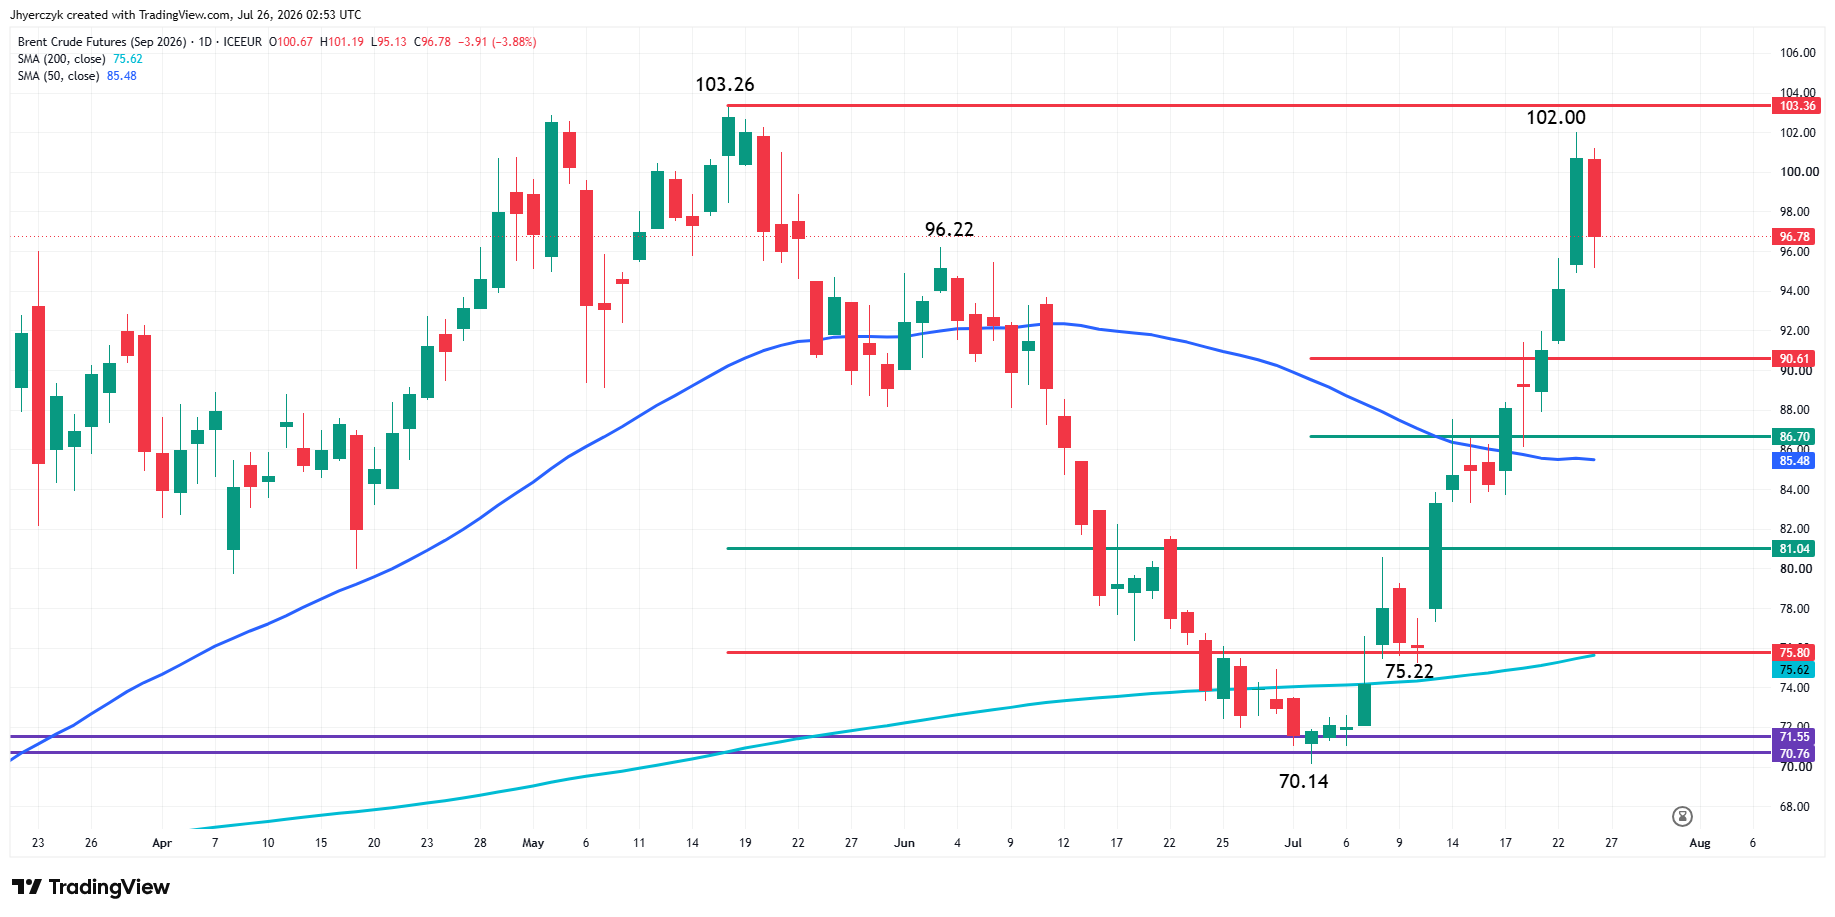
Brent settled at $96.78, down nearly 4%, and WTI finished at $89.31, down 3% after reports that Pakistan is exploring renewed U.S.-Iran talks with China’s support. The 10-year Treasury yield slipped to 4.681% after clearing 4.70% Thursday. The 2-year eased to 4.333% and the 30-year settled near 5.16%.
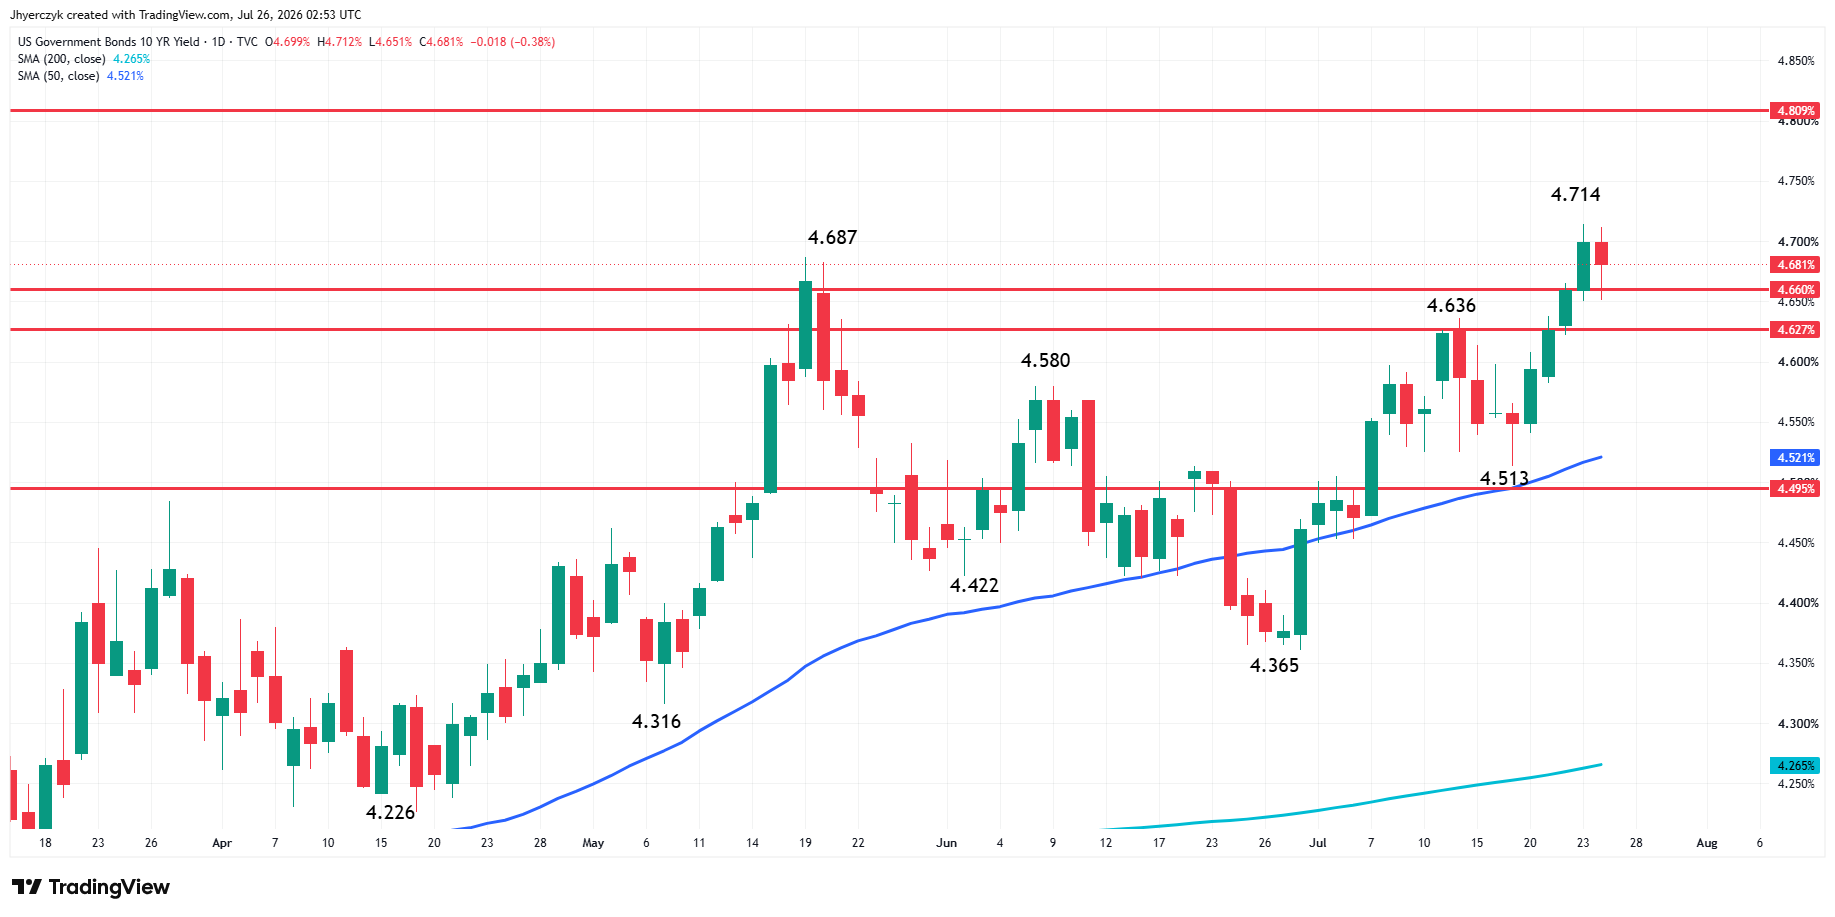
Gold responded but only modestly and that tells you something. The metal held together as yields eased but did not show any appetite to break away from the $4,000 area. The S&P Global flash PMI came in at 53.8, below the 54.4 estimate, which helped bring buyers back into bonds. Still expansion but not the strong print that would have kept the yield surge going.
The crude pullback did not come with a real improvement in the supply picture. U.S. forces completed a thirteenth consecutive night of strikes on Iranian targets. Iran is still disrupting Hormuz traffic. The Houthis said they struck Saudi tankers near Bab el-Mandeb this week. The diplomats are discussing talks while the military is still conducting strikes and those two things do not give gold a clean signal heading into the weekend.
Dollar Held Its Weekly Gain
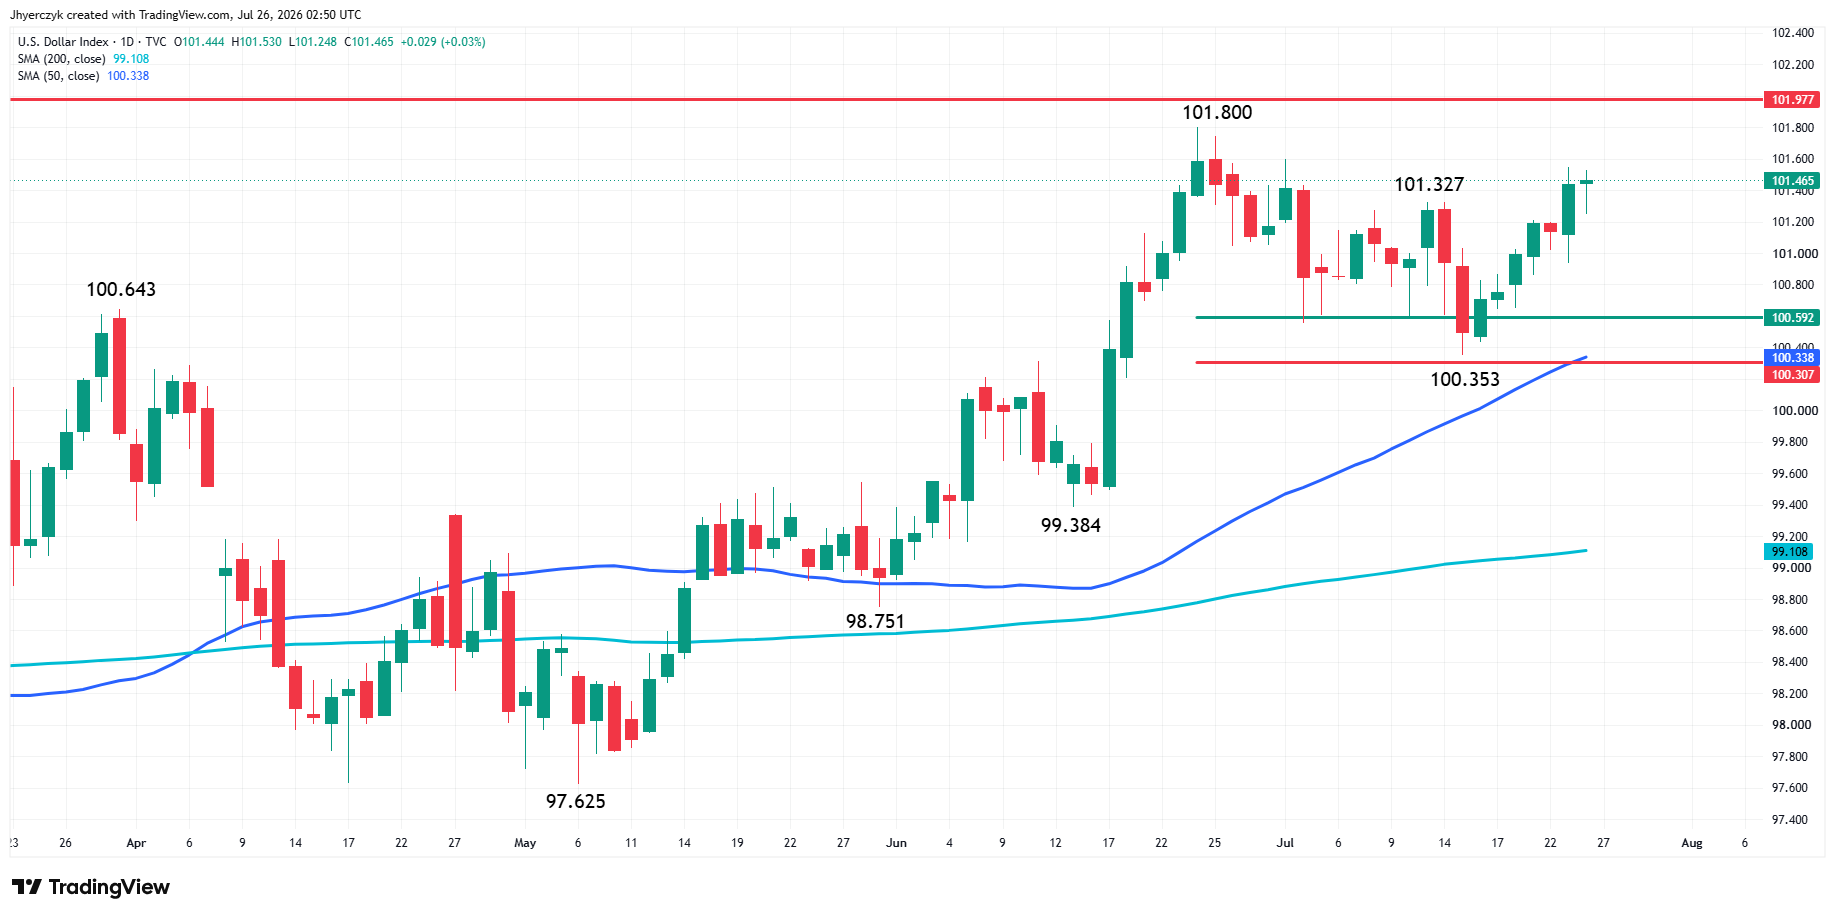
The dollar index slipped 0.04% Friday to 101.48 but was still up 0.7% for the week, on track for its strongest weekly gain in five weeks. Dollar-yen traded near 163.84 after touching its strongest level since 1986 on Thursday as Japan’s verbal intervention efforts have done nothing to change the move.
Gold Price Forecast
Every new Gold analysis as it publishes, today's technical signal and key levels, live price — on one page.
See all Gold forecastsGold does not need the dollar to collapse but it needs it to stop climbing before a larger recovery gains traction. Friday’s pause was not enough to change the weekly direction and the greenback is still drawing support from the same forces working against gold.
FOMC Decides Whether the Pause Holds
Traders are pricing a 35.8% chance of a rate hike at next week’s meeting, up from 12.8% a week ago. September odds are near 80%. A hold remains the likely outcome but the statement and Warsh’s tone matter more than the decision itself. The Fed is sitting on crude near $100, yields at their highest since January 2025 and jobless claims at their lowest since 1969. That is not the backdrop for a dovish shift.
Warsh dropped easing language from the June statement and has been skeptical of forward guidance since he took the chair. A hawkish statement focused on energy costs and sticky inflation keeps yields elevated and the dollar firm. Even a hold with no change in tone leaves the rate trade intact because the bond market is already doing the tightening.
Spot Gold (XAUUSD) Technical Analysis
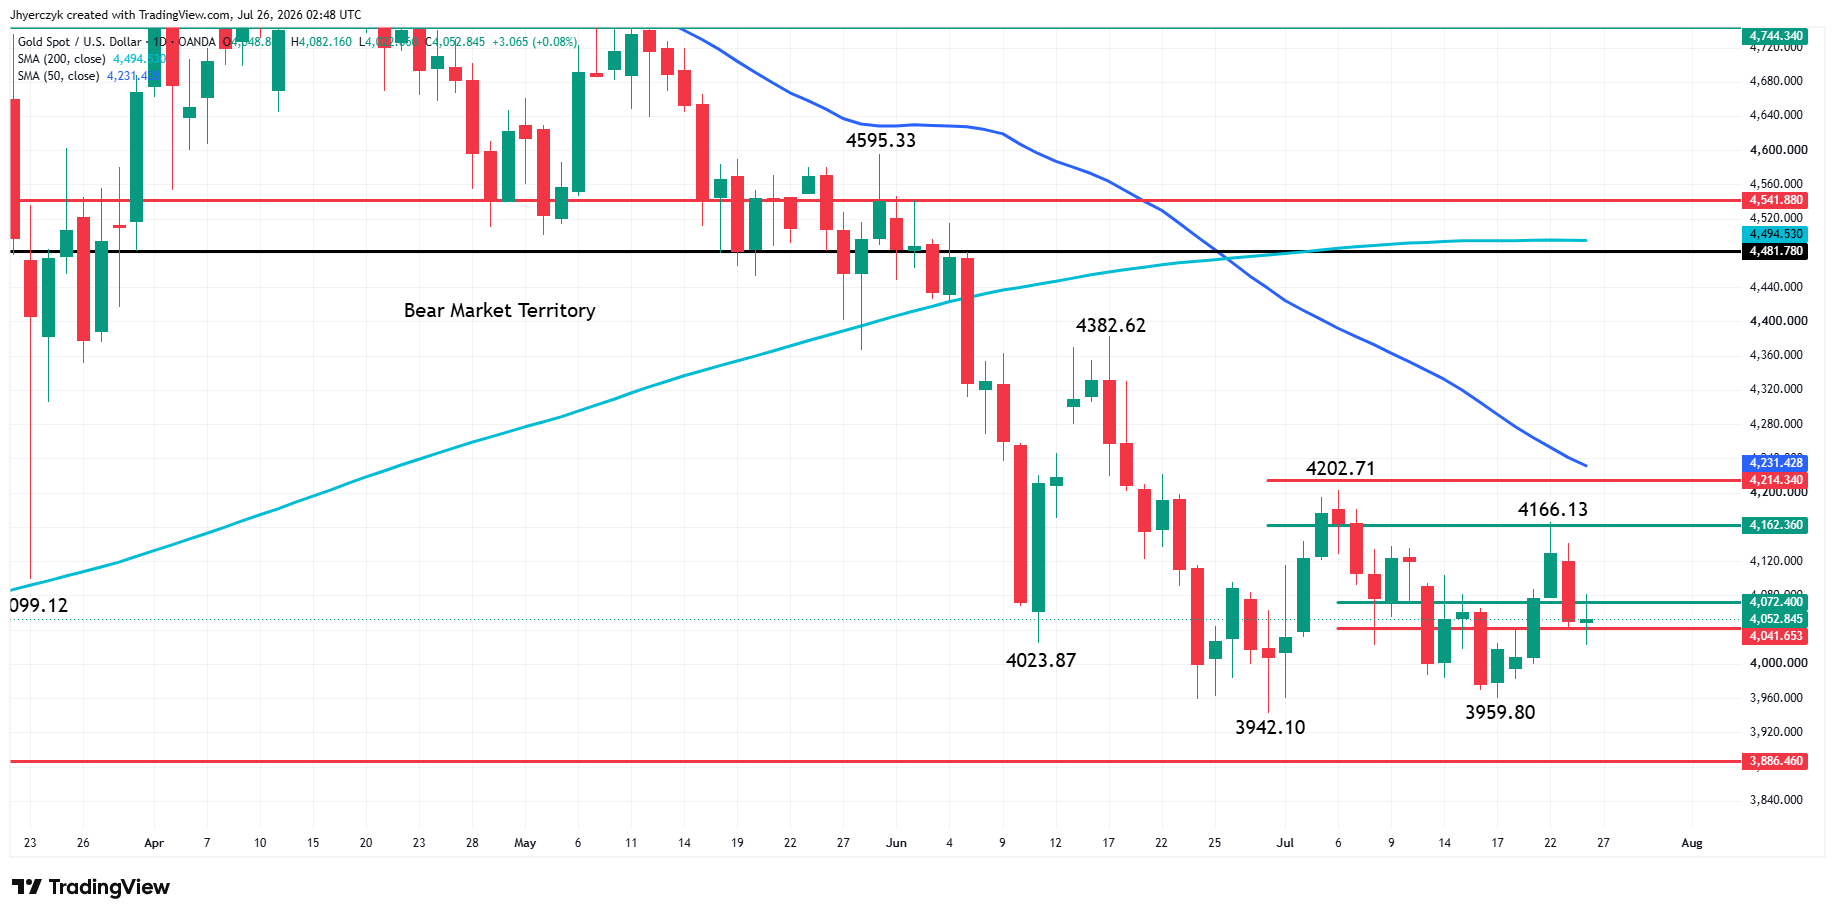
When I look at the gold chart several things stand out to me. I clearly see the series of lower tops and the 50-day moving average at $4231.43, which tells me we’re still in a downtrend. However, I also see a secondary higher bottom at $3959.80 and a main bottom at $3942.10 that suggest an elongated support base may be forming.
I also see the market straddling a short-term retracement zone at $4072.40 to $4041.65. Some traders are treating this area as a pivot zone. In other words, bullish over $4072.40 and bearish under $4041.65. Additionally, bullish traders want to see the formation of another higher bottom.
Bearish traders want to see selling pressure build under $4041.65 after the market formed a new lower top at $4166.13 earlier in the week. The retracement zone that stopped the rally was $4162.36 to $4214.34. This zone also stopped the rally at $4202.71 on July 6.
To simplify the current situation, in order to shift momentum to the upside, XAUUSD has to break the long-term pattern of lower tops.
What to Watch
Gold enters next week balanced between the relief from lower crude and the risk that the inflation trade comes back on the next war headline.
The downtrend is intact with lower tops and the 50-day average well overhead. The market is straddling the pivot zone that has been defining the short-term direction. Bullish traders need another higher bottom to confirm the base is building. Bears need selling pressure under the lower end of the pivot to reaffirm the pattern of lower tops that has been controlling this market since January. The pattern of lower tops has to break before this market can shift direction.
If you’d like to know more about how to trade gold, please visit our educational area.