



Dollar and Rate Hike Expectations Keep Pressure on Gold
Spot gold (XAUUSD) is higher early Tuesday as sellers took a breather. Nonetheless, the bear market was extended the previous session with prices hitting a more-than-one-year low. The main catalysts behind the selling pressure were a stronger dollar and firm expectations of a Federal Reserve rate hike next month.

An early dip in the U.S. Dollar Index (DXY) on Tuesday may be helping spot gold to stabilize, but the greenback’s current rally has put it in a position to extend its gains if buyers can establish a support base at 103.540. If successful, then 104.683 will become the primary upside target. This would put further pressure on gold prices. If there is a sustained break under 103.540 then we could see a short-covering rally in gold.
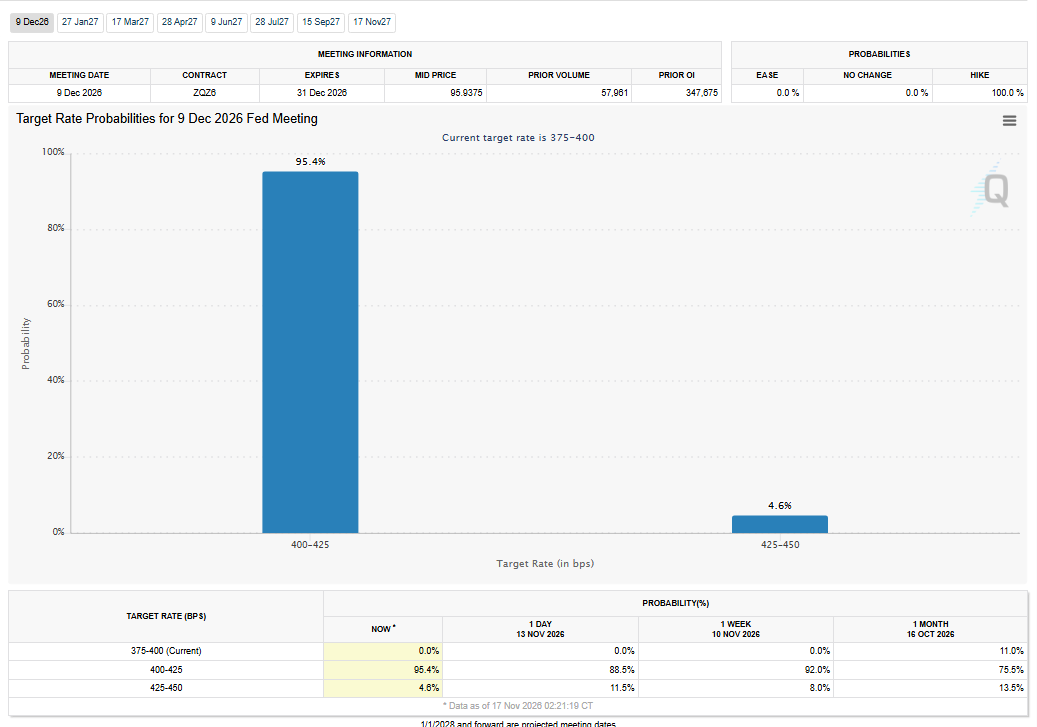
Last year at this time, spot gold was starting its climb to a record high on the back of expectations of 2 or 3 rate cuts by the Fed in 2026. This year, gold is facing opposite conditions. The chances of a Fed rate hike in December are about 100%. However, the risk for gold traders is the uncertainty over how many rate hikes will be needed and how long rates will be elevated to push inflation back to acceptable levels. This may be the actual reason gold’s gains are likely to be capped for months.
Weekly Spot Gold (XAUUSD) Technical Analysis
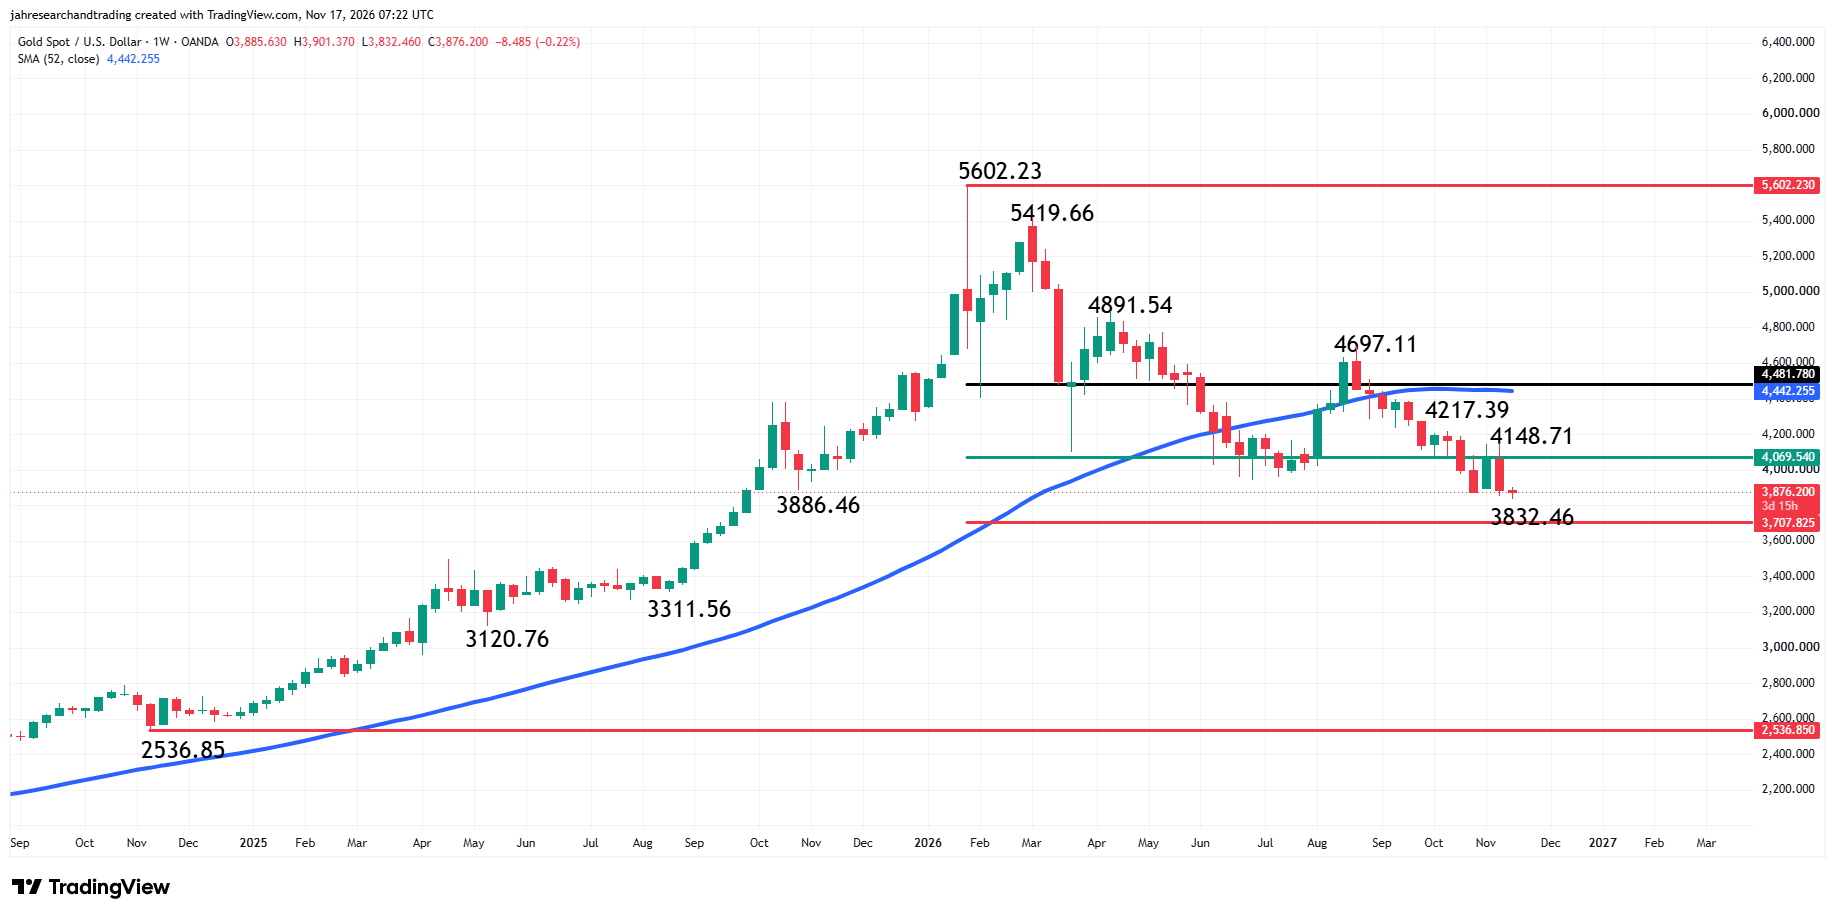
Spot gold is edging lower for the week after Monday’s sell-off. However, we are seeing a small rebound from yesterday’s low at $3832.46, which suggests some stabilization is taking place.
The main trend is down according to the weekly swing chart. A trade through the main top at $4148.71 will change the main trend to up. A trade through $3832.46 will signal a resumption of the downtrend.
I define my long-term range as $2536.85 to $5602.23. The low at $2536.85 is the November 2024 main bottom I use to measure the rally to the record high in January 2026. The retracement zone formed by this range is $4069.54 to $3707.82. Spot gold is currently trading inside this zone. To some this area may represent value. To others it may be the gateway to further downside pressure.
On the upside, I see the price cluster formed by the 52-week moving average at $4442.28 and $4481.78 as the most important area to overcome for longer-term bulls. The $4481.78 resistance is 20% down from the all-time high at $5602.23. Classical technical analysts may refer to this level as the start of the bear market. The way I see it, overcoming this level would be an important step toward a new bull market. Based on this week’s low so far, 20% up from $3832.46 is $4598.95, which traditionally would mark the start of a new bull market.
If you want to go further with the math then $3734.82 is the number to watch. A 20% rally from this level will equal $4481.78. A bottom above $3734.82 would put the 20% rally level above $4481.78, while a bottom below it would put the 20% rally level below $4481.78.
I’m just putting numbers out there because I think the market will likely change trend on a chart pattern rather than a specific price level.
Gold Price Forecast
Every new Gold analysis as it publishes, today's technical signal and key levels, live price — on one page.
See all Gold forecastsDaily Spot Gold (XAUUSD) Technical Analysis
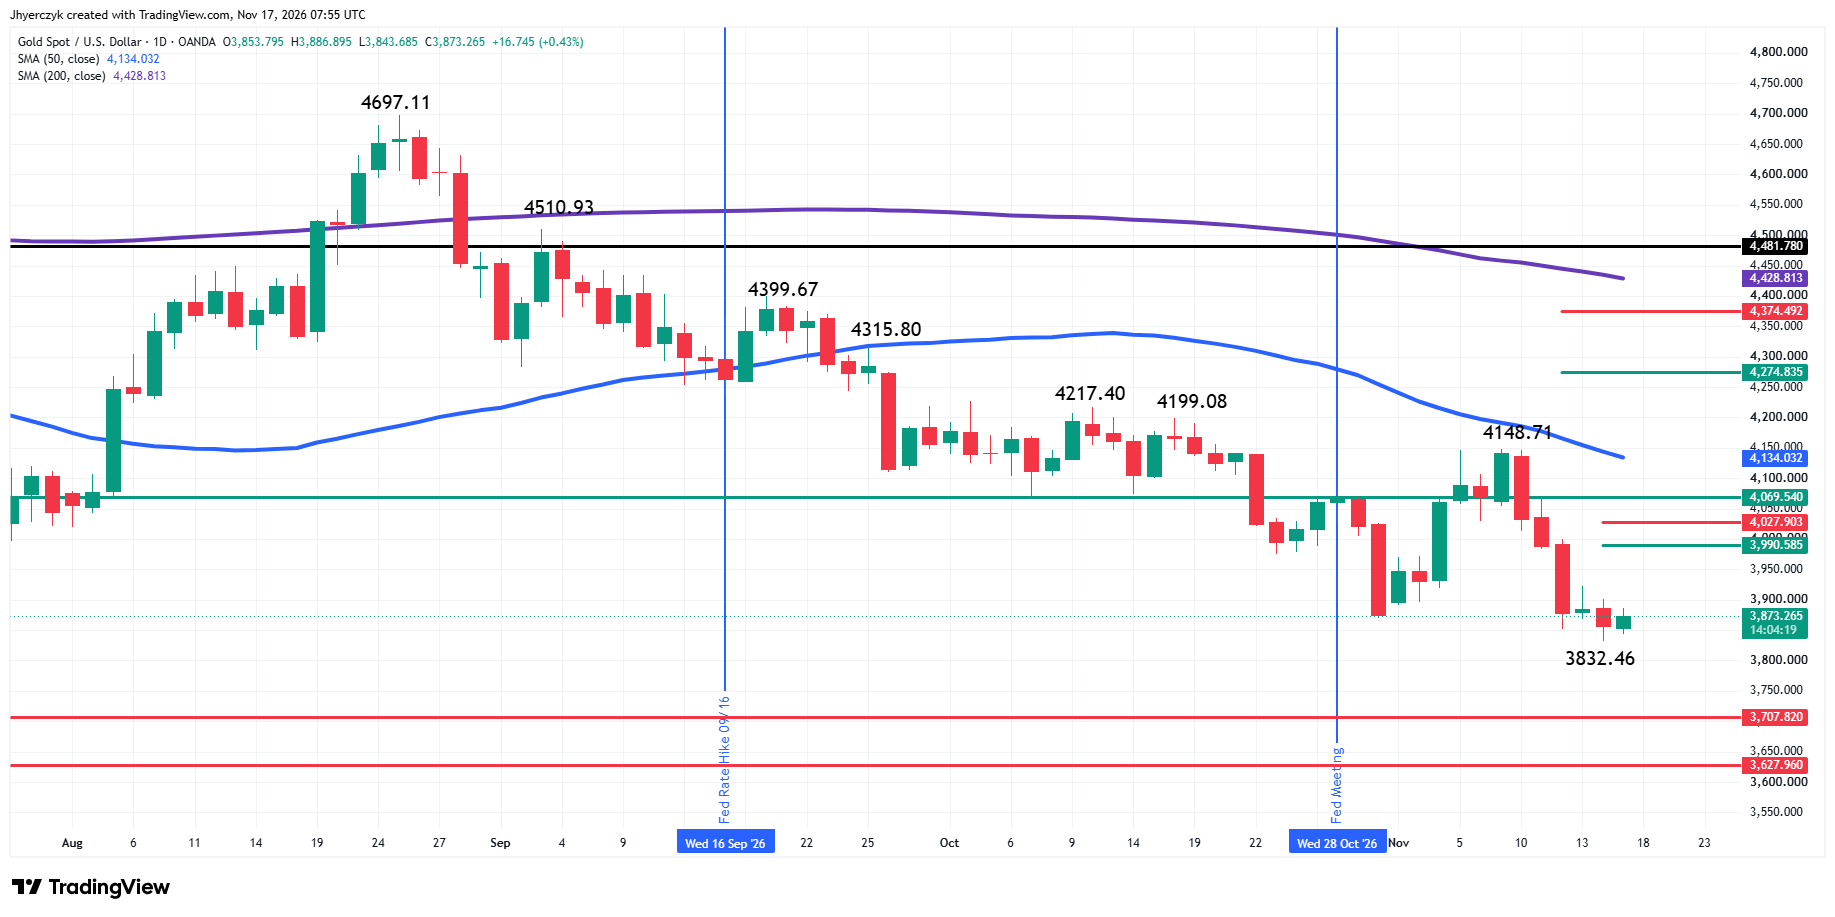
The main trend is down according to the daily swing chart. A trade through $3832.46 will signal a resumption of the downtrend. This would put the long-term 61.8% level at $3707.82 on the radar, followed by a long-term bottom at $3627.96.
Taking out the last swing top at $4148.71 will change the main trend to up. However, more importantly, this move will take place on the strong side of the long-term 50% level at $4069.54 and the 50-day moving average at $4134.032. So this move could mark a serious shift in momentum.
What to Watch
Weekly Spot Gold (XAUUSD)
My weekly bias is bearish because the main trend is down on the main swing chart, spot gold is well below the long-term 52-week moving average trend indicator and it’s in a bear market. Traders appear to be searching for value, which they could find inside the long-term retracement zone at $4069.54 to $3707.82.
A trade through $3707.82 will strengthen my outlook, but overcoming $4069.54 will be the first warning sign that it’s beginning to weaken. Overcoming the swing top at $4148.71 will shift my bias to the upside.
Daily Spot Gold (XAUUSD)
My bias on the daily chart is bearish because the main trend is down, spot gold is on the bear side of the long-term 50% level at $4069.54 and the 50-day moving average at $4134.032. My outlook will strengthen on a sharp breakdown under $3832.46 with $3707.82 the next major target.
My outlook will weaken if buyers recover the short-term 61.8% level at $4027.90. This will put the market in a position to challenge the long-term 50% level at $4069.54, the 50-day moving average at $4134.032 and the main top at $4148.71.
If you’d like to know more about how to trade gold, please visit our educational area.