



Gold prices are bouncing back after last week’s plunge as traders turned their focus from Fed rate-hike expectations to softer oil prices and U.S. midterm elections.
Both spot gold and gold futures are up more than 2% mid-morning after hitting a one-year low last Friday. A drop in crude oil prices dampened inflation concerns early in the session. The move encouraged short-covering and speculative buying. Meanwhile, some investors may be flattening positions ahead of Tuesday’s U.S. midterm elections, which could impact future government policy.
Lower Oil Pressures Rate-Hike Expectations
Lower oil prices are not expected to change trader bets on a December rate hike, but they could have an impact on total rate-hike expectations during this current tightening cycle.
December rate-hike expectations have retreated a little today, but just enough to pressure the U.S. Dollar Index, which is providing another tailwind for gold.
Iran-Qatar Talks Weigh on Crude Prices
The main catalyst is crude oil. Both WTI and Brent crude oil prices are down over 6% after a third consecutive day of talks between Iran and Qatar aimed at bringing an end to the war between the United States and Iran.
The possibility of lower inflation and reduced expectations of higher interest rates are the key factors today because they both impact non-yielding gold.
Gold Price Forecast
Every new Gold analysis as it publishes, today's technical signal and key levels, live price — on one page.
See all Gold forecastsMargin Calls and Midterm Elections Come Into Focus
One explanation for Friday’s sell-off was the big drop last week in technology stocks. The weakness may have led to margin calls, forcing hedge funds to sell gold to generate cash needed to meet those calls.
Others said political concerns over the U.S. midterm elections are the main story this week because of their potential impact on U.S. fiscal policies. Some, however, argued the elections may have limited impact because neither political party is expected to address the current level of U.S. debt, a condition they view as long-term supportive for gold prices.
Weekly Spot Gold (XAUUSD) Technical Analysis
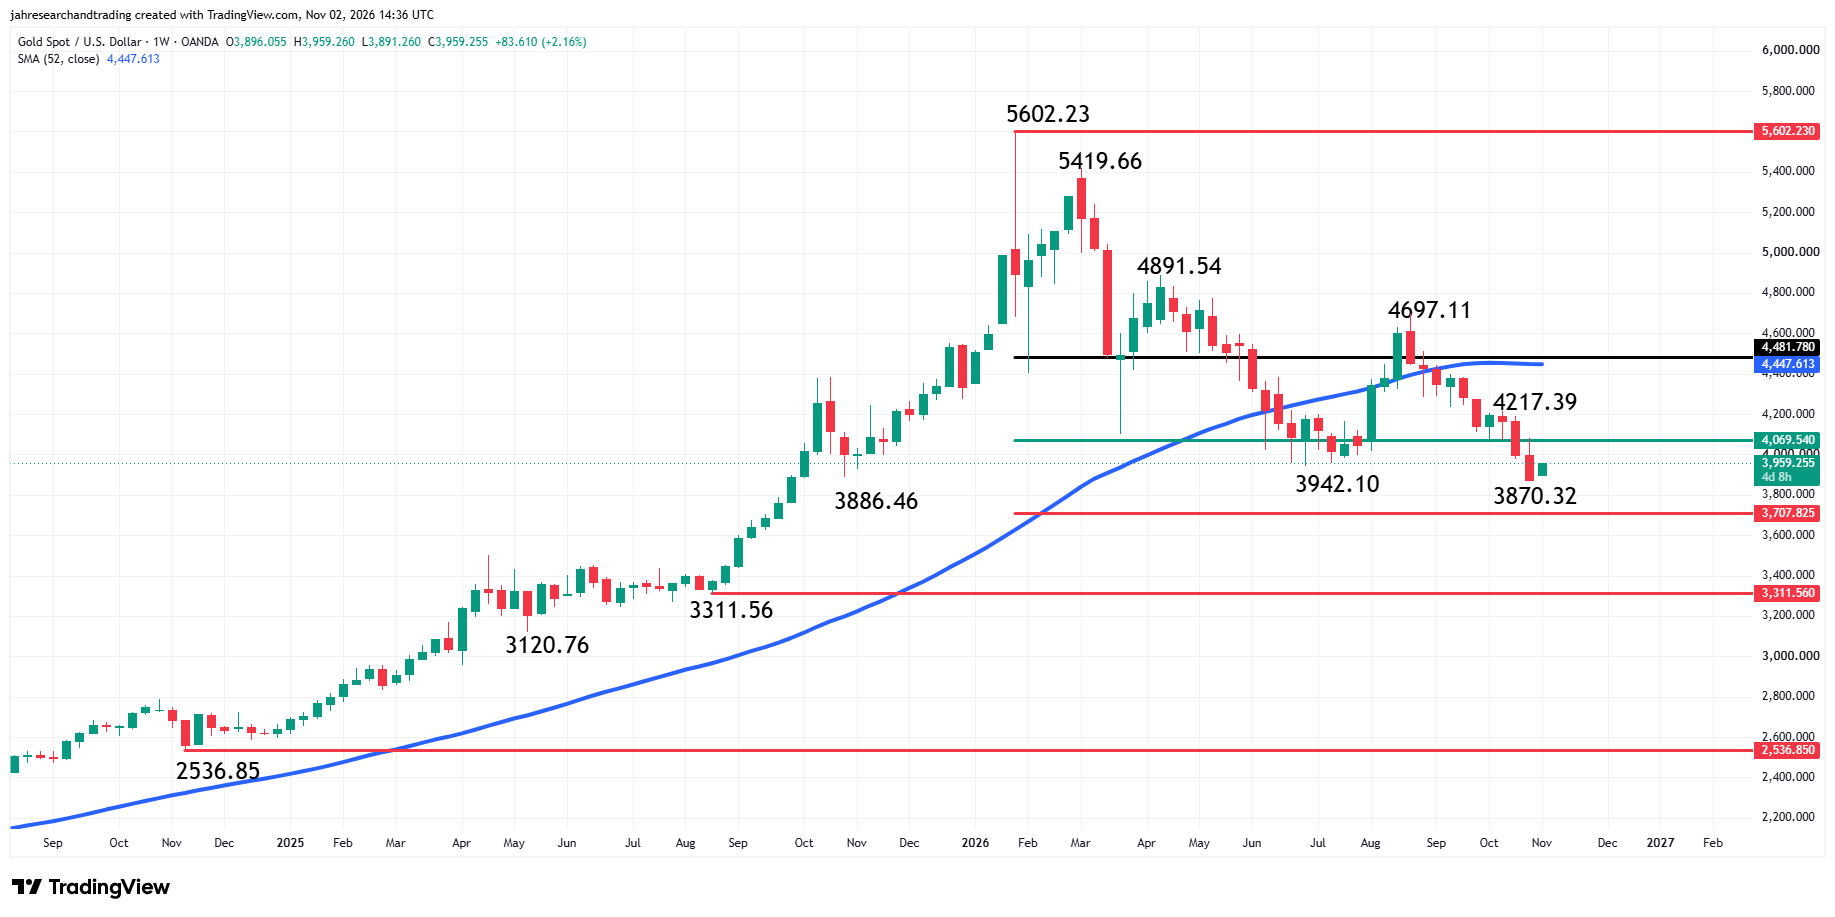
Spot gold is edging higher on the weekly chart early Monday after last week’s steep sell-off. Buyers came in before traders were able to take out last week’s low, suggesting they may be looking for value or reacting to a technically oversold market.
The main trend is down according to the weekly swing chart. A trade through $3870.32 will signal a resumption of the downtrend. The main trend will change to up on a trade through $4697.11.
The minor trend is also down. A trade through $4217.39 will change the minor trend to up. This is likely to shift momentum to the upside.
The main range I am dealing with was formed by the November 2024 main bottom at $2536.85 and the January 2026 main top at $5602.23. The retracement zone formed by that range at $4069.54 to $3707.82 is currently being tested. To some long-term investors this may be perceived as a value zone.
On the upside, the 52-week moving average at $4447.29 is major resistance and a long-term trend indicator. This is followed by $4481.78, which is 20% down from the all-time high at $5602.23, the level that marks the start of the bear market.
Weekly December Comex Gold Futures Technical Analysis
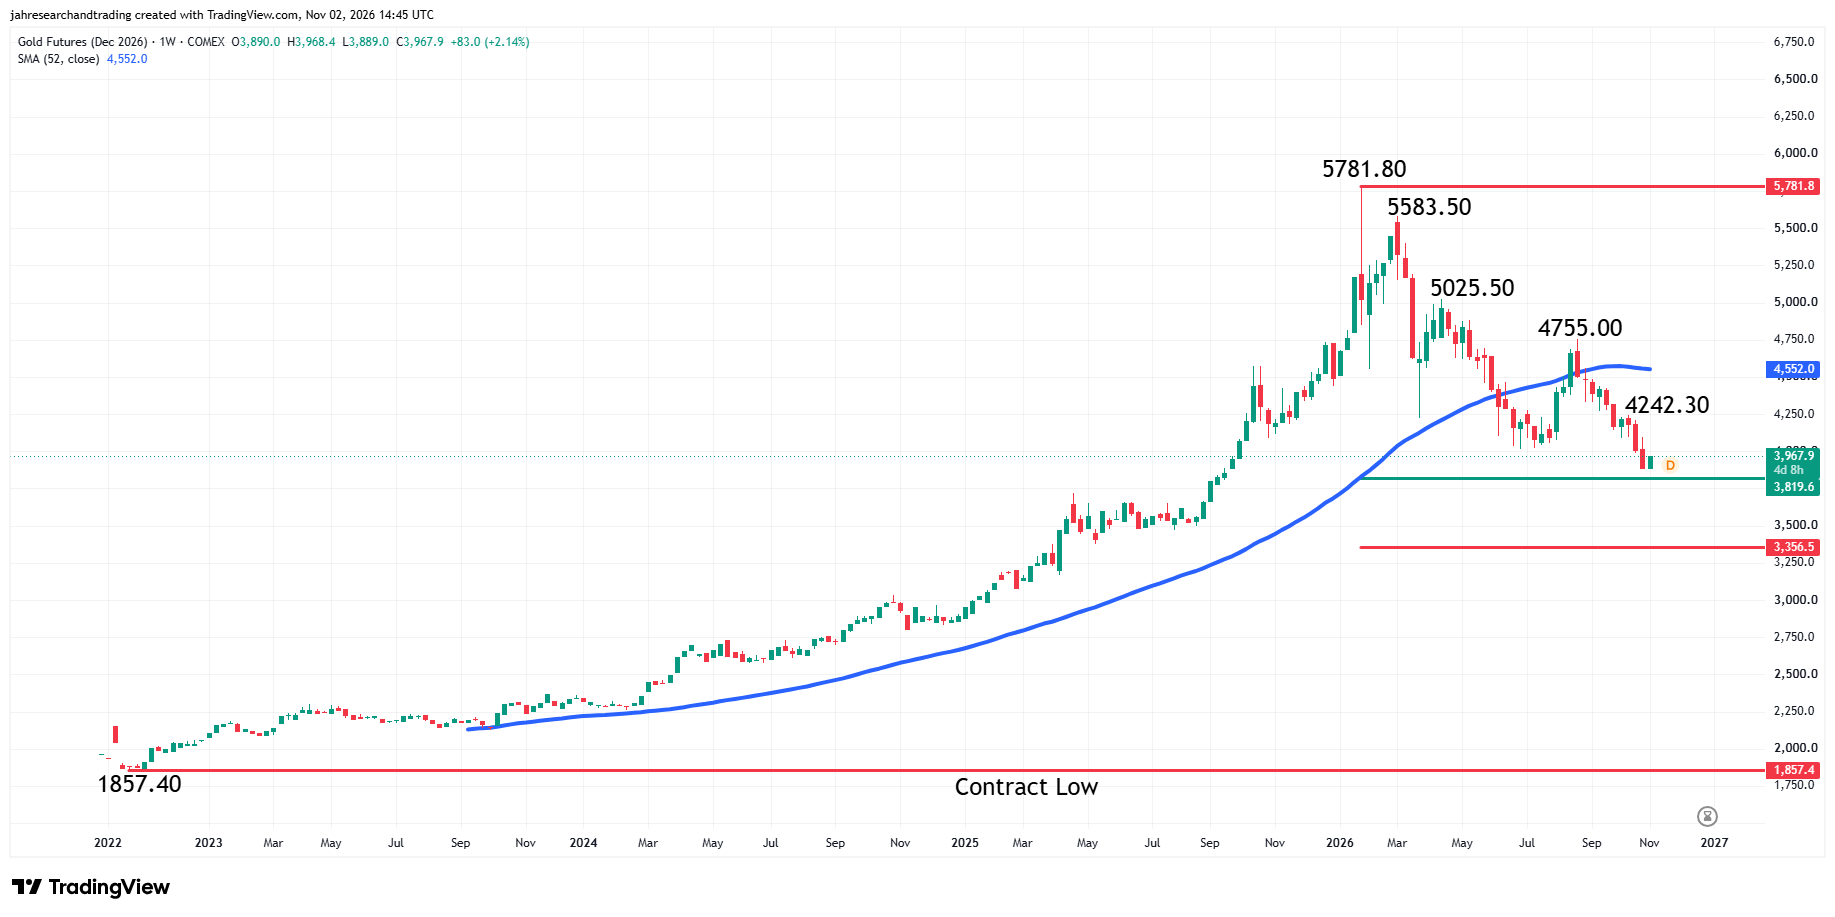
December Comex Gold futures are over 2.00% higher on Monday after holding last week’s low at $3879.30. So far we’re just looking at an inside week, but if $4097.20 is taken out, that low will become a new minor bottom.
The main trend is down according to the weekly swing chart. A trade through $3879.30 will signal a resumption of the downtrend. Taking out $4755.00 will change the main trend to up.
The minor trend is also down. A trade through $4242.30 will change the minor trend to up. This will also shift momentum to the upside.
The major resistance and long-term trend indicator is the 52-week moving average at $4552.00.
The futures contract range is $1857.40 to $5781.80. Its 50% to 61.8% retracement zone support is $3819.60 to $3356.50.
What to Watch
Spot Gold (XAUUSD)
With the main swing chart trending lower and the market well below the 52-week moving average, my bias is to the downside. It is further supported by the confirmation of the bear market.
For value traders, whether passive or active bidders, the key area to watch is $4069.54 to $3707.82. Trader reaction to this zone will show whether buyers are willing to actively take out offers at $4069.54 or whether passive bidders are willing to buy against the 61.8% level at $3707.82.
Overtaking $4069.54 will weaken my downside bias, while a breakdown under $3707.82 will strengthen it.
December Comex Gold Futures
Despite this week’s counter-trend rally, my bias remains to the downside because of the strength of the downtrending main swing chart and the trade on the weak side of the 52-week moving average at $4552.00.
We’ll be watching trader reaction to last week’s high at $4097.20. Taking it out will form a new minor bottom and a minor retracement zone. Two weeks of higher highs will create a main bottom and consequently a main retracement zone. This will give us two potential upside targets and places we can use to gauge the strength or weakness of the downtrend.
If you’d like to know more about how to trade gold, please visit our educational area.