



December Rate Expectations Remain in Focus
Spot Gold is trading near a three-month low Friday after breaking below $4,000 earlier in the session. The move puts the metal on track for its steepest weekly loss since June.
Traders remain focused on next week’s Fed meeting, December rate expectations and the upcoming PCE report.
At 08:37 GMT, XAUUSD was trading $4,019.08, down $5.43 or -0.13%. Earlier, it reached $3,986.73, its lowest level since July 20.
December Is Still the Rate Question
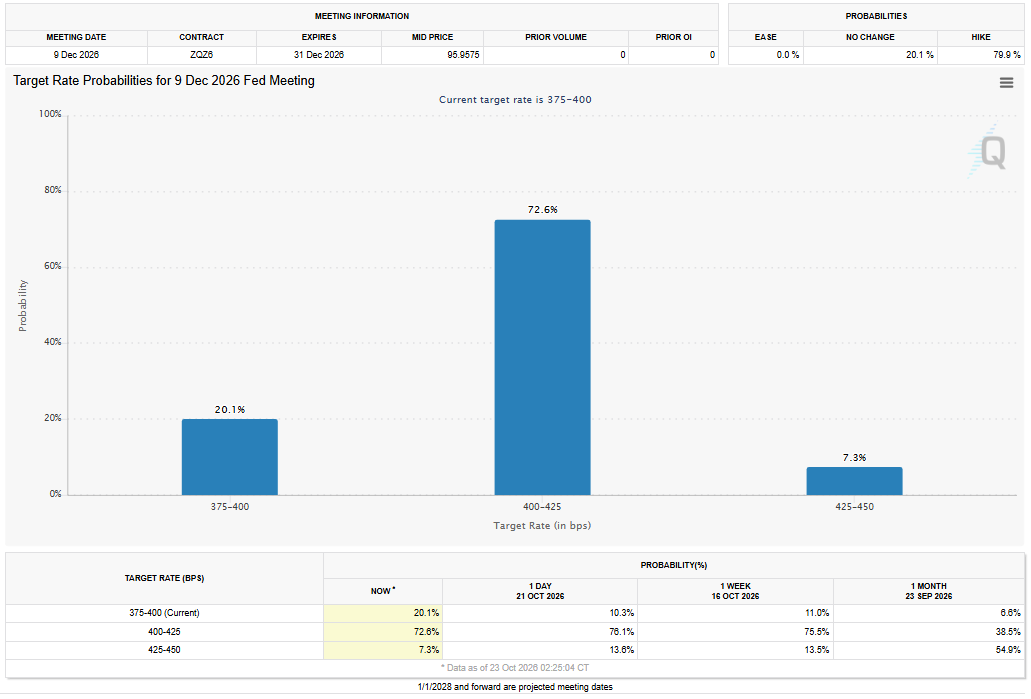
October is not the problem for gold. Traders have largely put that meeting to bed, with FedWatch showing a 90.6% chance the Fed holds rates steady next week.
December is still hanging over the market. The odds of a quarter-point hike into the 4.00%-4.25% range slipped to 72.6% from 76.1% a day earlier. Gold buyers did not treat that as a reason to take offers.
Oil is keeping the inflation argument alive. Attacks in Saudi Arabia have pushed energy risk back into the market, and next week’s PCE report will show whether traders have a reason to keep the December hike trade on.
That is why the break below $4,000 matters. Gold does not need December hike odds to rise again to stay under pressure. It only needs traders to believe that rate relief remains out of reach.
Gold Price Forecast
Every new Gold analysis as it publishes, today's technical signal and key levels, live price — on one page.
See all Gold forecastsDaily Spot Gold (XAUUSD) Technical Analysis
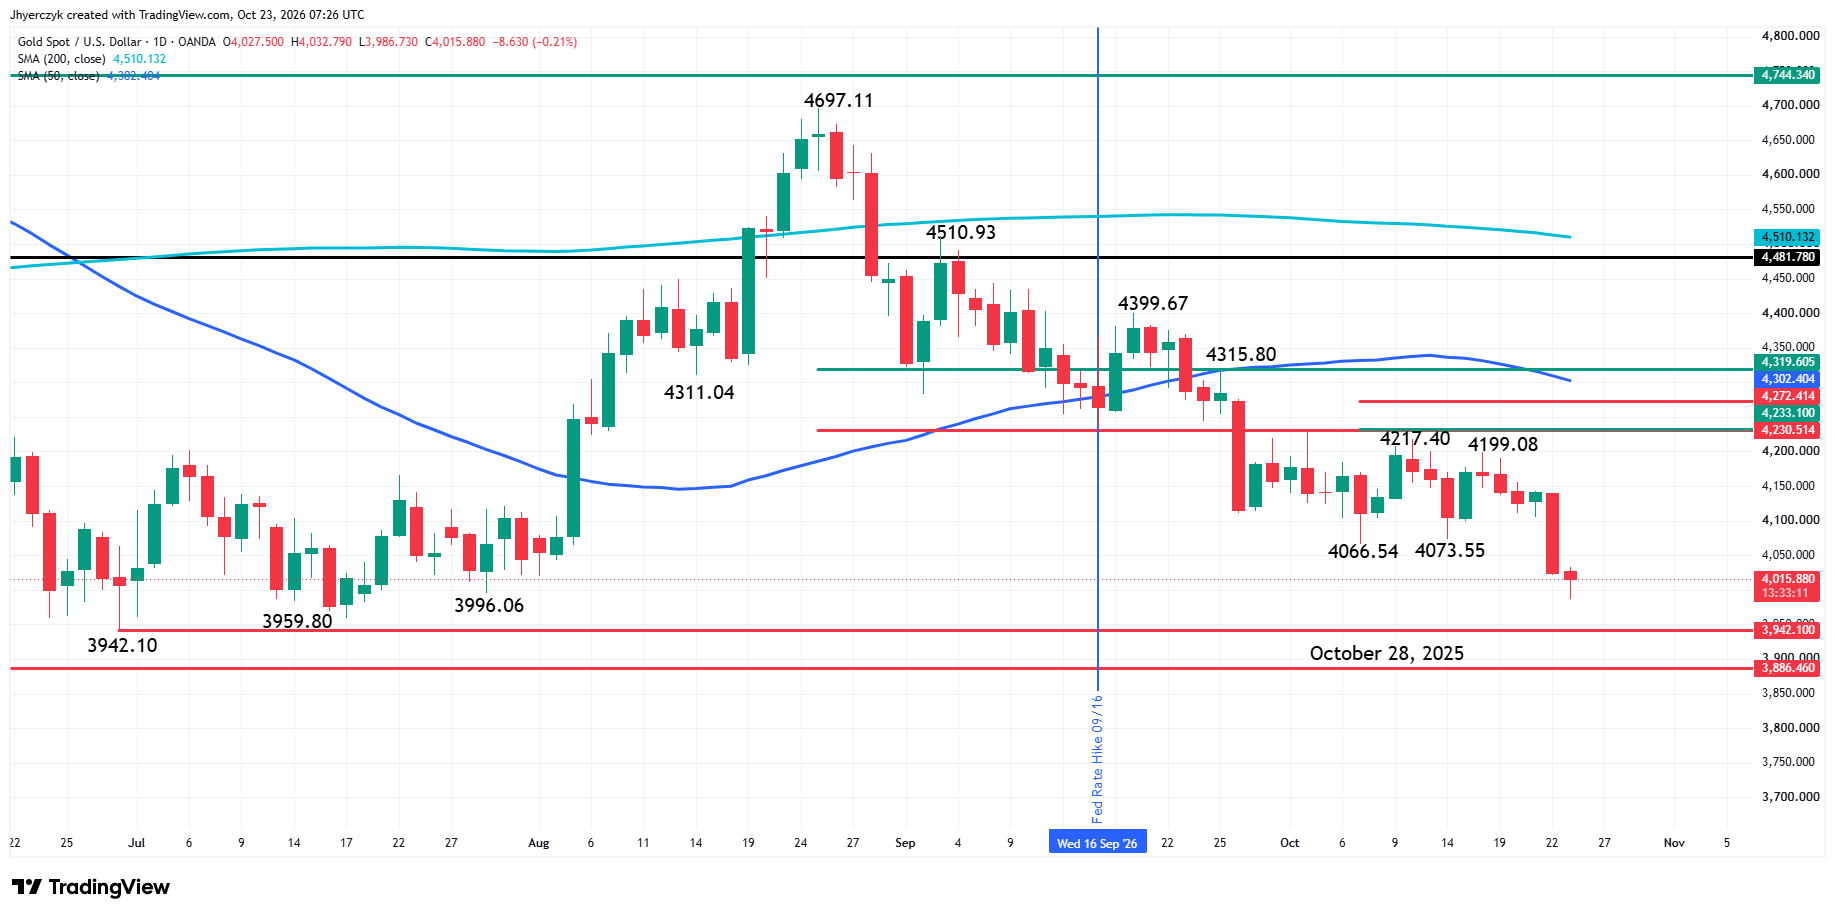
The main trend is down according to the daily swing chart. The downtrend was reaffirmed when sellers took out a pair of swing bottoms at $4,073.55 and $4,066.54 on Thursday and the July 29 main bottom at $3,996.06 earlier today.
The next targets are intermediate levels at $3,959.80 and $3,942.10. The long-term target is $3,886.46, the October 28, 2025 low. A trade through $4,199.08 will change the main trend to up.
Weekly Spot Gold (XAUUSD) Technical Analysis
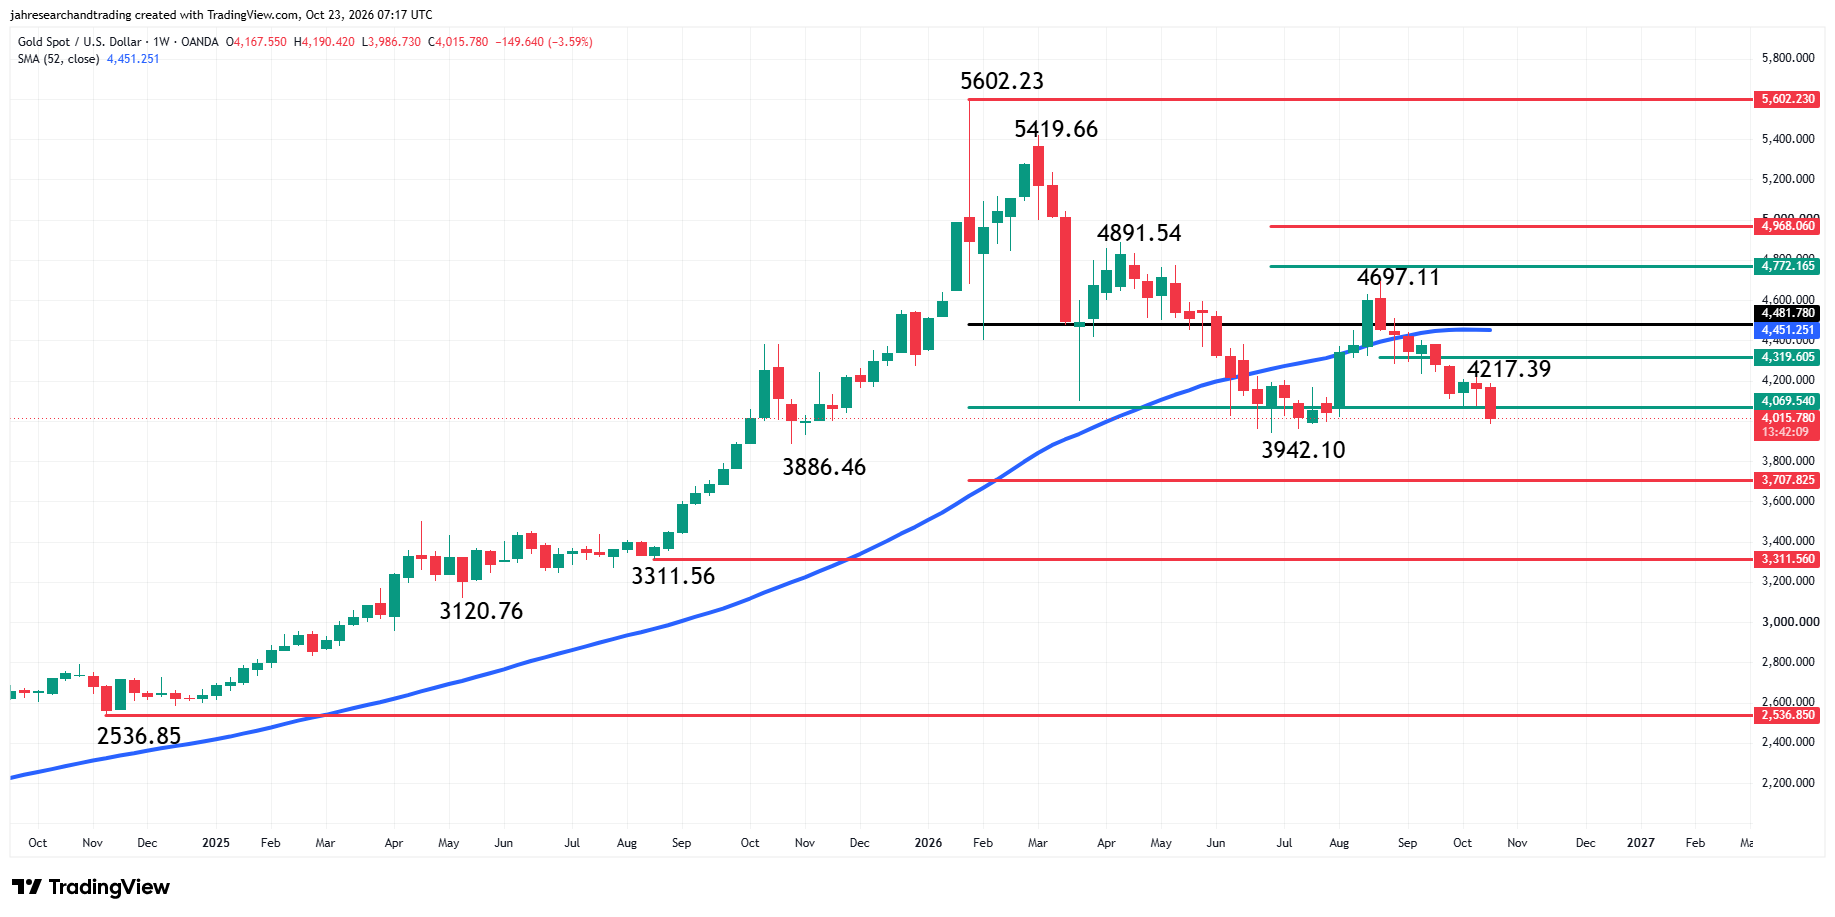
Spot gold is trading sharply lower for the week. The main trend is down according to the weekly swing chart. The next downside target is the swing bottom at $3,942.10. The main trend will change to up on a breakout over the swing top at $4,697.11. The minor trend is also down. A trade through $4,217.39 will change the minor trend to up and could shift momentum to the upside.
Short-term resistance is a 50% level at $4,319.60. Intermediate resistance is the 52-week moving average at $4,451.25. This is slightly below the start of the bear market at $4,481.78.
From the week-ending November 15, 2024 to the week-ending January 30, 2026, Spot gold traveled from $2,536.85 to $5,602.23. It’s now testing the 50% to 61.8% range of that rally at $4,069.54 to $3,707.82. It’s been tested successfully before when Spot gold bottomed at $3,942.10. Based on past performance, it tells me that trader reaction to this zone could determine the intermediate direction of XAUUSD.
What to Watch
For Daily Spot Gold, my bias is to the downside. The downtrend on the main swing chart and trading below the 50-day moving average are controlling my downside bias. Although a technical rebound is possible, it will likely attract renewed selling pressure. A bounce from a major support area will be more important so we have to wait until it hits a potential value area between $3,942.10 to $3,886.46.
For weekly Spot Gold, my bias is also to the downside. It’s being supported by the trade on the weak side of the 52-week moving average and the downtrends on both the minor and main swing charts. A trade through $4,217.39 will turn the minor trend up and weaken my bearish outlook.
We’re also going to be watching the reaction to a test of $4,069.54 to $3,707.82. This zone produced a positive reaction before. We could see the same reaction this time, but it will be relatively meaningless unless buyers can recover $4,217.39.
If you’d like to know more about how to trade gold, please visit our educational area.