


Gold opens the Tuesday session with a tug of war between heavier opportunity costs and continued investment demand. The latest Treasury daily real yield observations were for Monday, with the 5-year real yield at 2.68% and the 10-year real yield at 2.92%. These are elevated real borrowing costs for an asset that does not pay interest, like gold. If those yields hold or rise, investors face a higher return available from inflation-protected Treasuries, which can make non-yielding bullion less attractive at the margin.
The relationship is not necessarily mechanical. Official-sector purchases, currency shifts, liquidity needs, and geopolitical risk can all overwhelm the rate situation for periods of time.
Inflation Reports
The recent inflation reports do not settle the rates question. The Bureau of Labor Statistics reported that October consumer prices rose 0.4% from September, slower than September’s 0.6% monthly increase, while core CPI advanced 0.3%. Energy prices increased 0.7% in October. The October producer price report, published on November 13, showed another monthly increase in final-demand prices and a firm annual reading.
These releases are useful context, but they are several days old and should be thought of as such. Markets will need subsequent inflation readings and Federal Reserve communications to judge whether the current real-yield level persists. The Fed’s next industrial production release is not a gold catalyst, and today’s report should not imply as such.
Investment Flows Provide a Counterweight to Rate Pressure
The World Gold Council estimated that physically backed gold ETFs attracted $2.7 billion in October. Global holdings increased by 19 tons to a record 4,275 tons, even as aggregate assets under management fell 6% to $542 billion, reflecting the decline in gold prices during the month.
The regional split was uneven. European funds added about $1.8 billion and Asian funds added $1.3 billion, while North American funds saw an estimated $512 million of outflows. Global inflows, therefore, conceal a meaningful change in where investors were adding exposure.
Gold Price Forecast
Every new Gold analysis as it publishes, today's technical signal and key levels, live price — on one page.
See all Gold forecasts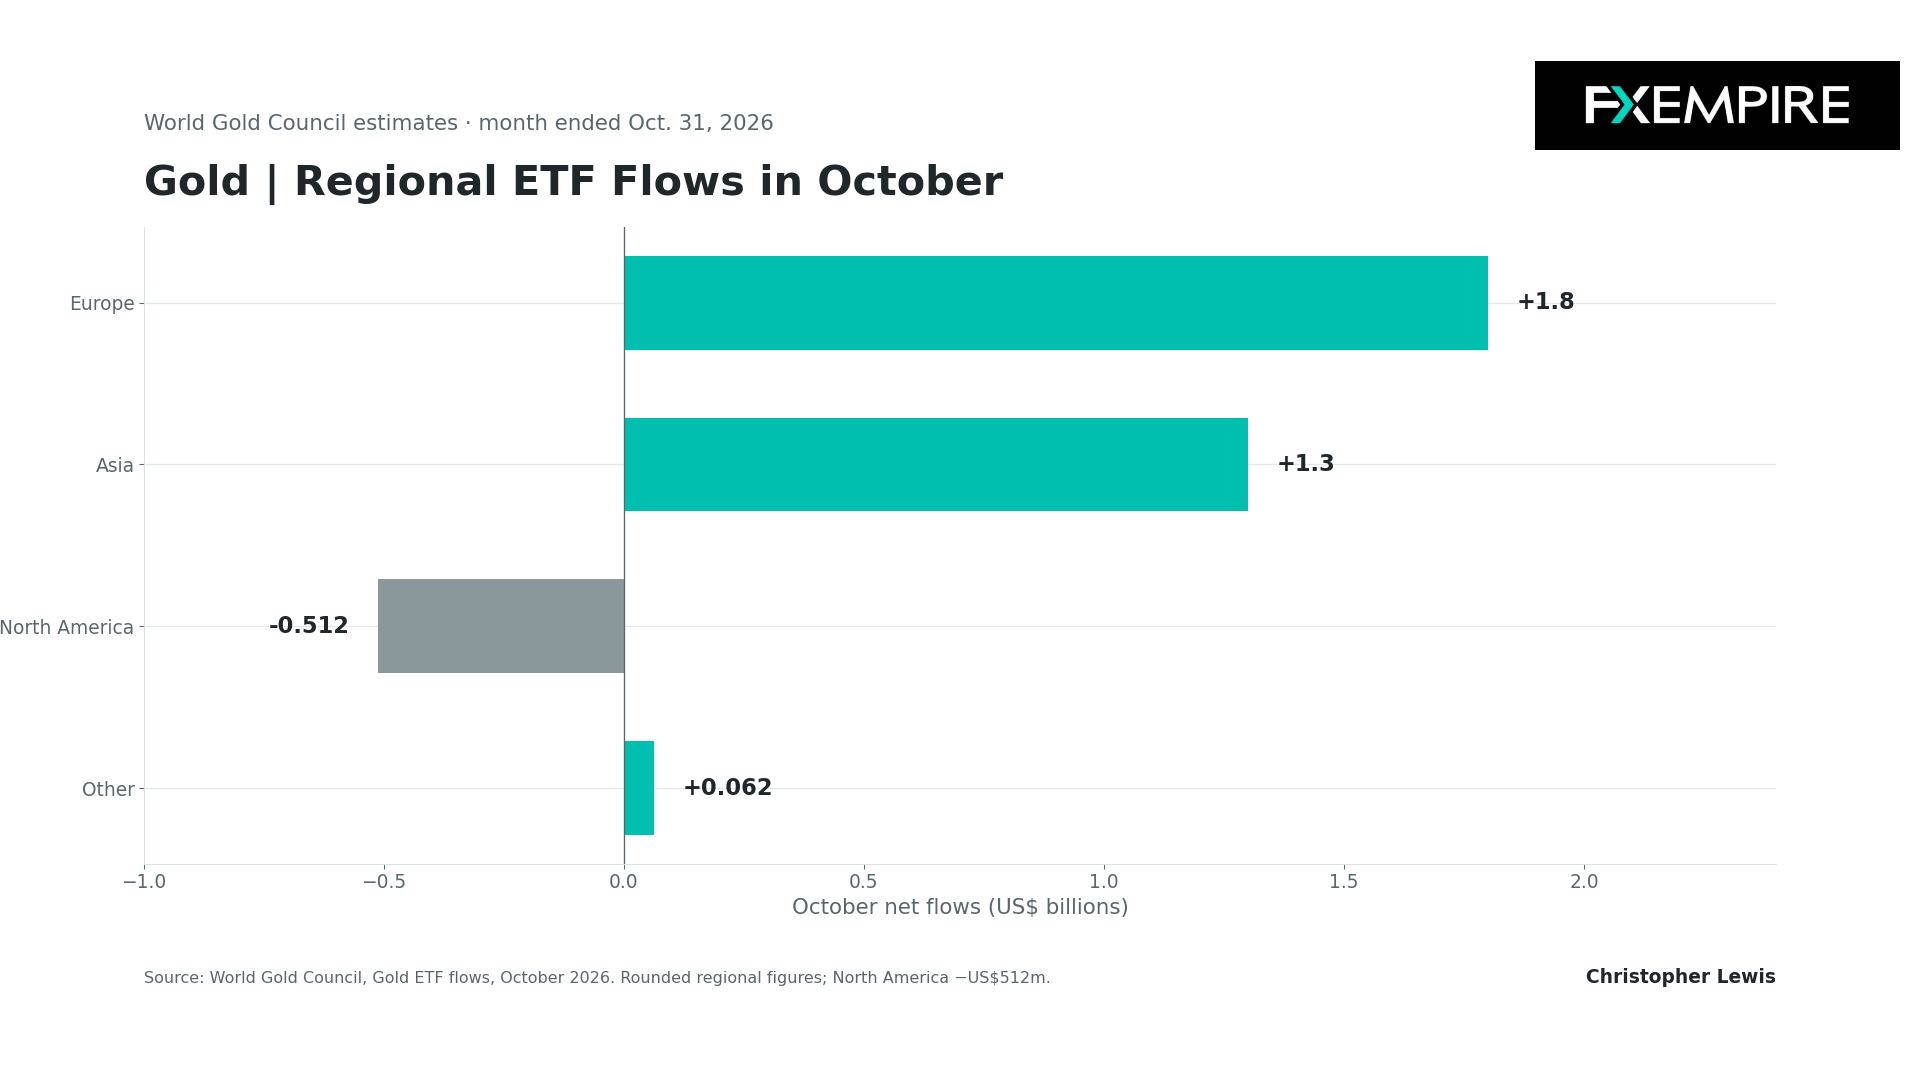
The WGC’s figures are compiled from fund holdings and flows and should be treated as industry data rather than a government statistic. The split is useful, though, for analytics, as European and Asian inflows suggest that some investors continue to treat gold as portfolio protection or a way to participate in the metal’s longer-term demand story. North American redemptions, however, are consistent with investors reassessing the opportunity cost of holding bullion or raising cash after volatility.
Central Bank Purchases
Central-bank purchases remain another structural source of demand, but the most recent comprehensive quarterly figures are not necessarily a daily signal. The WGC’s third-quarter demand report put central-bank buying at 321 tons, 42% above the same quarter a year earlier, and the strongest quarter since Q4 2024. Year-to-date central-bank purchases totaled 675 tons through September. Total Q3 demand, including over-the-counter activity, was 1,369 tons, down 1% year over year. This combination suggests official buying remains substantial even as total demand was very little changed.
For the session ahead, the main observable test will be the direction of real yields and the U.S. dollar, alongside whether ETF demand remains broad across regions. A retreat in real yields would ease one clear hurdle for bullion. A persistent rise would require stronger safe-haven or official-sector demand to offset it.
The latest reported ETF flows are October totals, and the latest Treasury yield observations are from November 16. Neither should be presented or thought of as a live signal, but they do give us a backdrop as to what is happening.
The Charts
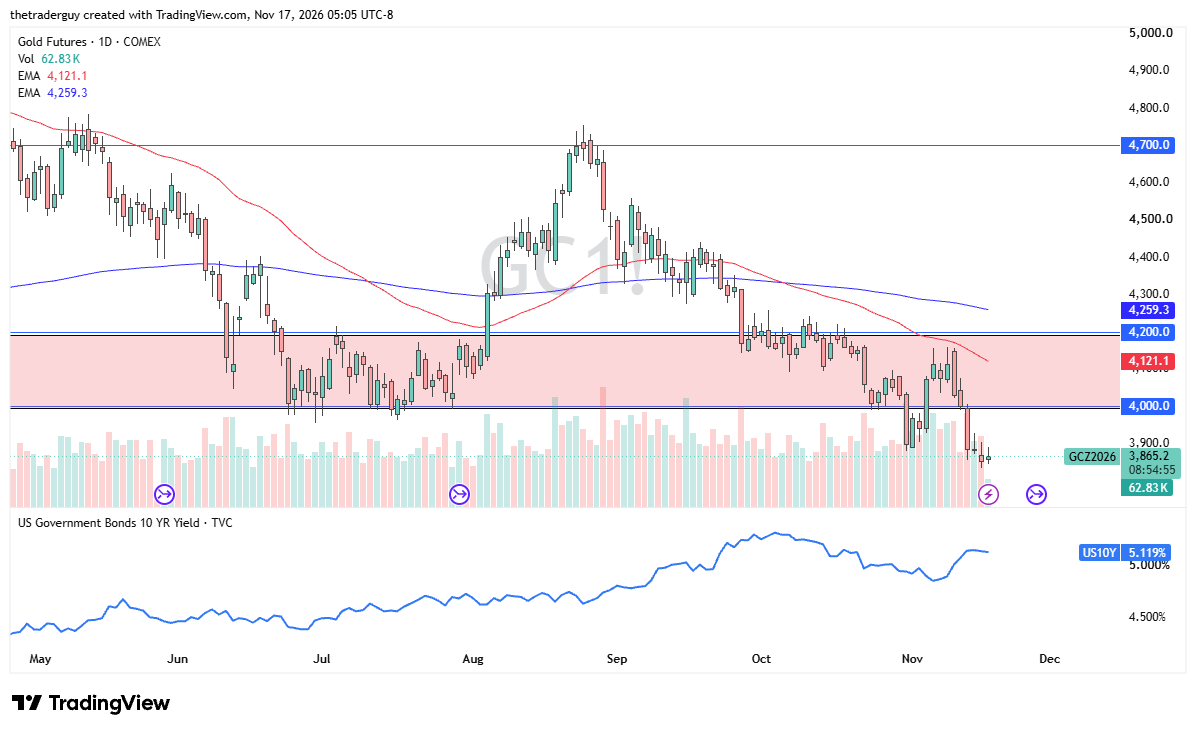
From a technical-analysis standpoint, it looks like gold has nowhere to go as we are simply bumping along the $3,850 level. A breakdown from here could open the door to levels such as $3,600, but rallies also have to be looked at as potential selling opportunities in a market that simply cannot seem to pick up its feet.
If you’d like to know more about how to trade gold and silver, please visit our educational area.