



Gold Shorts Reassess Ahead of Fed Decision
At the start of the new week, gold traders received some relief from lower oil prices. Nonetheless, the move looked more like positioning rather than a trend-changing event as traders continued to deal with inflationary concerns due to overall elevated crude prices.
We’ve probably seen some lightening up ahead of today’s Fed interest rate decision, policy statement and the Chair’s comments. The key takeaways from this meeting are where Fed members stand on inflation and whether they signal that additional rate hikes will be needed to get inflation under control.
According to the FedWatch tool, the Fed is widely expected to hold rates in the 3.75% to 4.00% range with a probability of 90.6%. The probability of a 25-basis point increase in December is 76.5% and a 50-basis point increase is 7.8%.
Inflation Outlook Holds the Key
Going into the Fed decision, I think that traders are looking at two scenarios. A surprise rate hike in October would likely be bearish for gold. It would probably send prices below the October 2025 bottom at $3886.46.
The second scenario would be the Fed’s outlook on inflation. Let’s face it, the inflation numbers have been higher, but pretty tame. But if crude oil stays above $100 per barrel for longer, that outlook could flip pretty quickly and the Fed would have to act accordingly, especially since it has a 2% inflation target.
A year ago, gold started a major rally on October 28 at $3886.40. The catalyst was expectations of 2 to 3 rate cuts in 2026. At the same time, it is a different scenario. This time the market is expecting 1 to 2 rate hikes. That may not be outright bearish, but it may be enough to keep a lid on prices.
Weekly Spot Gold (XAUUSD) Technical Analysis
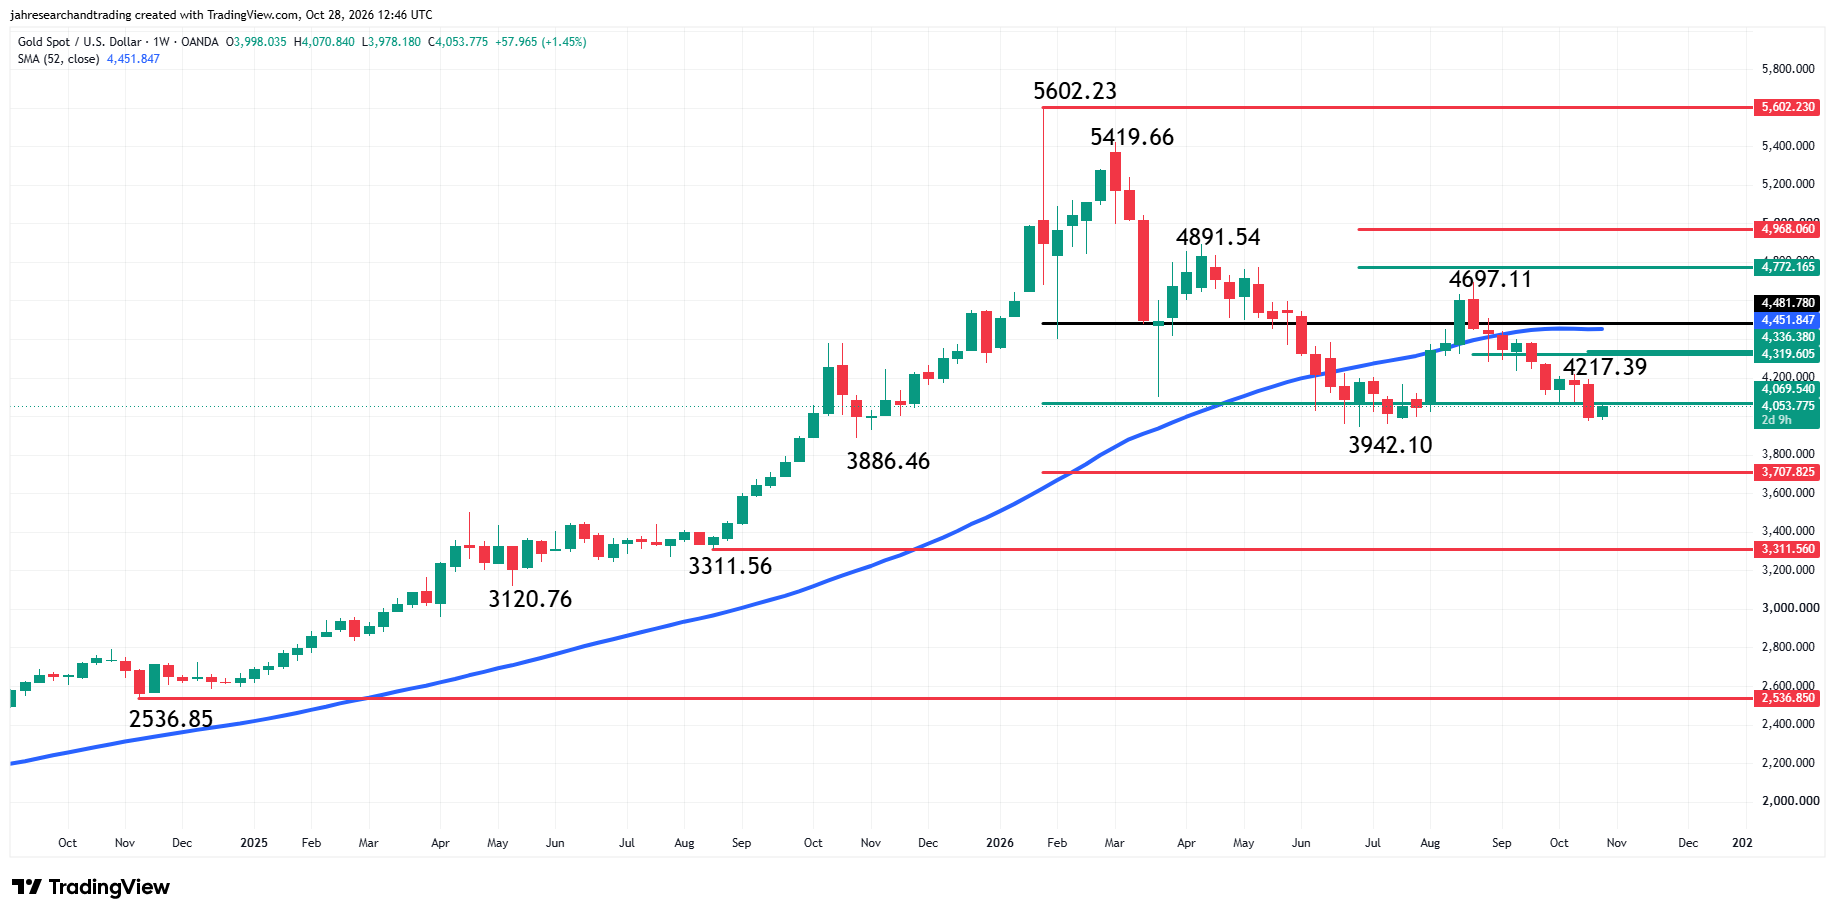
Spot gold is marginally higher for the week with buyers stepping in just ahead of last Friday’s low at $3975.65. That low was a little above the June bottom at $3942.10.
Gold Price Forecast
Every new Gold analysis as it publishes, today's technical signal and key levels, live price — on one page.
See all Gold forecastsThe main trend is down according to the weekly swing chart. A trade through the weekly swing bottom at $3942.10 will signal a resumption of the downtrend. The main trend will change to up on a trade through the swing top at $4697.11.
The minor trend is also down. A trade through $4217.39 will change the minor trend to up. This could shift momentum to the upside.
The short-term range is $5602.23 to $3942.10. Its retracement zone resistance is $4772.16 to $4968.06.
The minor range is $3942.10 to $4697.11. Its 50% level at $4319.60 and another minor pivot at $4336.38 are the nearest resistance.
The long-term range is $2536.85 to $5602.23. The market is currently testing its 50% to 61.8% retracement zone at $4069.54 to $3707.82. It held once before at $3942.10.
On the upside, prices are still being capped by the 52-week moving average at $4451.79. This indicator is just below $4481.78, or the level which started the bear market.
Daily Spot Gold (XAUUSD) Technical Analysis
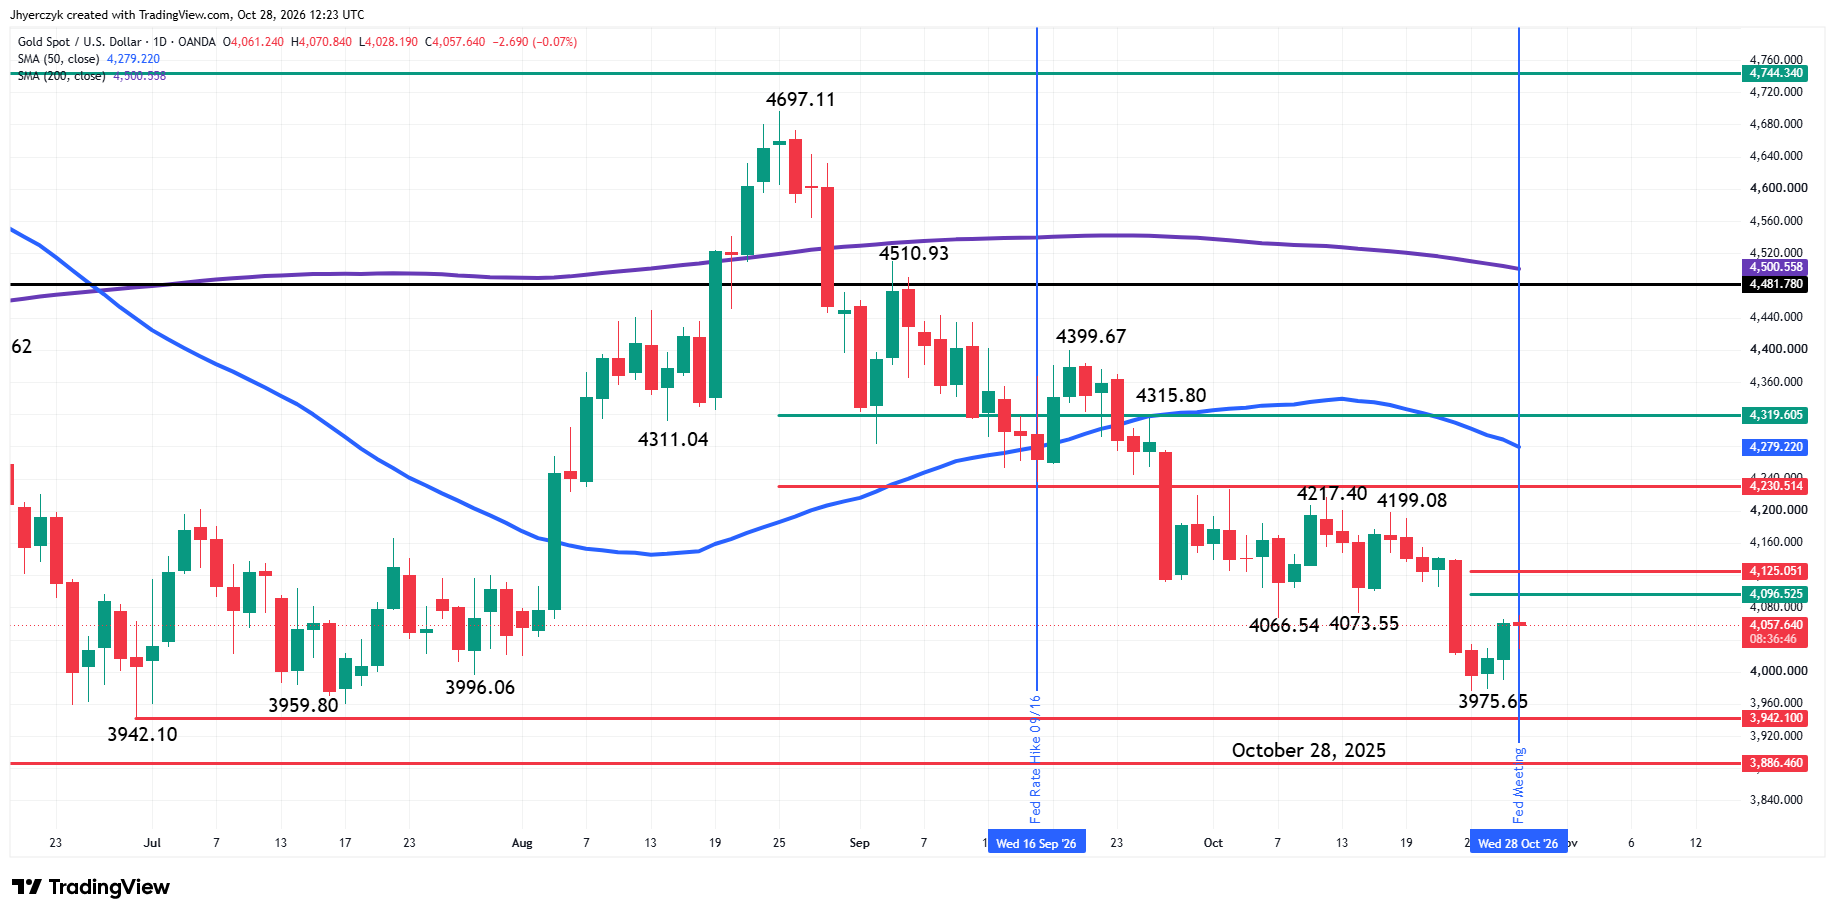
Spot gold is lower early Wednesday after giving back earlier gains. The main trend is down according to the daily swing chart. A trade through $4199.08 will change the main trend to up. The new swing bottom is $3975.65. A trade through this level will signal a resumption of the downtrend.
The short-term range is $4217.40 to $3975.65. Its retracement zone at $4096.52 to 4125.05 is the key area to watch today. It can be either resistance or the trigger point for an acceleration to the upside.
Additional resistance is the intermediate retracement zone at $4230.51 to $4319.60. Inside this zone is the 50-day moving average at $4279.26, which could be both resistance and a trend indicator.
The major long-term support under $3975.65 is $3942.10 and $3886.46.
What to Watch
Daily Spot Gold (XAUUSD)
Looking at the spot gold chart, my bias is to the downside because of the downtrend on the main swing chart and the trade on the bearish side of the 50-day moving average at $4279.26.
Trader reaction to the retracement zone at $4096.52 to $4125.05 will either support my outlook or weaken my outlook.
A sustained move under $4096.52 will indicate the presence of sellers. If this move creates enough downside momentum then look for the selling to extend into the main bottom at $3975.65. Taking out this level will strengthen my outlook with $3942.10 and $3886.46 the next major downside targets.
A sustained move over $4125.05 will signal the presence of buyers. This will weaken my outlook. If momentum shifts to the upside then buyers could take a shot at the two main tops at $4199.08 and $4217.40.
The main trend will change to up over $4199.08 and get reaffirmed if $4217.40 is taken out. However, don’t expect to see a substantial breakout because of the intermediate retracement zone at $4230.51 to $4319.60 including the 50-day moving average at $4279.26.
Weekly Spot Gold (XAUUSD)
The bear market indicator at $4481.78, the 52-week moving average at $4451.79 and the downtrend on the weekly main swing chart, all support my bearish bias. A failure to break through $3942.10, followed by a sustained move over the pivots at $4319.60 and $4336.38, will weaken my outlook.
If you’d like to know more about how to trade gold, please visit our educational area.