



Gold (XAU) price remains under pressure below $3,800 on Thursday and continues to drop further as the US dollar and US Treasury yields do not show any signs of correction. The gold price has reached the lowest levels since September 2025 while the US dollar index has traded near the 19-month high. The latest Fed minutes suggest further Fed tightening. The Dow to gold ratio is rebounding from key support which suggests the case for further decline in the gold price.
Why Gold Prices Are Falling: Strong Dollar and High Yields
Fed Minutes and High Treasury Yields Pressure Gold
The Fed minutes for October were released on Wednesday and showed that almost all participants favoured further rate hikes as their baseline scenario. They expected that if the inflation outlook remains unfavourable, the possibility of 25 basis points increase or more may become the case.
The expectations of high interest rates keep the gold price under pressure as the US dollar continues to gain momentum. The next meeting by the Fed is on 8-9 December, which may provide further direction to gold prices.
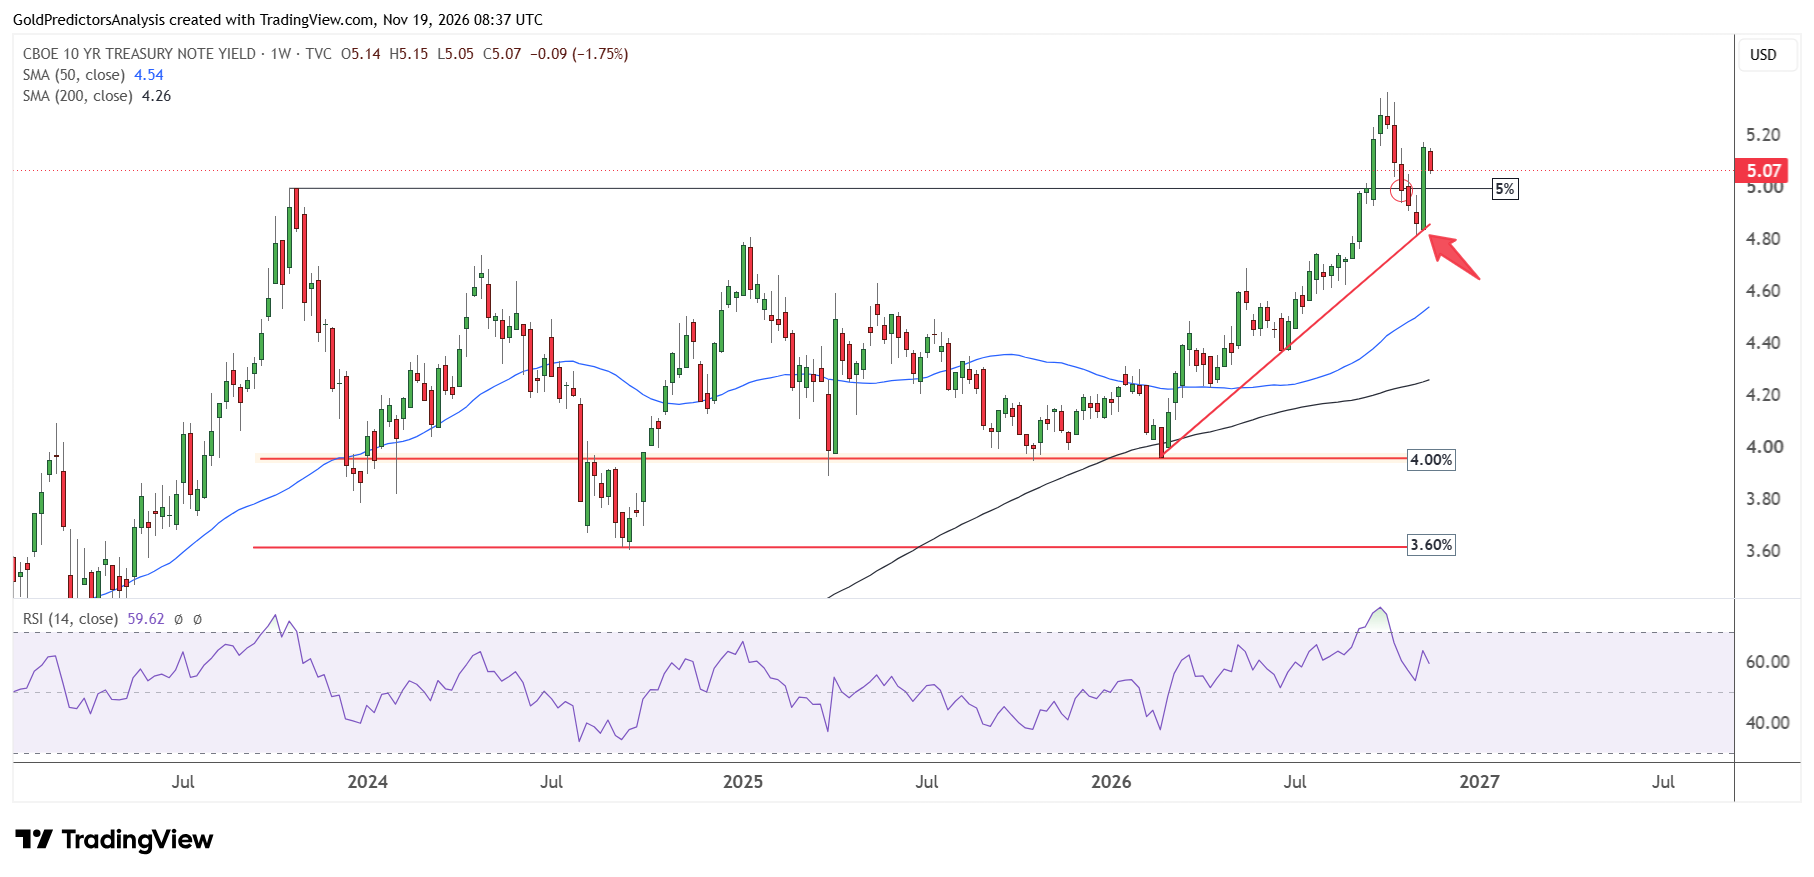
The US Treasury yields remain elevated. The chart below shows that the 10-year US Treasury yields have surged after the release of CPI data. However, the yields eased slightly this week but still remain elevated.
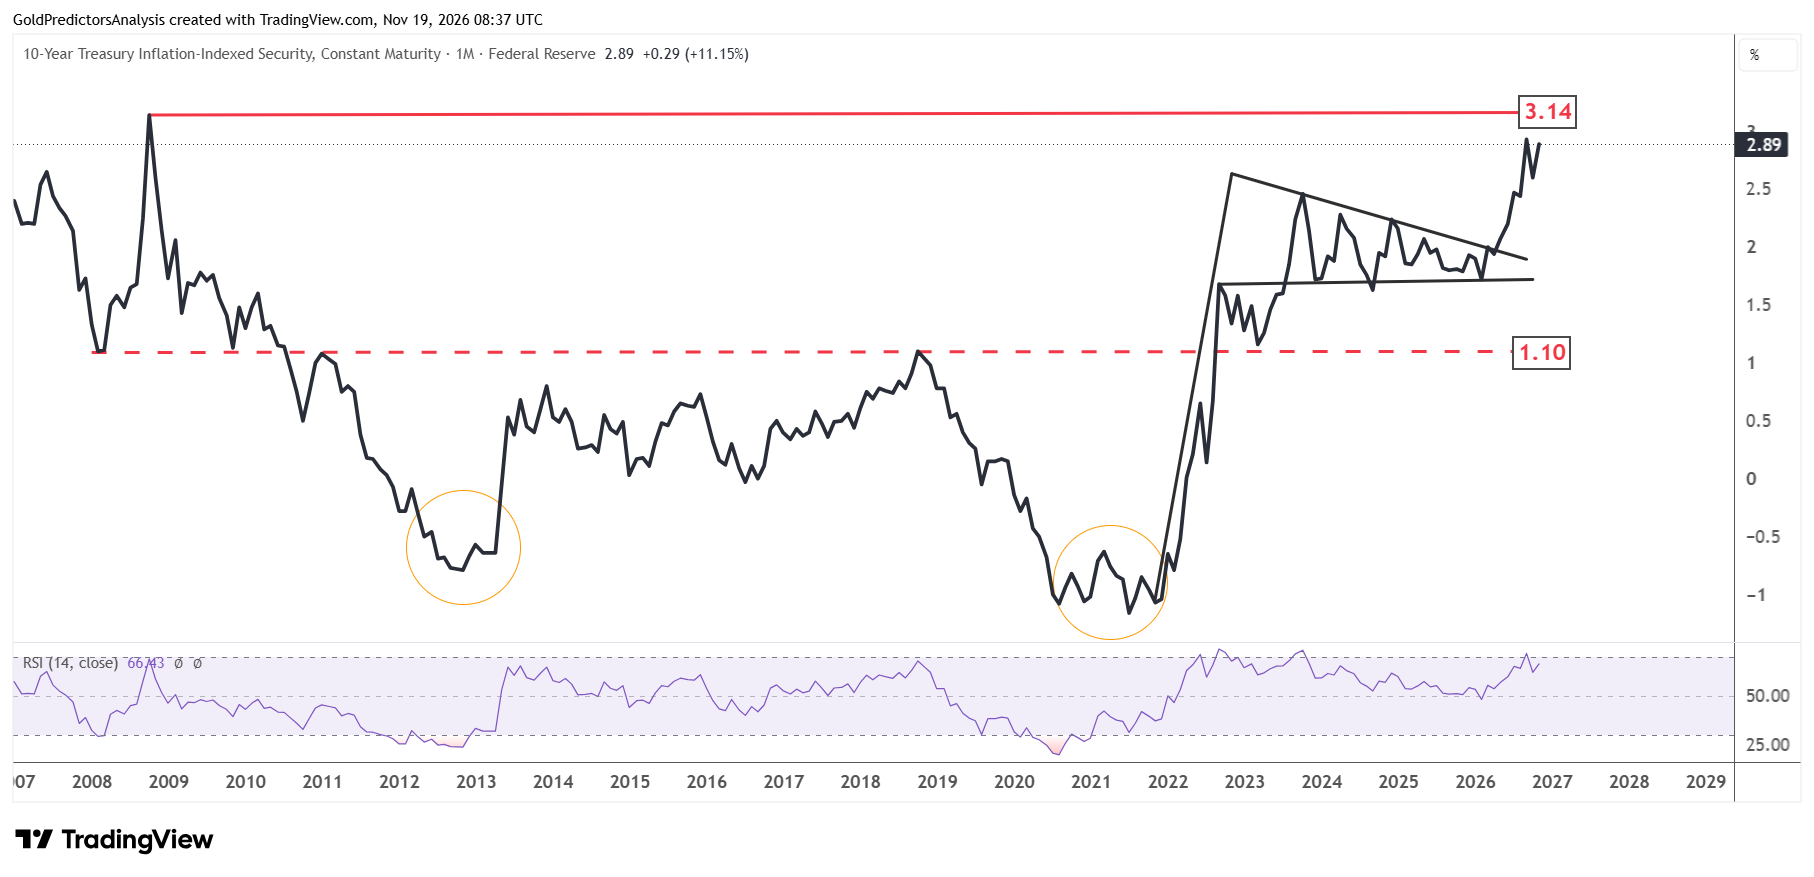
The real yields also remain elevated at 2.89% after the breakout from the triangle pattern in April 2026. The key resistance in the real yields is 3.14%. Gold prices may remain under pressure as long as the real yields continue to increase.
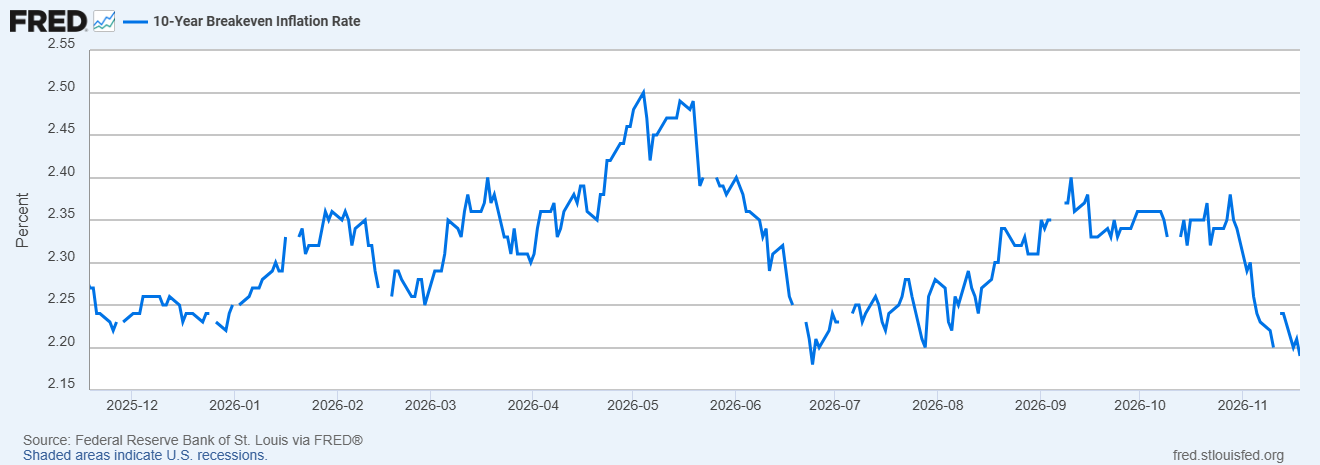
The 10-year breakeven inflation dropped to 2.19% on Wednesday which measures the market inflation compensation.
Gold Price Forecast
Every new Gold analysis as it publishes, today's technical signal and key levels, live price — on one page.
See all Gold forecastsStrong Dollar and Stock Market Volatility Weigh on Gold
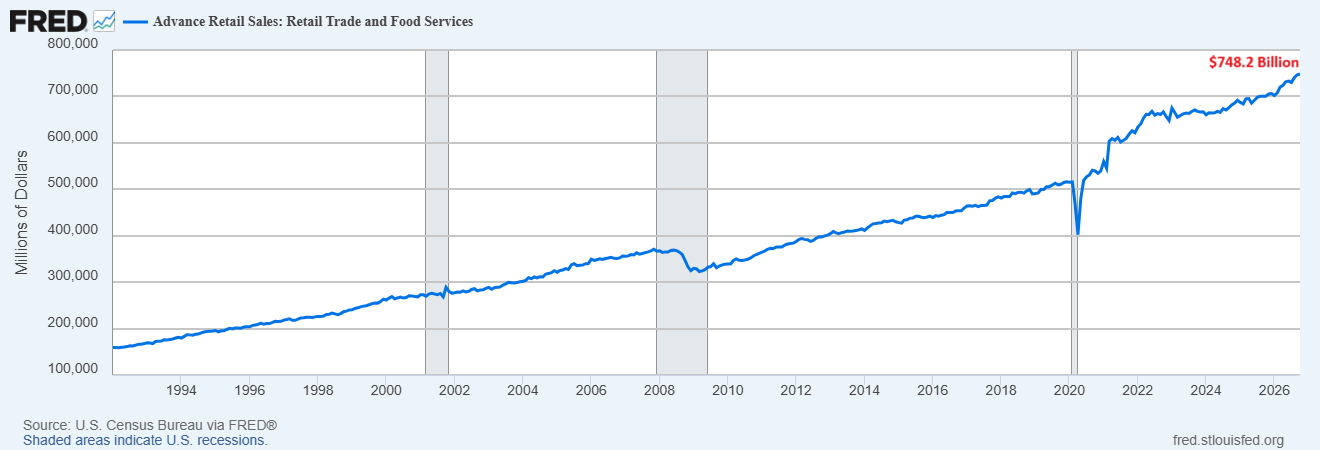
The weakness in gold comes from the strength in the US dollar. The US dollar index continues to increase after the breakout from the 101.80 level. The chart below shows that US Retail sales increased to $748.22 billion which is up 0.2% from September. The retail sales data show slow growth in spending.
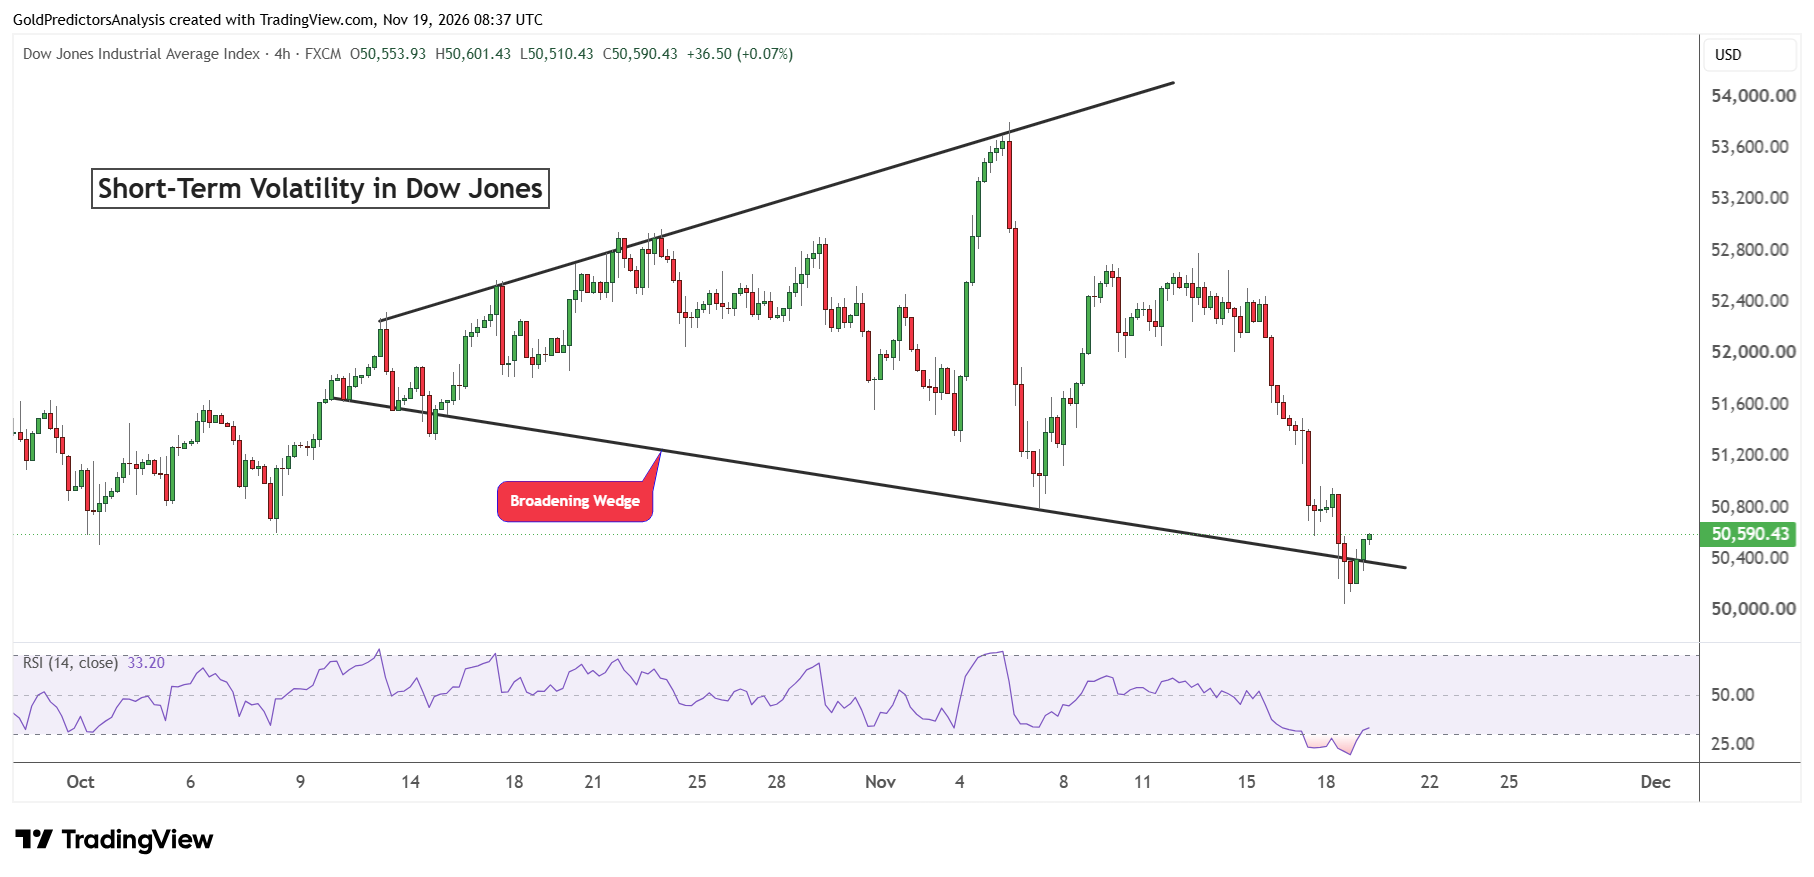
The US stock market also remains under pressure. The S&P 500 has lost over 3% for the week, Nasdaq 100 was down over 1% before a strong recovery on Thursday and the Dow Jones 30 is down over 3% for the week as of Thursday. The chart below shows that the Dow Jones has hit the support and formed the broadening wedge pattern. This suggests heavy volatility in stocks.
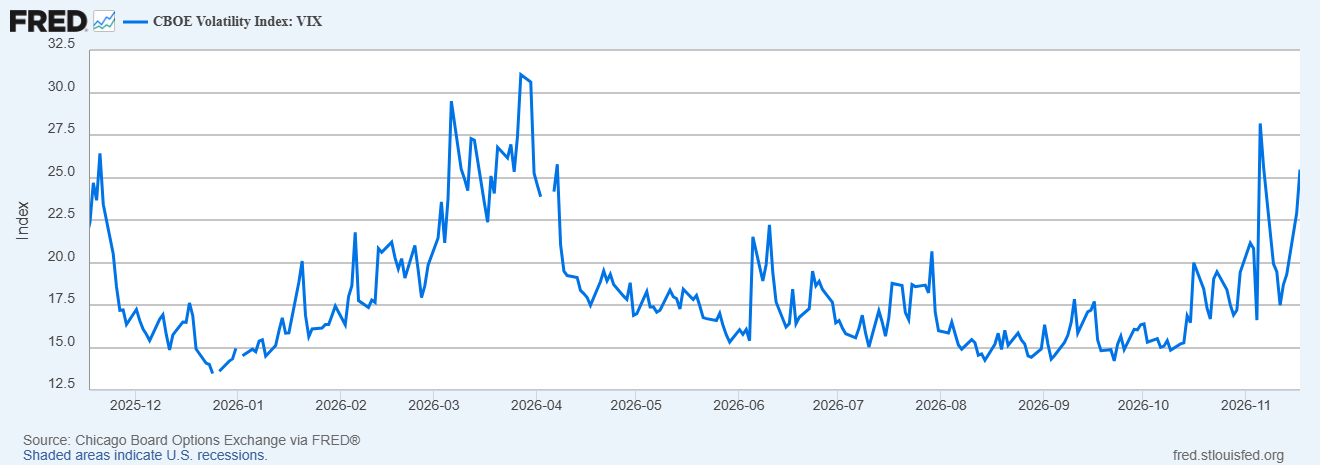
The volatility in equities has increased significantly as the volatility index has increased to 25.46. The financial conditions may remain tight, which may pressure stocks and gold.
Dow-to-Gold Ratio: What It Signals for Gold’s Next Move
The chart below shows the Dow to gold ratio, which may be considered an important tool to identify the major bottoms in gold. The increase in the ratio means that stocks are gaining ground against gold.
It is observed that gold prices mark a major bottom when the Dow to gold ratio confirms major top. Meanwhile, the major top in gold is developed when the ratio produced a bottom.
Gold price produced a major top at $873 in 1980 and $1921 in 2011 when the ratio produced a low. The lows in the ratio in 1980 and 2011 formed an ascending trend line that aligns with the lows in 2026 when the ratio again hit this line.
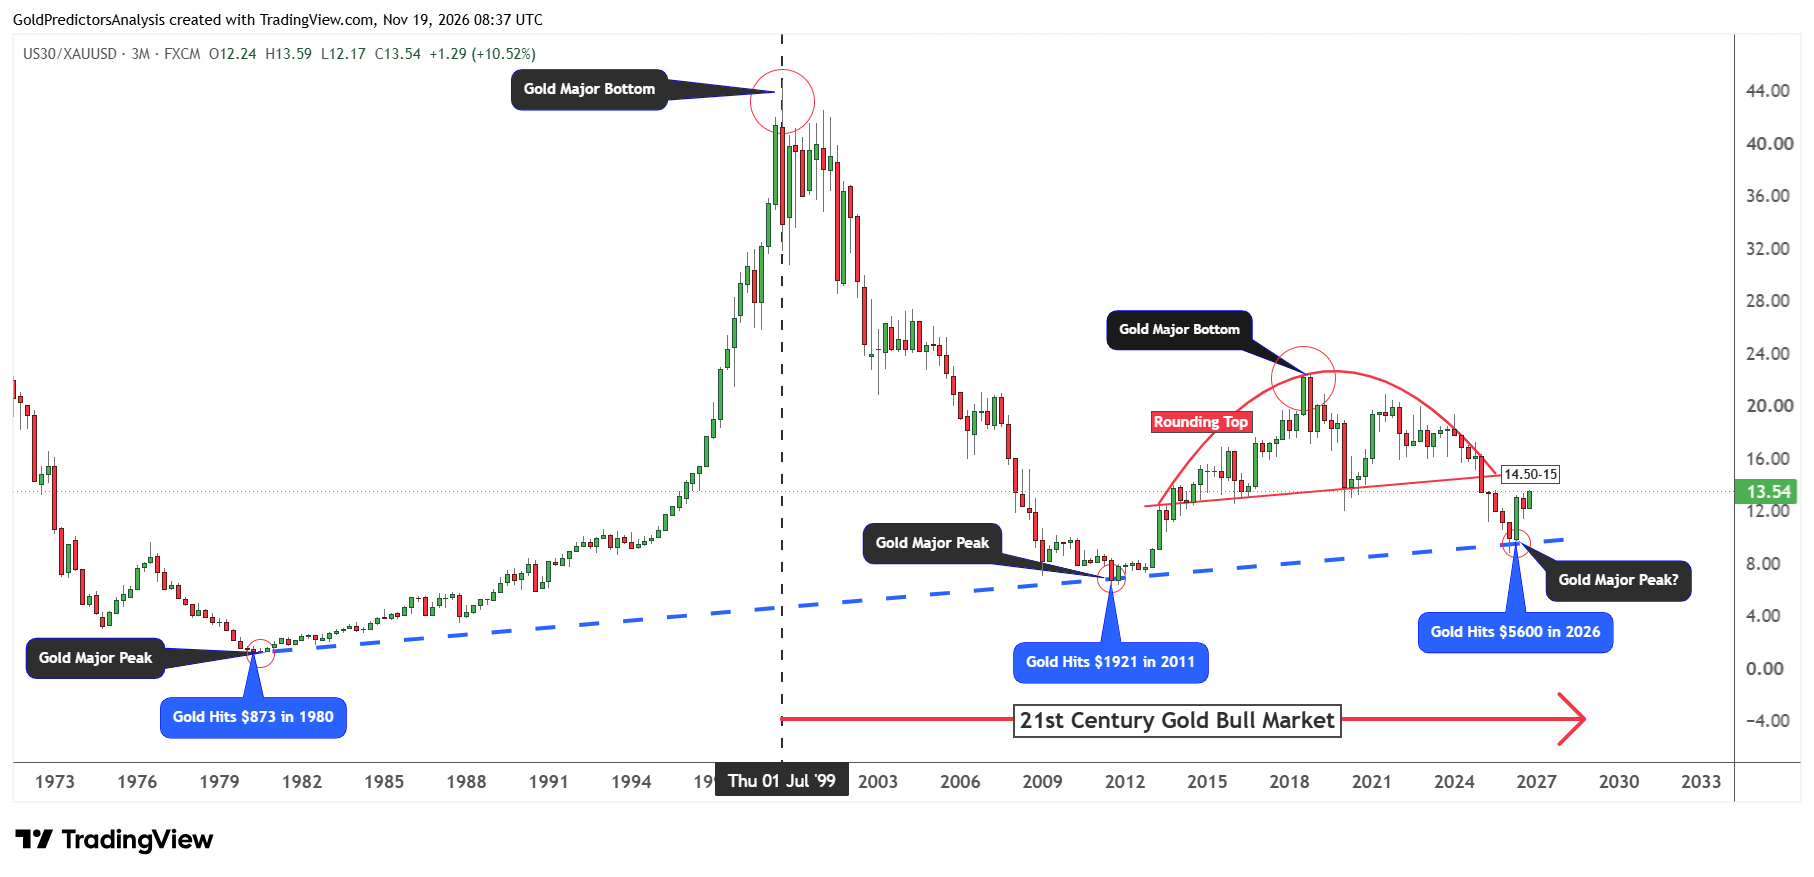
When the ratio hit this line, the gold price marked a record high at $5,600 and dropped significantly. The ratio lost over 30% from the peak in 2026. Now the ratio is rebounding from lows, which is aligned with the deeper correction.
This indicates that when the ratio marks a high and continues to drop, it may provide the case for next bottom in gold. The ratio has already reached the resistance and the next significant resistance in the ratio is near the 14.50-15 level, which is the neckline of the rounding top pattern.
Gold Price Forecast: Key Support at $3,500–$3,600
From a technical perspective, the gold price has broken the key level of $3,900-$4,000 and continues to drop towards the major support levels. The first support zone lies between $ 3,500 and $ 3,600.
A break below this zone may push the price to $3,000-$3,200. But a rebound is expected from the key support zone of $3,500-$3,600. Gold price needs to recover above the $4,000 level to confirm bottom and move towards $4,400.
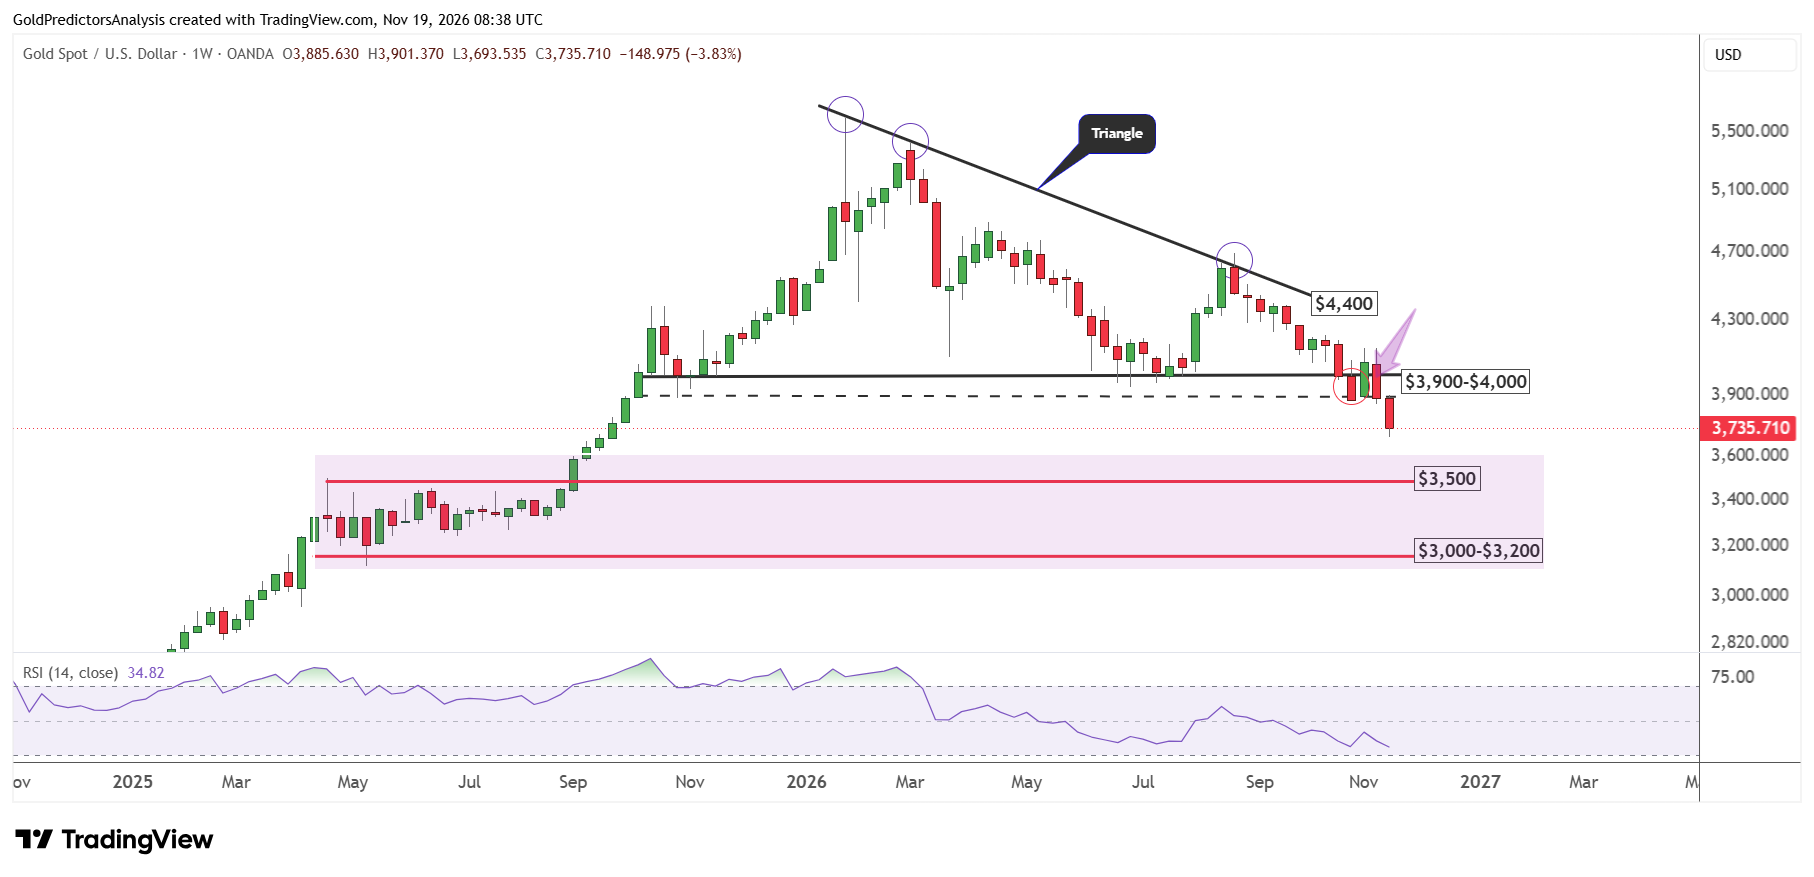
The RSI indicator still remains above the oversold region which suggests that prices may further drop before the bottom. If the gold price continues to drop toward the $3,500-$3,600 range, the RSI will enter the oversold region similar to 2018, when the gold price produced a major low.
What Could Trigger a Rebound?
The short term outlook for gold remains weak as the strong US dollar and elevated US Treasury yields continue to pressure metals. The expectations of high interest rates keep the gold price under pressure. A correction in US dollar or real yields may create a rebound in gold prices.
The Dow to gold ratio faces important resistance near 14.5-15. If the ratio fails to break above this zone and continues to drop, it may signal that gold is gaining strength against stocks. The key support for gold remains the $3,500-$3,600 level where the rebound may develop. A break below $3,500 may push the metal towards $3,000-$3,200. The price must recover above $4,000 to strengthen the case for $4,400.