


Gold Holds Near $4000 as Fed Meeting Begins
Spot gold is edging lower early Tuesday ahead of the start of the Federal Reserve’s two-day policy meeting. Traders are blaming a stronger dollar for today’s weakness.
Prices fell below the psychological $4000 level for the first time since mid-to-late July last week. However, prices have been consolidating since then as traders absorbed the steep plunge. Last week’s 4% loss marked the biggest decline since June. The catalyst behind the steep loss was a surge in oil prices to a multi-month high. The move in energy led to increased inflation concerns while reinforcing U.S. rate hike expectations.
December Rate-Hike Odds Hold the Real Risk
Currently, Fed Funds traders don’t expect a rate hike on Wednesday, but they are looking for the Fed to hike rates at least a quarter point in December. Gold traders are not too worried about the outcome of this meeting, but rather what the central bankers offer in terms of fresh guidance on the outlook for interest rates.
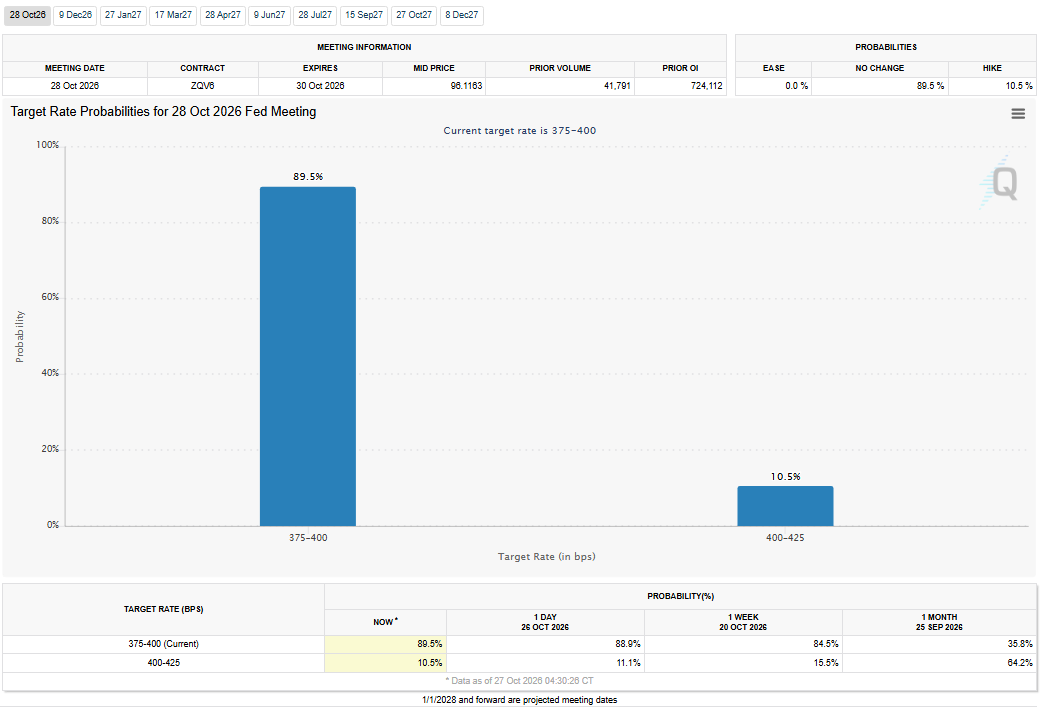
With the October FedWatch Tool showing an 89.5% probability that the Fed holds rates at 3.75% to 4.00%, the risk is to the downside for gold. If the Fed surprises and raises rates 25 basis points, gold prices would likely plunge. However, it would probably take a huge spike in crude oil prices today to convince Fed policymakers to make the move.
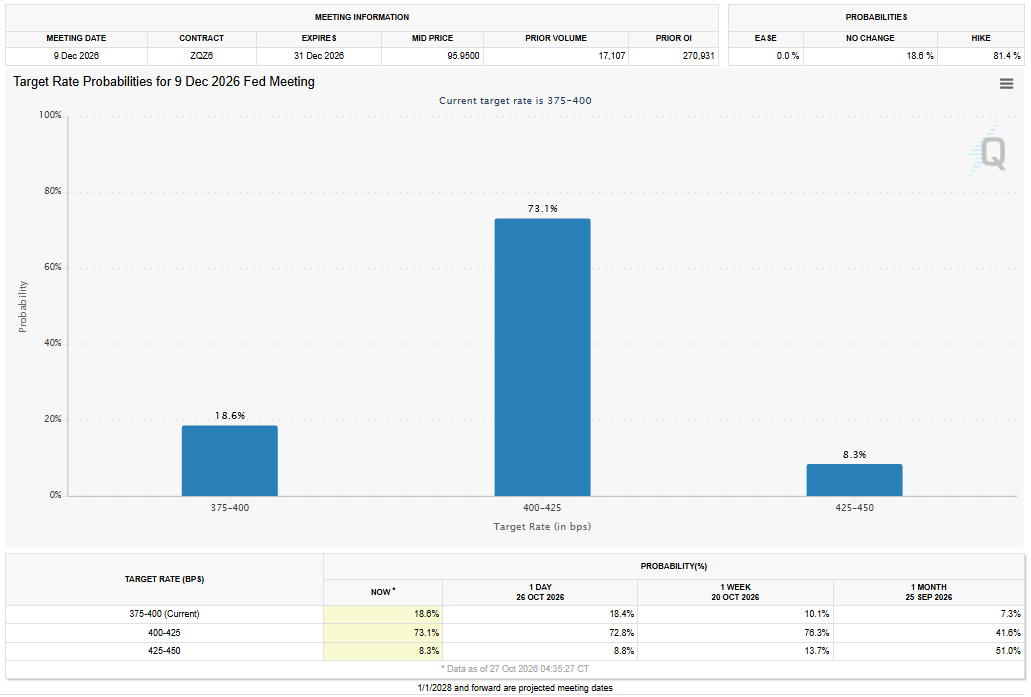
For December, there is an 18.6% probability the Fed holds rates steady, a 73.1% chance of a 25-basis-point rate hike and an 8.3% chance of a 50-basis-point rate hike. A dovish Fed outlook is likely to raise the probability of no rate hike in December and lower the odds of a rate hike. This would be supportive for gold prices.
Gold Price Forecast
Every new Gold analysis as it publishes, today's technical signal and key levels, live price — on one page.
See all Gold forecastsPCE Could Reset December FedWatch Odds
The PCE report is due Thursday, one day after the Fed’s rate decision. The Fed watches this report closely since it is less sensitive than the CPI report. Headline PCE is forecast to rise to 3.6% annually, up from 3.4%. Core PCE is expected to tick up to 3.1% from 3.0%. Exceeding these estimates would likely be bearish for gold.
A hotter-than-expected report would likely raise the odds of one or two rate hikes in December. This would cap a rise in gold prices and could also send prices lower, but it would not be bullish news.
Since the PCE report comes out at 12:30 GMT Thursday, you’re going to want to watch how the FedWatch Tool reacts after the release, especially the December rate-hike probabilities.
Daily Spot Gold (XAUUSD) Technical Analysis
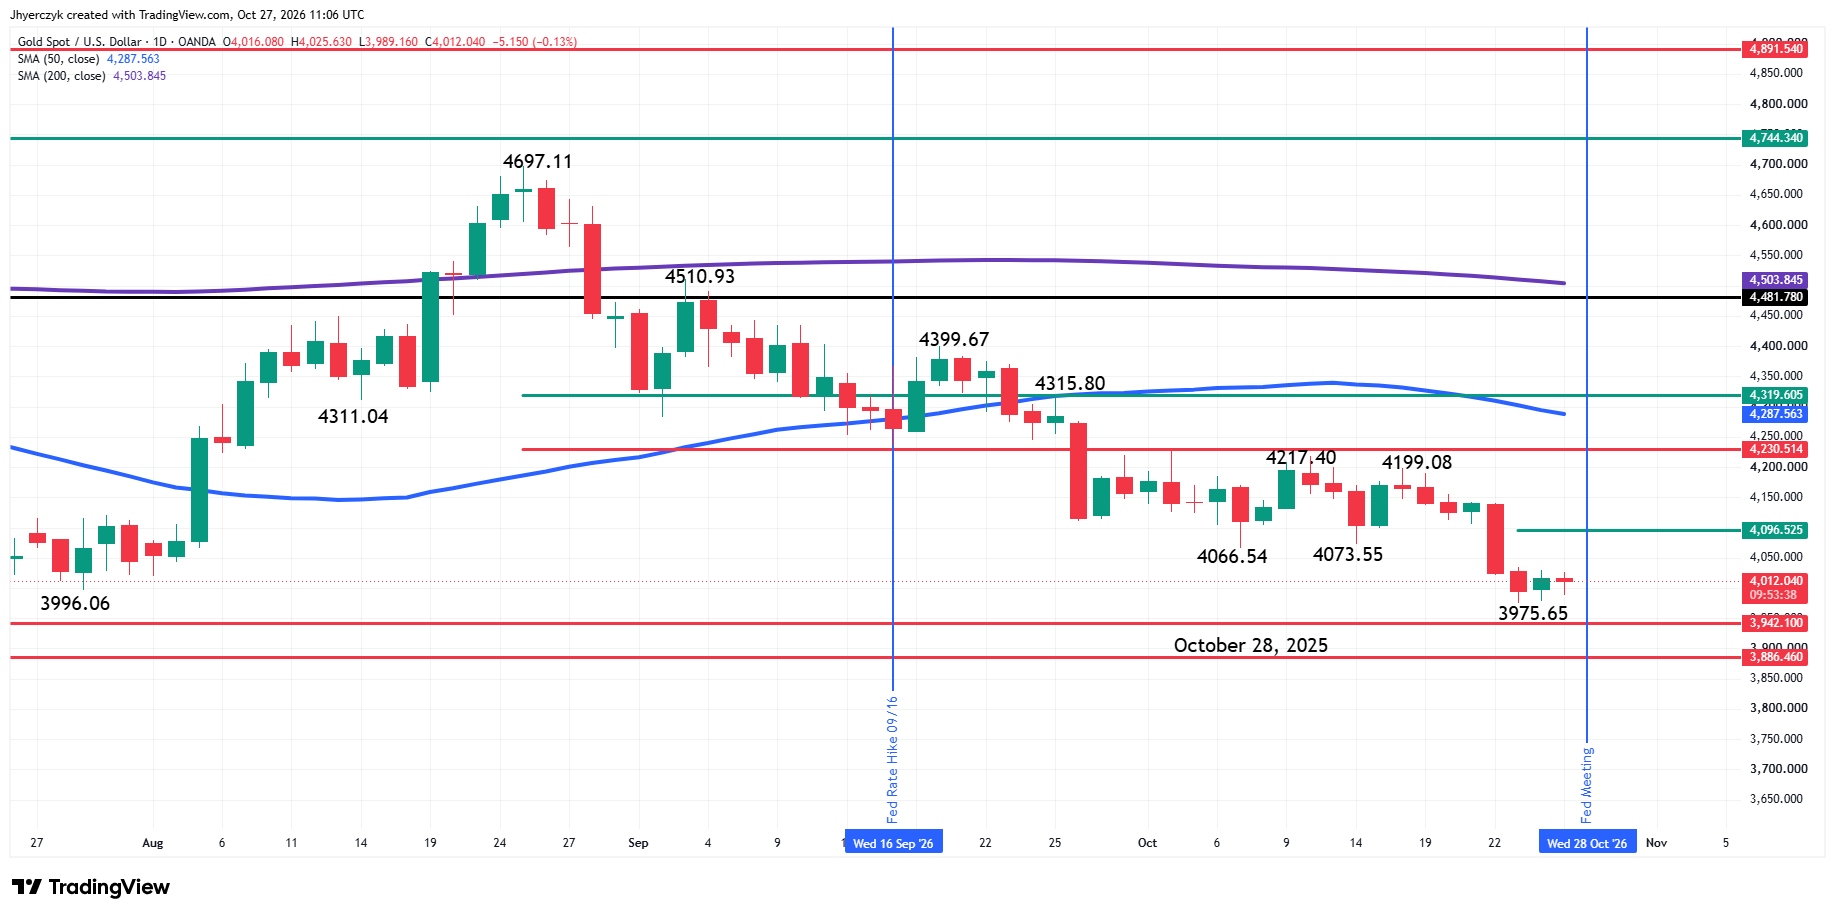
Spot gold is in a downtrend. The main trend indicator shows that a trade through $3975.65 will signal a resumption of the downtrend. This could send prices plunging into long-term bottoms at $3942.10 and $3886.46. The latter was recorded on October 28, 2025.
Gold bottomed a year ago at $3886.46 because the market began pricing in 2 or 3 rate cuts in 2026. Ironically, we’re nearly at this price again and traders may be calling for 2 or 3 rate hikes starting in December 2026 and extending into 2027. This tells me that this could be the key pivot price to watch going forward.
There are two main tops at $4199.08 and $4217.40 standing in the way of a change in trend to the upside, according to the swing chart.
The short-term range is $4217.40 to $3975.65. Its 50% level at $4096.52 is an upside resistance target. The intermediate resistance is the retracement zone at $4230.51 to $4319.60. Sitting inside this zone is the 50-day moving average at $4287.52.
On the weekly chart, spot gold is in a downtrend. A trade through $3942.10 will reaffirm the downtrend. A trade through $4697.11 will change the main trend to up. The minor trend is also down. A trade through $4217.39 will change the minor trend to up.
A key resistance cluster comes in at $4319.60 to $4336.38. This is followed by the 52-week moving average at $4451.05.
The trade under $4481.78 means that spot gold is in a bear market. It’s 20% down from the all-time high at $5602.23. Overcoming $4481.78 will take the market out of bear market territory, but it won’t mean we’re in a bull market.
What to Watch
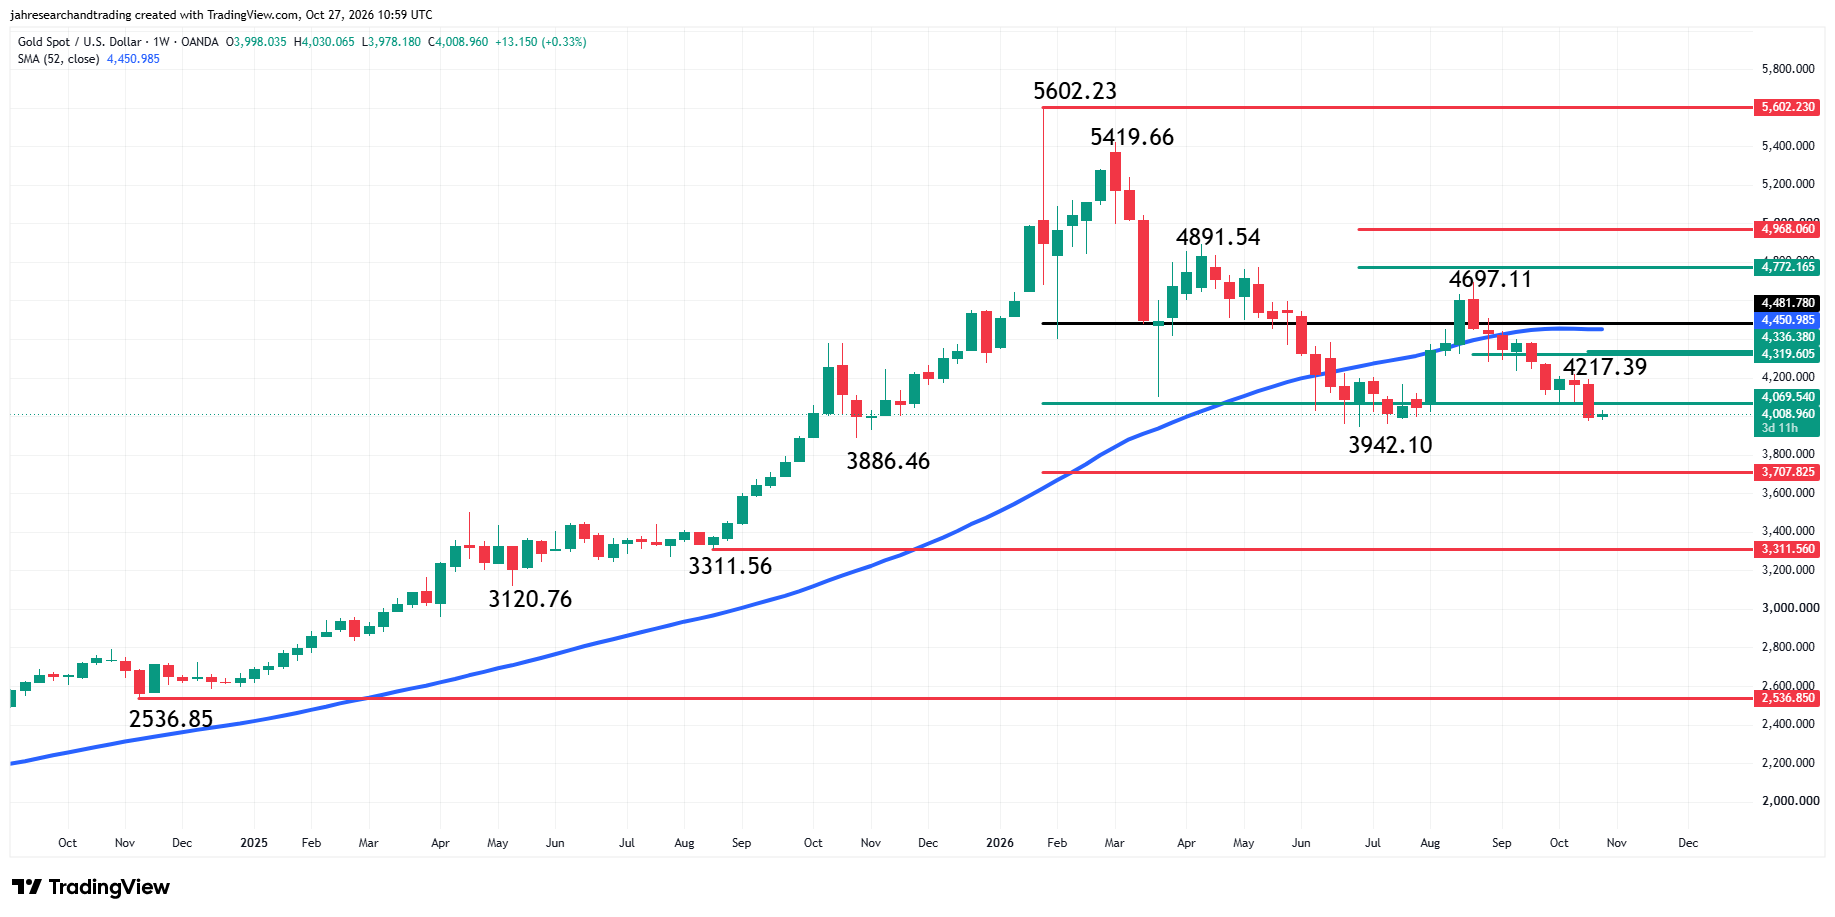
For spot gold, my bias is to the downside. It begins with the market on the bearish side of the 52-week moving average at $4451.05. Trading on the bearish side of the 50-day moving average at $4287.54 supports my outlook. The downtrend on the swing chart is another contributing factor.
A trade through $3975.65 will strengthen my outlook. Overcoming the daily chart pivot at $4096.52 will weaken my short-term outlook.
If you’d like to know more about how to trade gold, please visit our educational area.