


One of the biggest stories behind gold right now is the distinction of who has been selling in the current repricing and who has been adding to the metal over the previous quarter. Those groups do not necessarily need to be the same, and Wednesday brought another sharp drop in gold as the market repriced the possibility of additional Federal Reserve rate increases.
The Wall Street Journal reported that front-month November COMEX gold settled at $3,736.80 an ounce yesterday, down 3.16%, while December gold finished around $3,740. The daily explanation is not that difficult to understand. As the expected path of interest rates rises, the opportunity cost of holding a non-yielding asset like gold rises with it. Dollar strength can add a second obstacle for buyers measuring gold in other currencies.
Traders Are Still Repricing Fed Rates
Reuters reported on November 18 that a more hawkish interpretation of Federal Reserve communications has pushed gold to a low not seen for well over a year. This is consistent with the selloff, but it should not be expanded into a mechanical rule that yields always determine the gold price. Gold is a liquid reserve asset and can be sold to raise cash when investors need it to reduce exposure across markets.
Real Yields
The U.S. Treasury’s own real-yield data give a more disciplined way to look at the rate argument. The 10-year Treasury Inflation-Protected Security real par yield was 2.88% on November 18, compared with 2.89% on November 17 and 2.92% on November 16. Those figures are somewhat elevated, but they do not show a further daily rise in those yields on Wednesday. This is precisely why a current gold decline should not automatically be described as a result of a same-day rise in every Treasury yield. The broader expected rate path, nominal yields, the dollar, and liquidation pressure can all matter separately.
Institutional Demand Side Looks Rather Different, Though
According to the World Gold Council’s November 3 release, central banks and other official institutions bought a net 321 tonnes in the third quarter, a 42% increase from the previous year. The World Gold Council’s Q3 report also suggested gold-backed ETFs added another 211 tonnes during the quarter, reversing their second-quarter outflows.
These figures are not evidence of what investors bought or sold yesterday, but they do give us an idea of the different players in the markets. The next data point complicates the picture further. October’s global gold ETFs recorded $2.7 billion of net inflows, with Europe leading, while North America experienced a comparatively smaller outflow.
Gold Price Forecast
Every new Gold analysis as it publishes, today's technical signal and key levels, live price — on one page.
See all Gold forecasts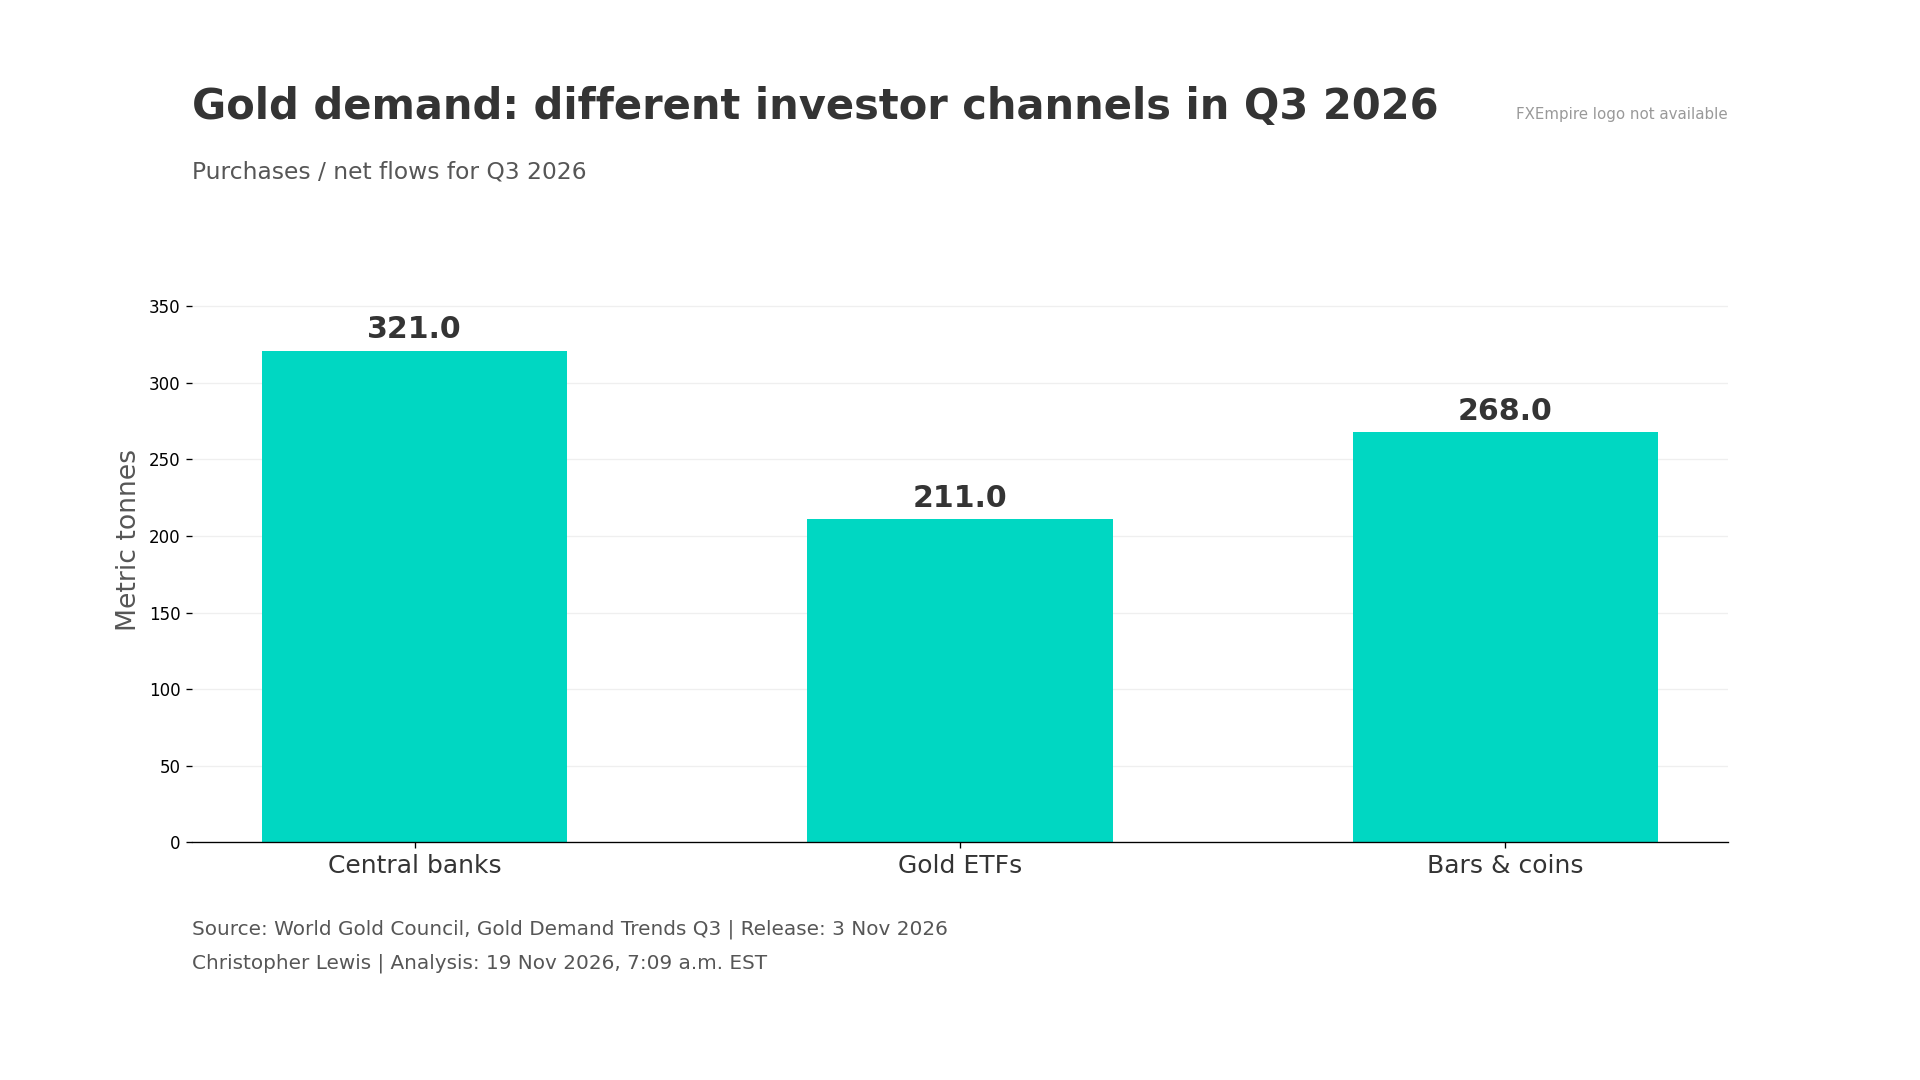
In other words, the country mix of holdings and fund flows was changing even before November saw the rapid drop in the gold market. This is more informative than treating ETF flows as a single global opinion about gold, but it gives us an idea of how much turbulence there is under the surface. Identifying support should examine whether North American selling accelerates or whether other regions can continue to absorb that selling pressure.
Physical Demand
Physical demand is not immune to price, obviously. The Council reported third-quarter jewelry demand down 17% year over year to 313 tonnes, while bar and coin demand declined 19% to 268 tonnes. These two groups reflect very different decisions from those made by reserve managers. Buyers of jewelry have historically been price-sensitive. Official-sector reserves are typically managed on much longer time horizons.
The next meaningful test will be whether the interest-rate repricing stabilizes enough for investment demand to become visible again. A single rebound over a severe fall would not confirm that process. Confirmation would be stronger if supported by easing real-rate pressure. Actual fund inflows are evidence of physical market buying. On the other hand, a continuation of forced liquidations could make otherwise constructive long-term demand statistics largely irrelevant to near-term prices.
Technical Outlook
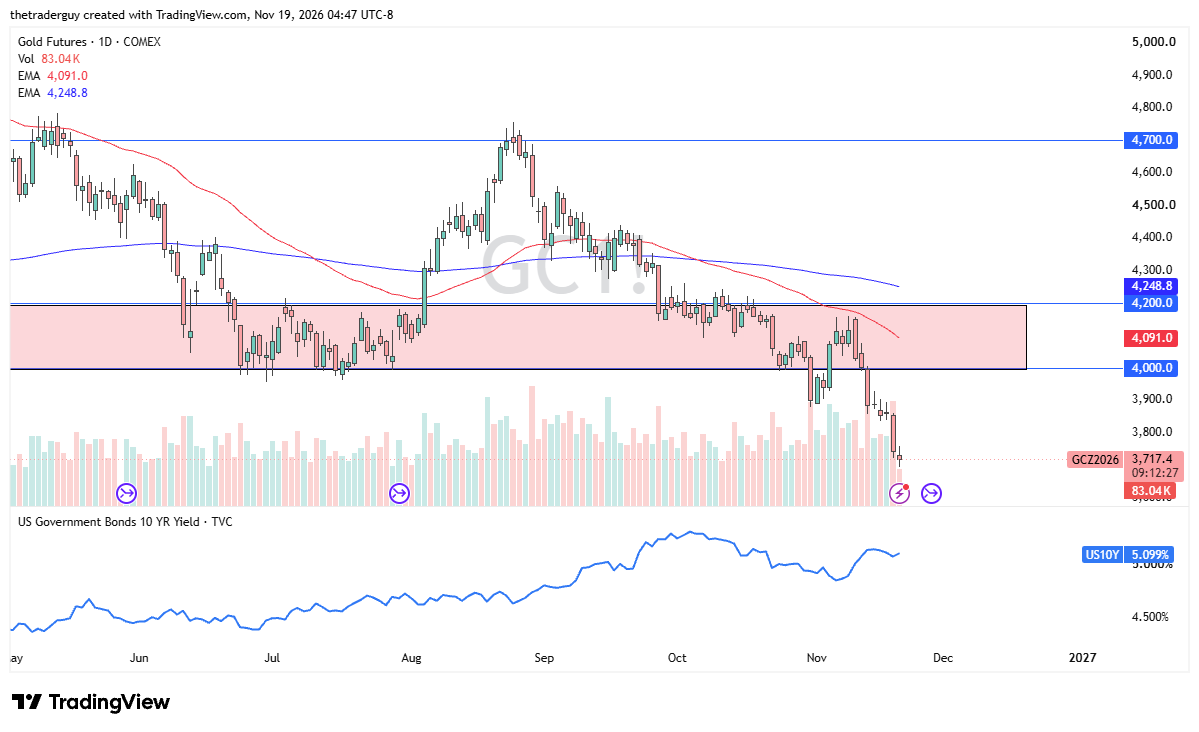
Looking at the charts, it does seem like we are trying to find some type of support, but really, at this point in time, it is an oversold market. Any bounce at this point in time, I believe, will end up being thought of as a relief rally more than anything else.
The $3,850 level is an area that previously had been support, so it could be resistance on any type of attempt at a relief rally. Signs of exhaustion after that bounce could be the signal for short sellers to jump back in. At this point, when we look at the longer-term charts, the $3,500 level is an area that previously had been resistance, and it could offer a bit of a floor.
If you’d like to know more about how to trade gold and silver, please visit our educational area.