


Enthusiasm for gold intensified on Tuesday as it broke out to a new record high. And it is on track to close strong, in the top third of the day’s price range. At the time of this writing, gold had reached a new record high of 2,773, which followed support for the day at 2,740. Today’s bullish price action puts gold in a favorable position to rally towards the next higher target zone. But that depends on seeing further signs of strength for gold.
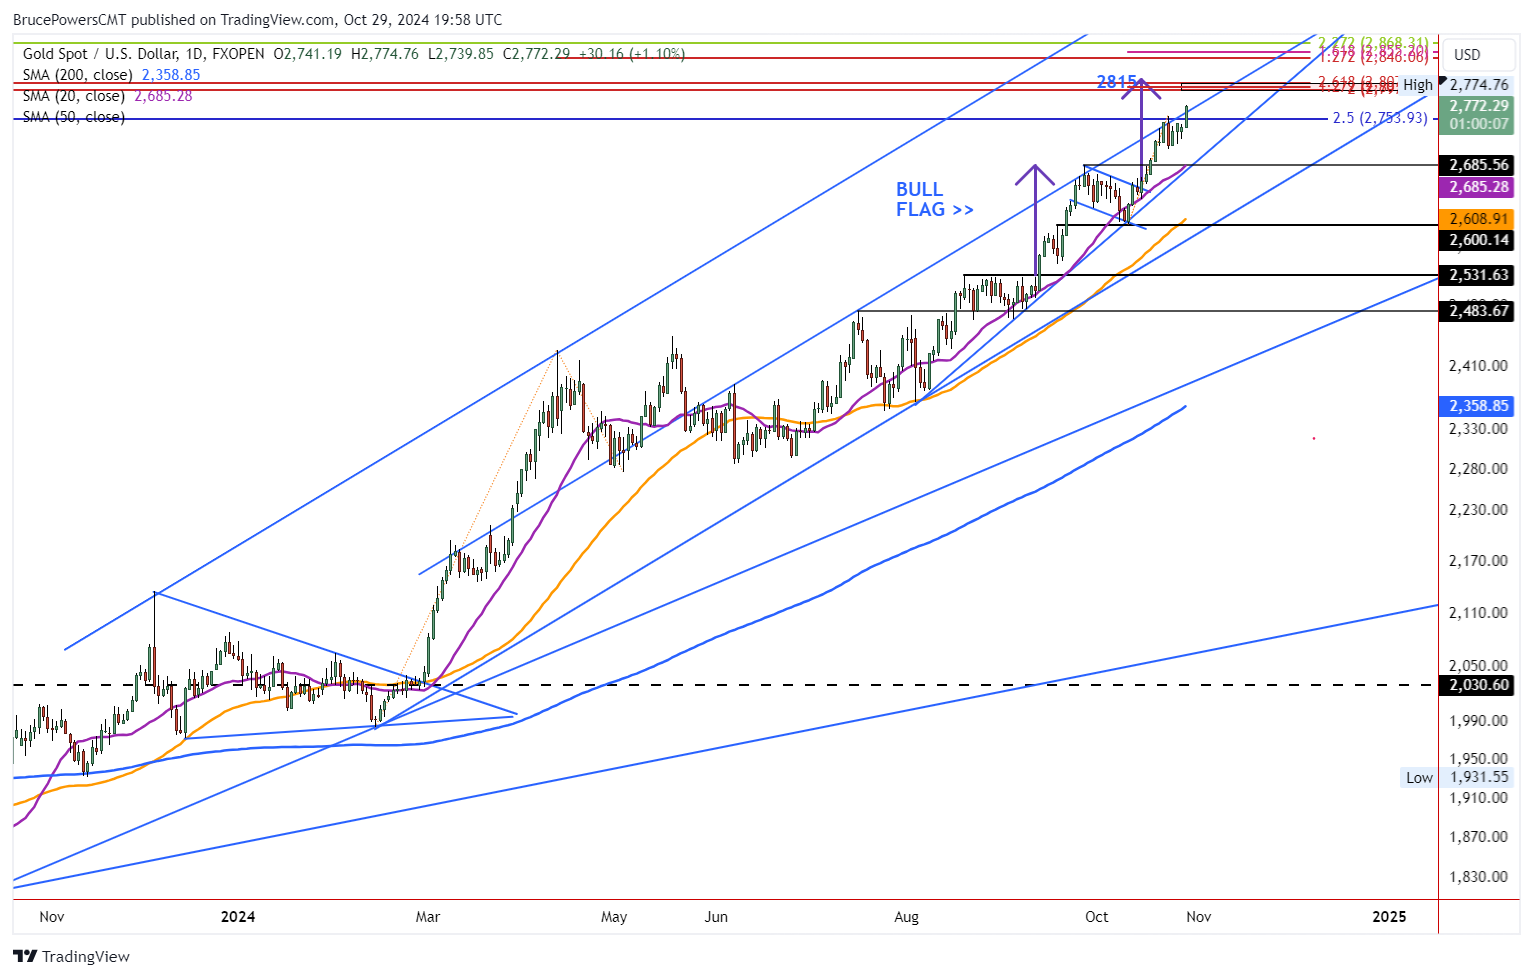

Breakout of Rising Channel
Notice that gold is trading around a top parallel channel line that is copied from the lower rising trendline and connects two previous swing highs. Resistance had been seen around that top line recently and it could yet again. Gold has yet to fully break out above the line and therefore it may show further signs of resistance. If gold continues to strengthen it is likely heading for the next higher target zone. That may entail a rise above and away from the top line or an ascent the continues at a similar slope and retains the channel line as resistance.
Targets 2,797 to 2,815
The next higher target zone is from 2,797 to 2,815. It includes several important levels by themselves but potentially more significant when clustered together. The top level of 2,815 is the target from the recent bullish flag pattern breakout. It is a key level as the next potential target zone above there indicates a possible jump to 2,846.
Otherwise, resistance may be seen on the approach to 2,815. Both other two price levels, 2,797 and 2,808, are determined from long-term extended Fibonacci levels. One pattern measurement starts in 2022, and the other in 2011. There is also a very short-term pattern target within the same price range at 2,801.
Near-term Support Levels
Near-term potential support is at the prior high of 2,758, followed by today’s low of 2,740. If the 2,740 level fails to hold as support the chance for a deeper retracement increases. The key near-term trend indicator remains the 20-Day MA, currently at 2,685. Notice that it has converged with prior resistance at the top of the recent bull flag. Since the 20-Day line seems to be tracking the internal uptrend line, it can be given a little added significance.
Gold Price Forecast
Every new Gold analysis as it publishes, today's technical signal and key levels, live price — on one page.
See all Gold forecastsFor a look at all of today’s economic events, check out our economic calendar.


