



CPI and Waller Strengthen Rate-Hike Case
Spot gold (XAUUSD) is down sharply on Tuesday after stronger-than-expected consumer price index (CPI) data may have given the Federal Reserve additional reasons to raise its benchmark interest rate in December. The initial selling, which drove gold prices lower by 1% ahead of the CPI report, was fueled by hawkish remarks from Federal Reserve Governor Christopher Waller, who said policymakers should consider at least a 50-basis-point rate hike if the inflation outlook worsens. Based on the fresh October CPI data, it looks like it did.
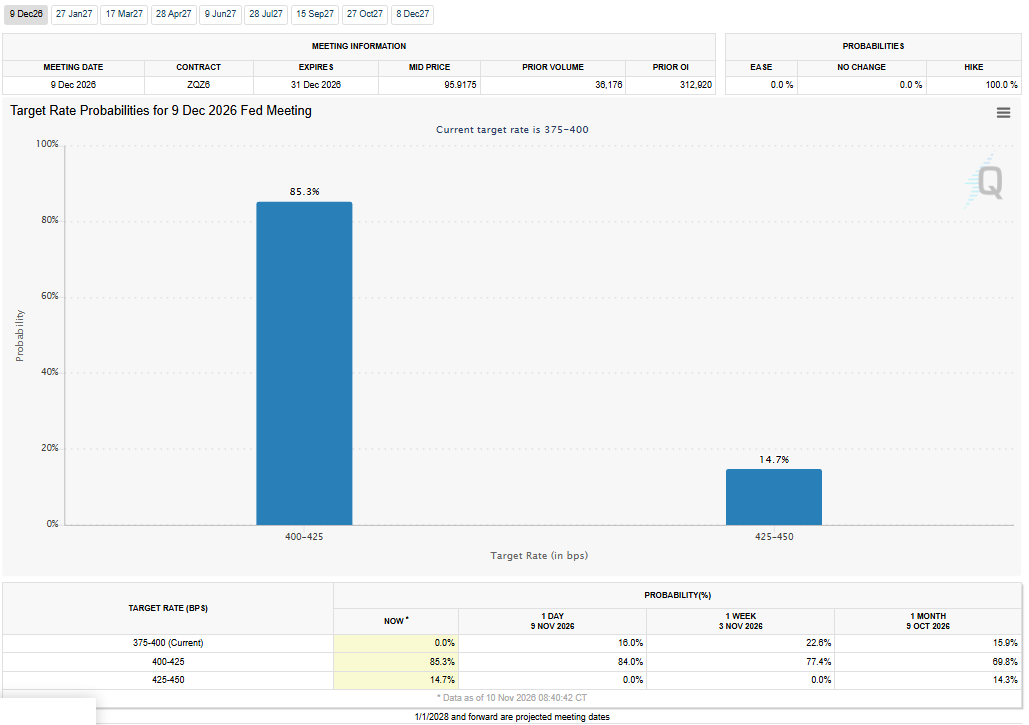
Gold traders now see a 100% probability of a December rate hike after Waller’s comment and the release of the CPI data, according to the CME’s FedWatch tool.
Headline CPI showed a monthly increase of 0.4%. Traders were looking for a 0.3% rise. Core CPI was 0.3% higher versus a 0.2% estimate.
Higher Yields and Dollar Weigh on Gold
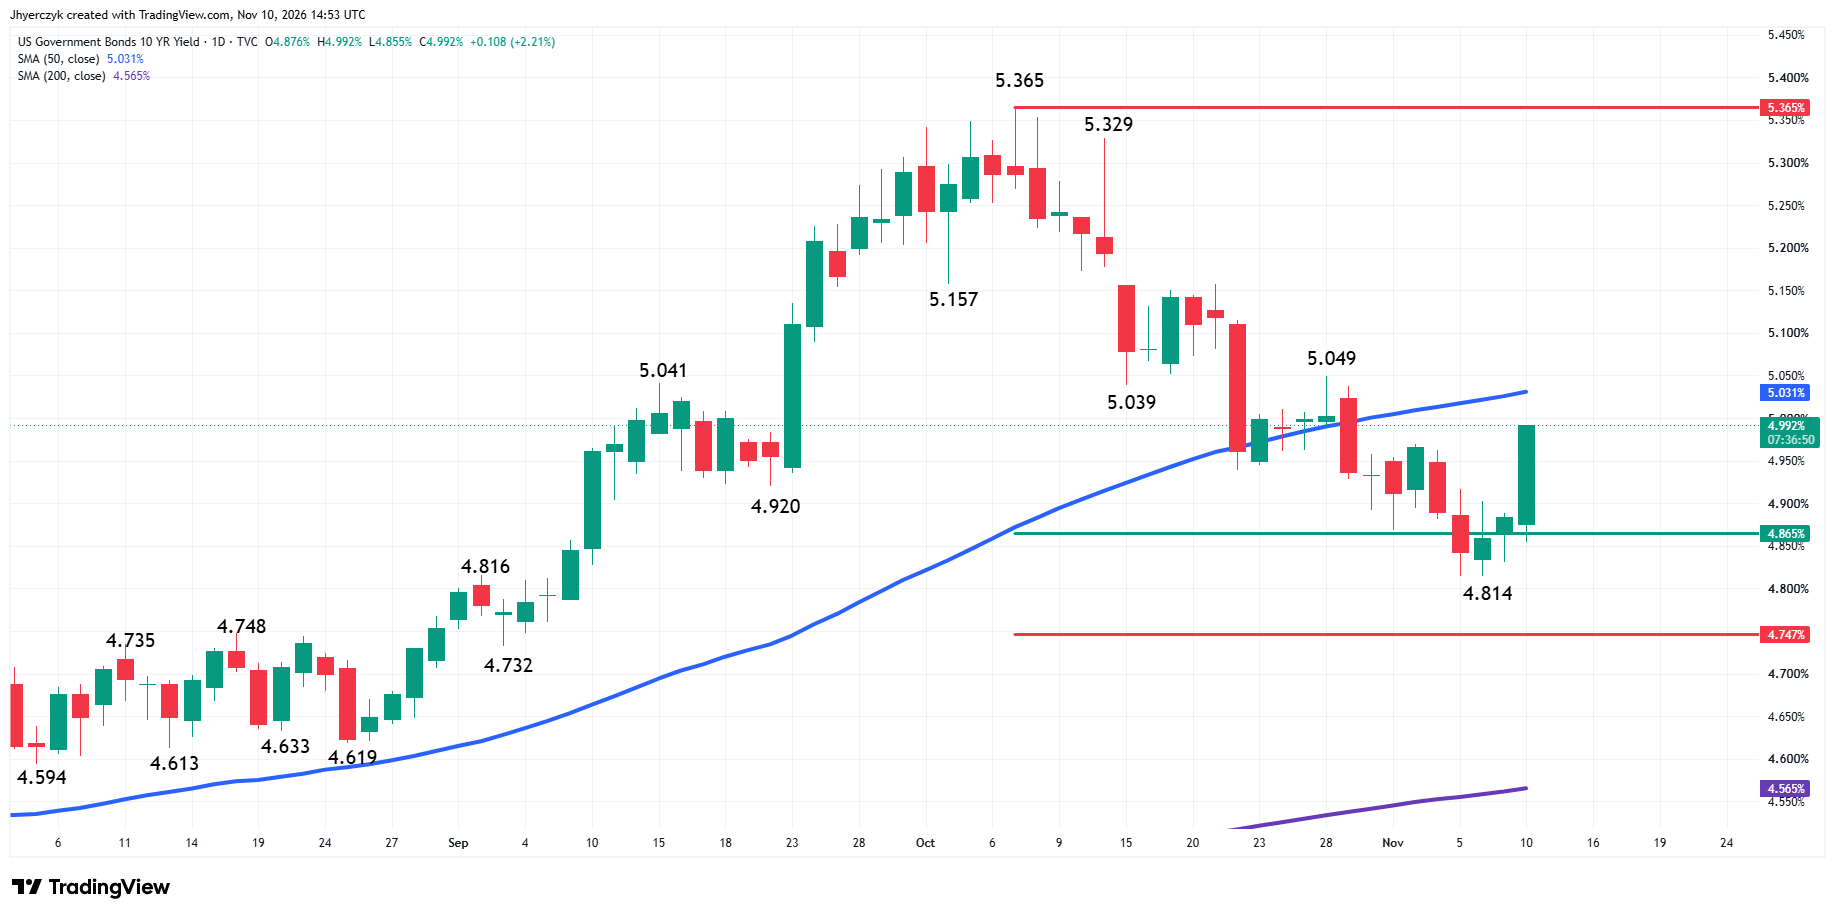
Weighing on gold prices was likely the jump in 10-year U.S. Treasury yields. Yields climbed more than 7 basis points. The 2-year yield, which is more sensitive to short-term Fed moves, jumped 15 basis points, and the less-sensitive 30-year Treasury yield rose more than 3 basis points.
With producer inflation on tap for Friday, one of the biggest concerns for gold traders will be a stronger-than-expected PPI number pushing Fed rate hike odds higher into 2027. Waller said, “Hiking only 25 basis points would put our credibility at risk, a risk I am not eager to take.” A higher Producer Price Index could give the Fed the nod to be aggressive rather than wait for the January meeting to make a second 25-basis-point rate hike.
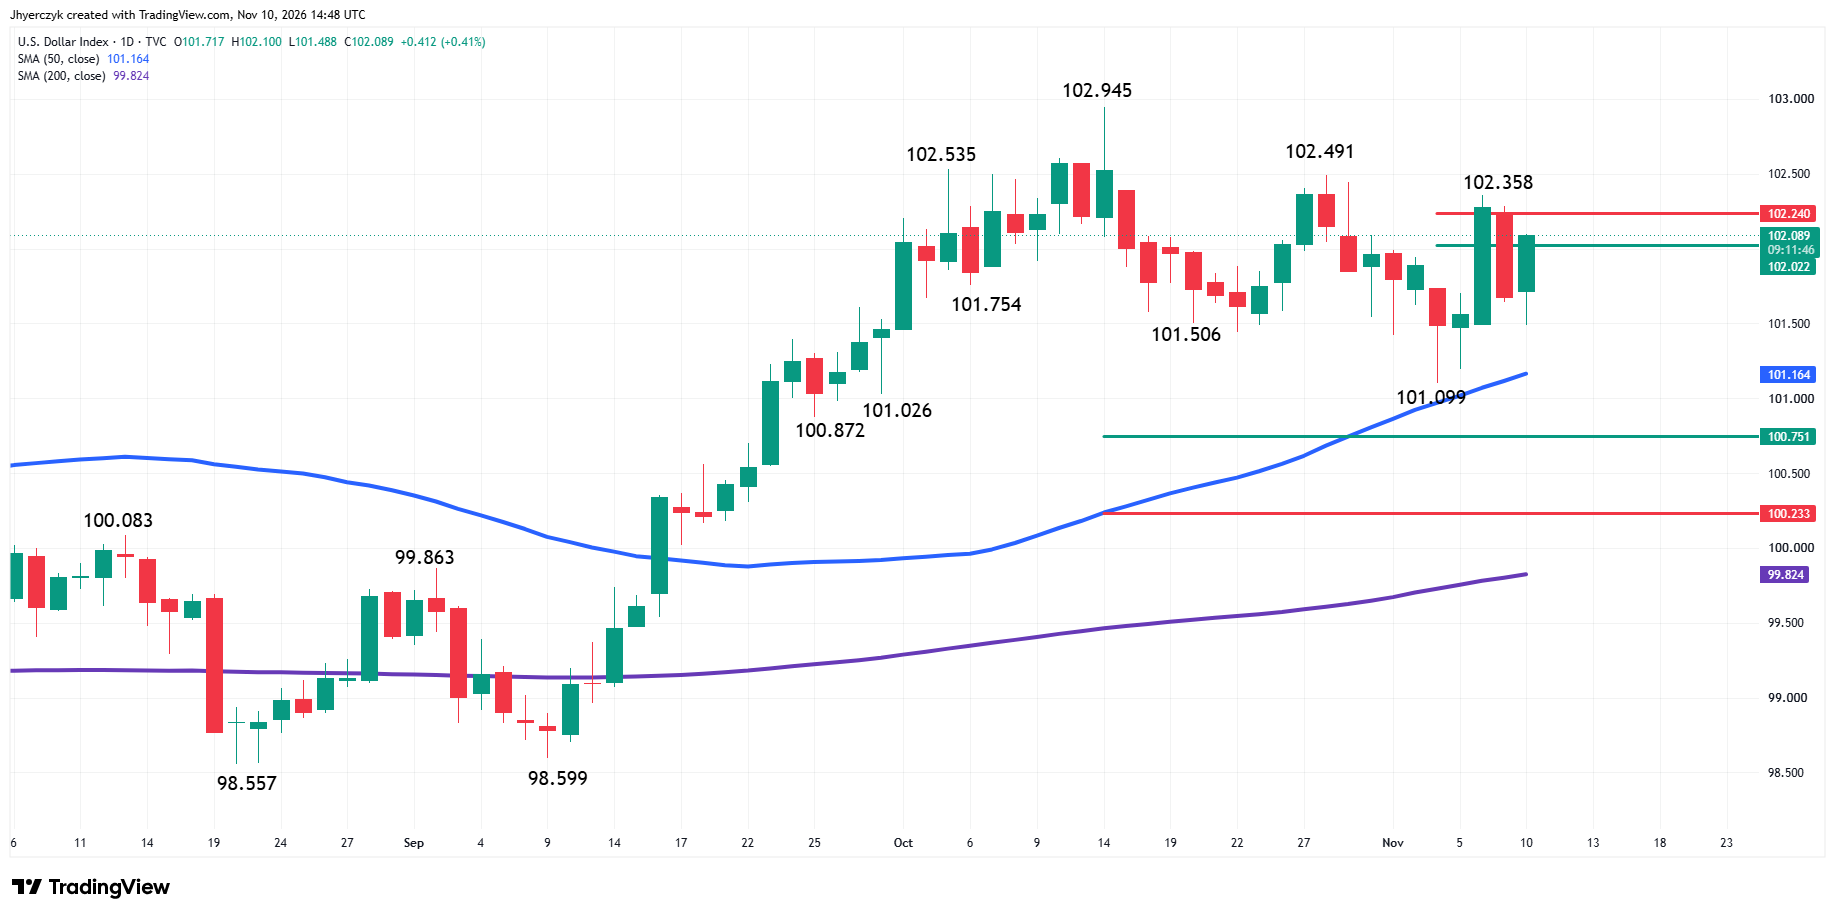
Higher yields also provided support for the U.S. Dollar Index (DXY), weighing on demand for dollar-denominated gold. Today’s rally in the dollar stopped short of last week’s high at 102.358, but further strength could take out this level later in the week, putting recent tops at 102.491 and 102.945 on the radar. This could pressure gold prices further.
Gold Price Forecast
Every new Gold analysis as it publishes, today's technical signal and key levels, live price — on one page.
See all Gold forecastsDaily Spot Gold (XAUUSD) Technical Analysis
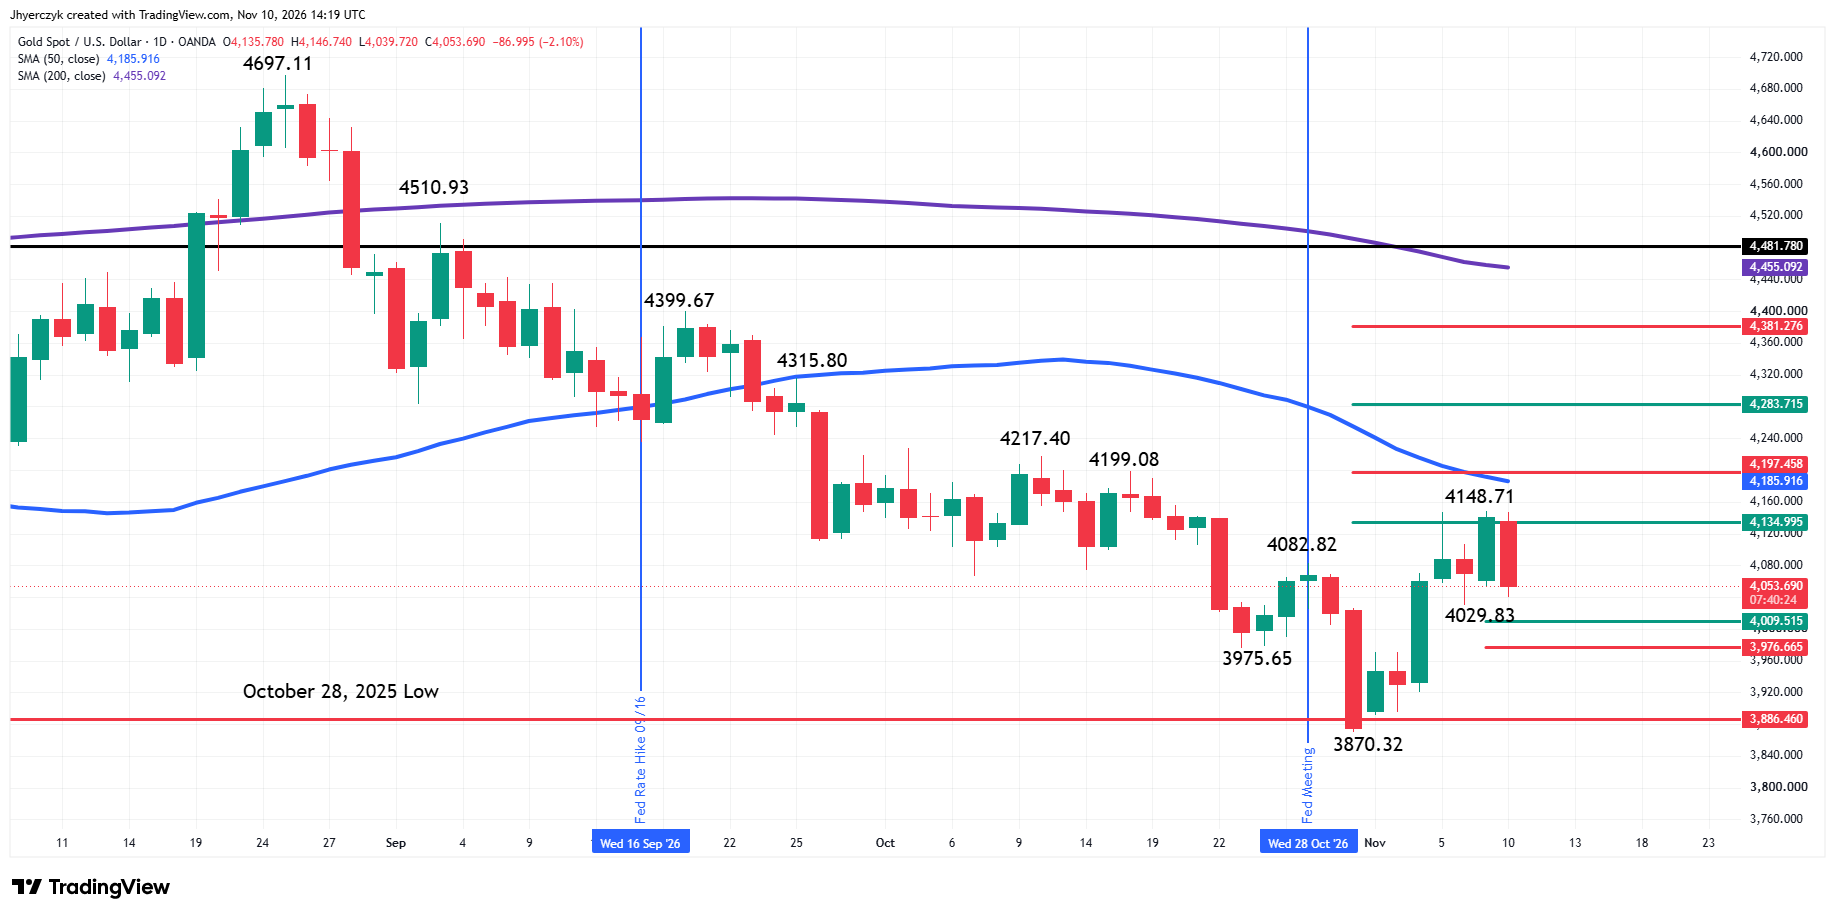
Spot gold started Tuesday’s session in an uptrend. A trade through $4148.71 will signal a resumption of the main trend. Taking out $3870.32 will change the main trend to down.
The minor trend is also up. Taking out $4029.83 changes the minor trend to down and could shift momentum to the downside.
Additional nearby resistance is a pair of main tops at $4199.08 and $4217.40.
The long-term range is $4697.11 to $3870.32. Its retracement zone target is $4283.72 to $4381.28.
The intermediate range is $4399.67 to $3870.32. Its retracement zone at $4135.00 to $4197.46 stopped yesterday’s rally at $4148.71. Today’s intraday high at $4146.74 also fell inside this zone.
The new short-term range is $3870.32 to $4148.71. Its retracement zone target is $4009.51 to $3976.66.
Spot gold currently trades on the weak side of the 50-day moving average at $4186.04 and the 200-day moving average at $4455.11. The 50-day is inside the intermediate retracement zone.
What to Watch
With both the minor and main trends up, my bias is cautiously bullish. The resistance spot gold is facing at $4135.00 to $4197.46 including the 50-day moving average at $4186.04 is driving my cautiousness.
My next challenge will be trader reaction to the short-term retracement zone at $4009.51 to $3976.66. A trade through the lower or 61.8% level will be a sign of weakness but not a change in the trend. However, it could lead to a retest of the main bottom at $3870.32.
If buyers show up on a test of the short-term retracement zone, then a potentially bullish secondary higher bottom could form. This move could create the upside momentum needed to retest the intermediate retracement zone and the 50-day moving average. Clearing this moving indicator and the 61.8% level at $4197.46 could trigger an acceleration to the upside with the next major target area the long-term retracement zone at $4283.72 to $4381.28.
The formation of the secondary higher bottom will be the key to possibly building a strong rally. Classic chart analysis identifies the first leg up as mostly short-covering. The secondary higher bottom is usually created by new buyers.
Fundamentally, the hot CPI reading and Waller’s comments may be enough to keep gold from extending its recent gains, with all eyes now turning to Friday’s PPI report and the PCE Index in the last week of the month. The next Fed rate decision is on December 9. The next CPI report is December 10.
If you’d like to know more about how to trade gold, please visit our educational area.