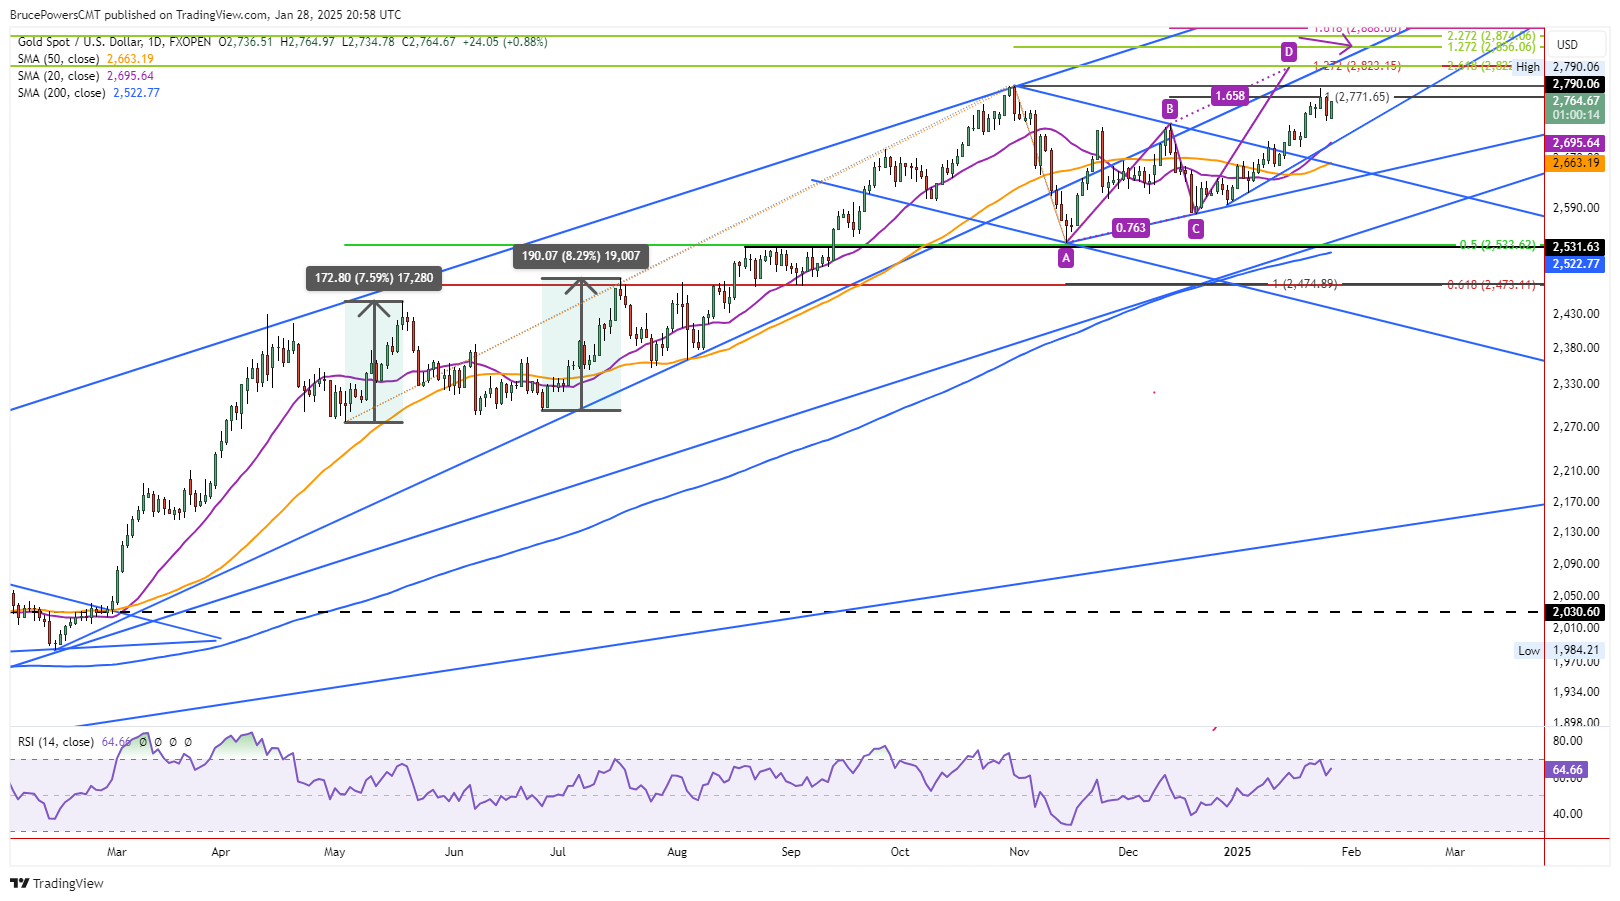
Gold continued to show signs of strength on Tuesday as it traded inside Monday’s price range following a dip on Monday. At the time of this writing, it continues to trade near the highs of the day, currently 2,765, and it is on track to close in a bullish position, in the upper third of the day’s trading range. This could lead to either a deeper pullback or a continuation higher to challenge resistance around the record high of 2,790. Regardless, a bullish trend continuation signal triggered last week on a rally above the prior swing high at 2,726 (B).

Deeper Pullback Would be Health for Trend
Resistance was seen at 2,786 last Friday, which led to yesterday’s pullback to a low of 2,731. Therefore, a drop below that low signals weakness and could lead to a deeper pullback. In that case, the price zone around the 20-Day MA, now at 2,696, is a key trend support indicator. Notice that it recently converged with a small rising trendline, giving it a little added significance.
The 20-Day MA was last reclaimed on January 7 and it was followed by further strength. Since there has not yet been a test of the 20-Day line as support, the 20-Day line becomes a target. But only if there is a signal pointing to likely further selling. A drop below Monday’s low of 2,731 would provide a signal. If the 20-Day line fails, the lower 50-Day MA at 2,663 becomes a target.
First Higher Target at 2,823
On the upside, signs of strength are indicated on a rally above 2,773. Then, a bull trend continuation signal is generated on a breakout above the trend high of 2,786. Subsequently, a decisive breakout above the 2,790 record high points to a first upside target at 2,823. That is the 127.2% extended target for the rising ABCD pattern shown in purple on the chart. A little higher is the 127.2% extended retracement for the most recent correction that ended at the November swing low (A).
Highest Weekly Closing Price Ever
It is important to consider that last week ended with gold closing at its highest weekly closing price ever. This is bullish and is supporting evidence for an eventual continuation to new record highs. Given the significance of resistance around the current record high, it would be healthy for gold to pull back a bit more first. Let’s see what happens.
Gold Price Forecast
Every new Gold analysis as it publishes, today's technical signal and key levels, live price — on one page.
See all Gold forecastsFor a look at all of today’s economic events, check out our economic calendar.