


Spot gold (XAUUSD) is being pressured by sellers for a second session on Friday. Bullion hit its lowest price since mid-July and is rapidly approaching price levels not seen since October 2025. The current catalysts include sustained anxieties surrounding inflation and its potential impact on interest rates and Fed policy.
GDP and Inflation Strengthen the December Hike Case
This week, the primary focus has been on the Fed’s interest rate decision and policy statement. However, there were other reports and outside factors that had a direct influence on prices. On Thursday, U.S. GDP data came in stronger-than-expected on the same day that crude oil rose, renewing pressure on the Fed to raise rates in December.
Thursday’s GDP and PCE reports painted a somewhat bearish outlook for gold prices and we’re still seeing some of the impact on Friday. GDP grew more than expected from July to September at the same time PCE inflation accelerated in September. The combination of these two reports raised expectations of a rate hike in December. The current target rate probabilities for the December 9 Fed meeting show a 25.9% chance of no rate hike and a 74.1% chance of a 25-basis point rate hike.
Interest Rates, Not the Usual Bullish Narratives
Forget the safe-haven demand, there’s been a major war between the United States, Israel and Iran since late February and gold is down $1,340.51, or 25.4%, from its February 27 settlement at $5,278.51. Forget about central bank buying, the data is usually stale, and for all we know, they could be selling right now. Forget about the demise of the U.S. Dollar, it recently hit its highest level since April 2025. All these factors may be important at some point, but not at this time. The key factor is the direction of global interest rates, led by the Federal Reserve.
The Fed held this week after a September rate hike and in about 40 days, it is expected to raise rates again. Meanwhile, several major central banks may have hit the pause button on rate hikes this week, but they all said they are still in a tightening cycle.
Gold Price Forecast
Every new Gold analysis as it publishes, today's technical signal and key levels, live price — on one page.
See all Gold forecastsEnergy Prices Keep Inflation Risks Elevated
In the U.S. and Europe, the central banks cited inflation risks from surging energy costs as their greatest concerns. And conditions haven’t improved in the energy sector either on Friday with WTI and Brent crude oil rising over 2%.
Peace in the Middle East could break out at any time, but if oil prices remain elevated then so will inflation rates. My outlook for gold prices hinges upon the Fed’s rate tightening cycle and right now the market is only pricing in a December hike.
In January, they’re only slightly above the 50% level and in March, they’re slightly below the 50% level. So this may be an early indication that gold may be closer to a bottom than previously thought. The switch from Fed rate cut expectations to actual Fed rate hikes has essentially erased all of its gains since October 2025. This condition would need to start showing signs of flipping the other way before the bottoming process can begin.
Daily Spot Gold (XAUUSD) Technical Analysis
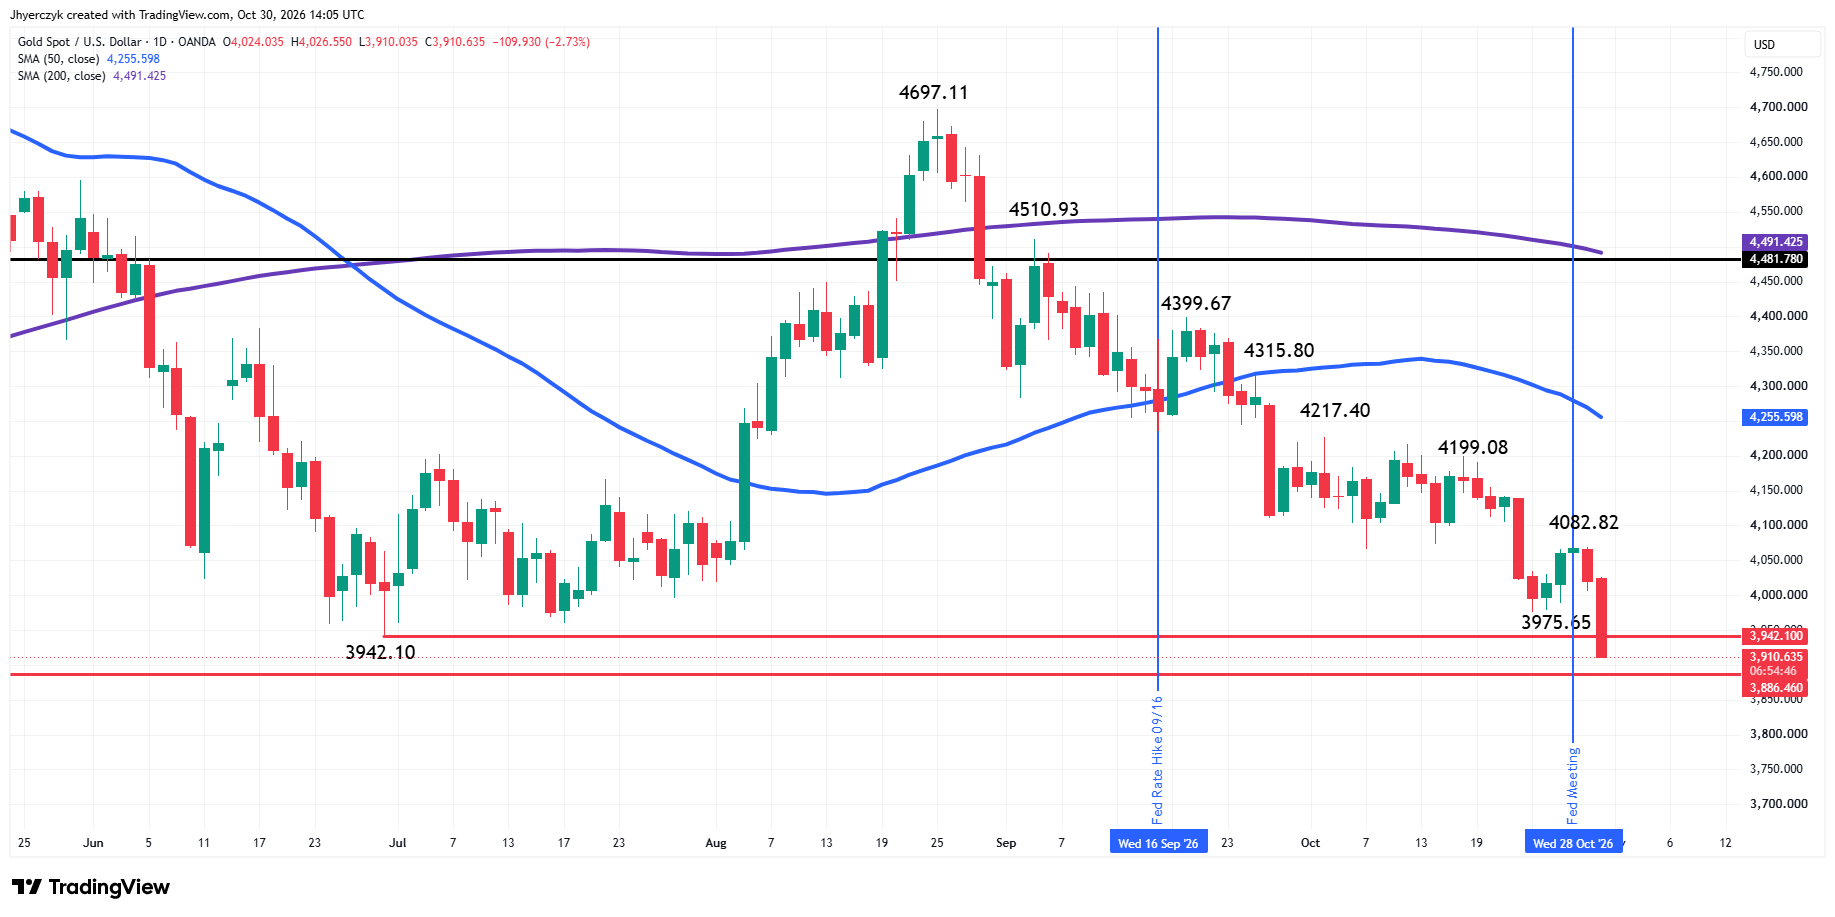
Spot gold is sharply lower on Friday and rapidly approaching its October 28, 2025 bottom at $3886.46. So essentially, the market has erased nearly all of the major gains from last October to late January 2026.
The main trend is down according to the daily swing chart. A trade through $4082.82 will change the main trend to up. The swing bottoms at $3975.65 and $3942.10 have been taken out, reaffirming the downtrend and setting up the possibility of a plunge into $3886.46.
With this type of selling pressure and the prolonged move down in terms of price and time, traders should start watching for a closing price reversal bottom. I don’t expect it to lead to a change in trend, but it could alleviate some of the downside momentum.
Weekly Spot Gold (XAUUSD) Technical Analysis
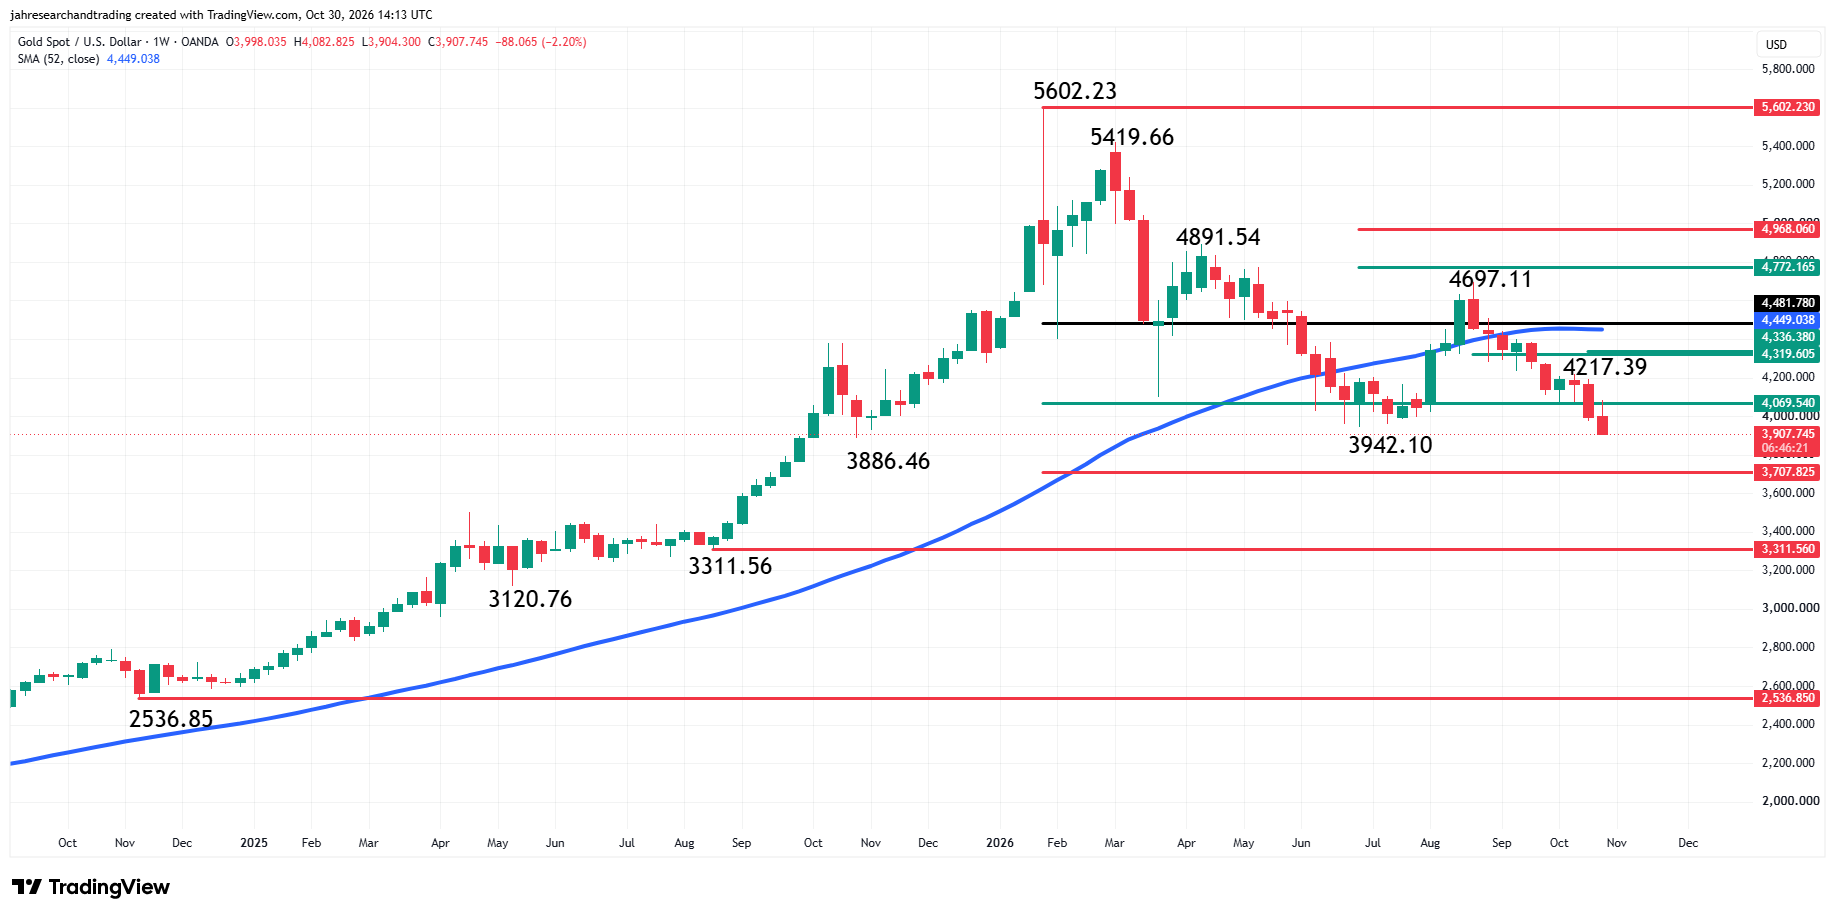
Spot gold is lower on the weekly chart. The main trend is down according to the weekly swing chart. A trade through $4697.11 will change the main trend to up. The market just took out the swing bottom at $3942.10, reaffirming the downtrend. That move puts swing bottoms at $3886.46 and $3311.56 on the radar.
The minor trend is also down. Taking out $4217.39 will change the minor trend to up and possibly shift momentum.
The long-term range is $2536.85 to $5602.23. The market is currently sitting inside its retracement zone at $4069.54 to $3707.83.
Downside momentum is strong and the market is in a prolonged downswing in terms of price and time. This puts it in the window of time for a closing price reversal bottom. That makes last week’s close at $3995.81 the level to watch the rest of the session. A close above this level will form a closing price reversal bottom on the weekly chart, which could lead to a two-to-three-week counter-trend rally if confirmed next week.
What to Watch
Daily Spot Gold (XAUUSD)
The trade under both the 50-day moving average at $4255.62 and the 200-day moving average at $4491.42 has created extremely bearish conditions when combined with the main trend indicator.
We could see a technical bounce on the first test of $3886.46, but that won’t alter the weak conditions until the market closes over $4020.56.
Weekly Spot Gold (XAUUSD)
My downside bias is being supported by the bearish swing chart formation, the move under the long-term 50% level at $4069.54 and the trade under the 52-week moving average at $4448.82.
Unless there is a close over $3995.81, look for the selling to possibly extend into the long-term 61.8% level at $3707.82.
If you’d like to know more about how to trade gold, please visit our educational area.