



Gold (XAU) prices remain under pressure on Tuesday as uncertainty increases before the US midterm election. The correction in oil prices on Monday triggered a rebound in gold prices, but the renewed tensions in the Middle East may lift oil prices again and increase fears of inflation. The strong US factory data also keeps the December rate hike in play. The high interest rates may limit the recovery in gold prices. In my view, the gold price must break above $4,000 to provide a case for strong recovery.
Gold Faces Pressure Ahead of the US Midterm Elections
Oil Rebound Renews Inflation Risks for Gold
Gold prices remain under pressure on Tuesday as the market is preparing for the US midterm elections. Investors may continue to sell gold to cover losses and margin calls, which may keep the gold price under pressure in the short term.
Oil prices remain the key risk for gold. Brent oil prices dropped significantly on Monday as hopes for peace deal between the US and Iran reduced fears of disruptions in supply. But the recent attacks by the US on Iran produced rebound in oil prices on Tuesday.
The correction in oil prices may create a rebound in gold as it reduces fears of inflation and pressure for high interest rates. But any escalation in the Middle East or any new attacks in Iran may continue to fuel concerns about supply and push energy prices higher again.
Strong US Factory Data Keeps a December Rate Hike in Play
The US factory report also shows that pressure from interest rates may persist. The chart below shows that the ISM manufacturing PMI increased to 55.5 in October from 54.5 in September. The prices index eased to 75.2 from 77.9, but it still shows the increase in input costs.
Gold Price Forecast
Every new Gold analysis as it publishes, today's technical signal and key levels, live price — on one page.
See all Gold forecasts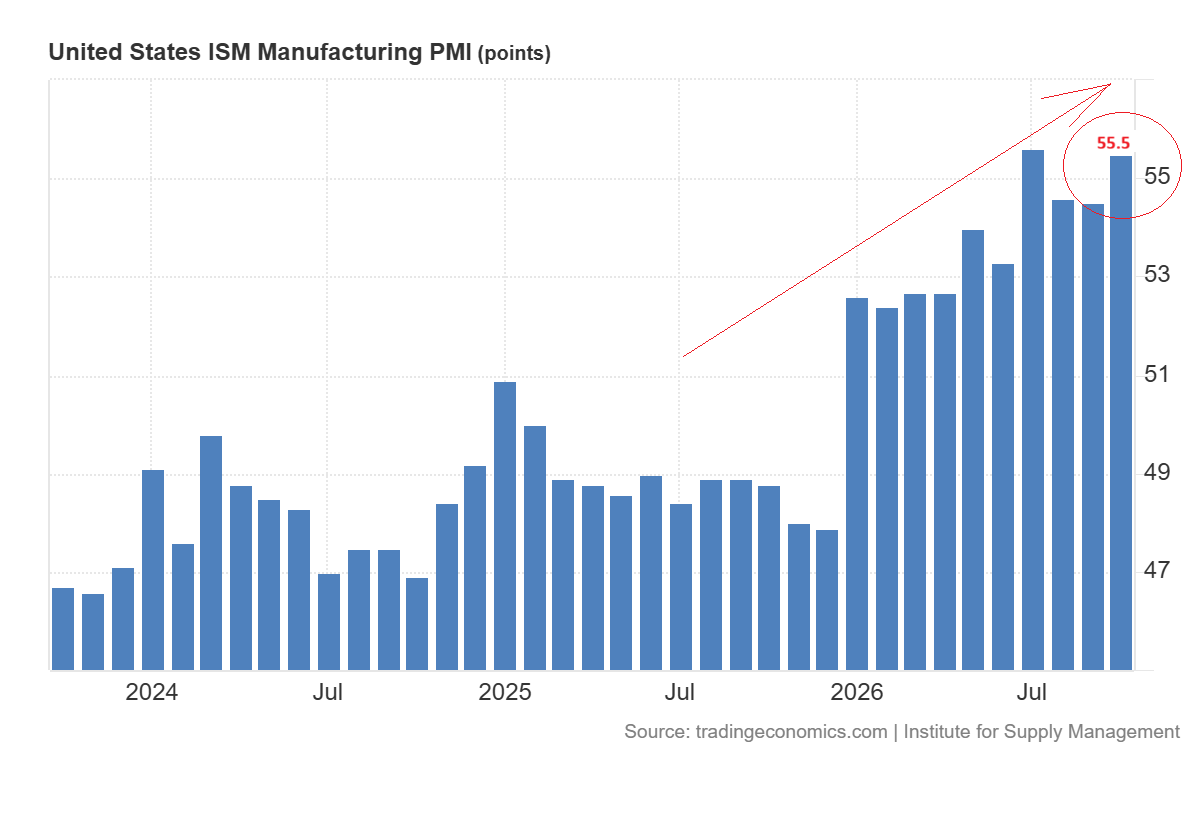
This data suggests that factory activity remains strong. This suggests that inflation pressure may continue. The market still expects 75% chance of a rate hike in December. I think that the expectations of rate hikes remain the key risk for gold in the short term.
Gold Price Forecast: Key Support and Resistance Levels
Weekly Chart: Gold Risks a Drop to $3,500 Below $3,900
The weekly chart for spot gold shows that the price broke below the key support level of $3,900 last week. But the price still consolidates within the $3,900 to $4,000 area which has been the pivotal zone for gold. If gold continues to drop below $3,900, it may continue toward $3,800. A confirmed break below $3,800 will increase the risk of deeper correction towards $3,500.
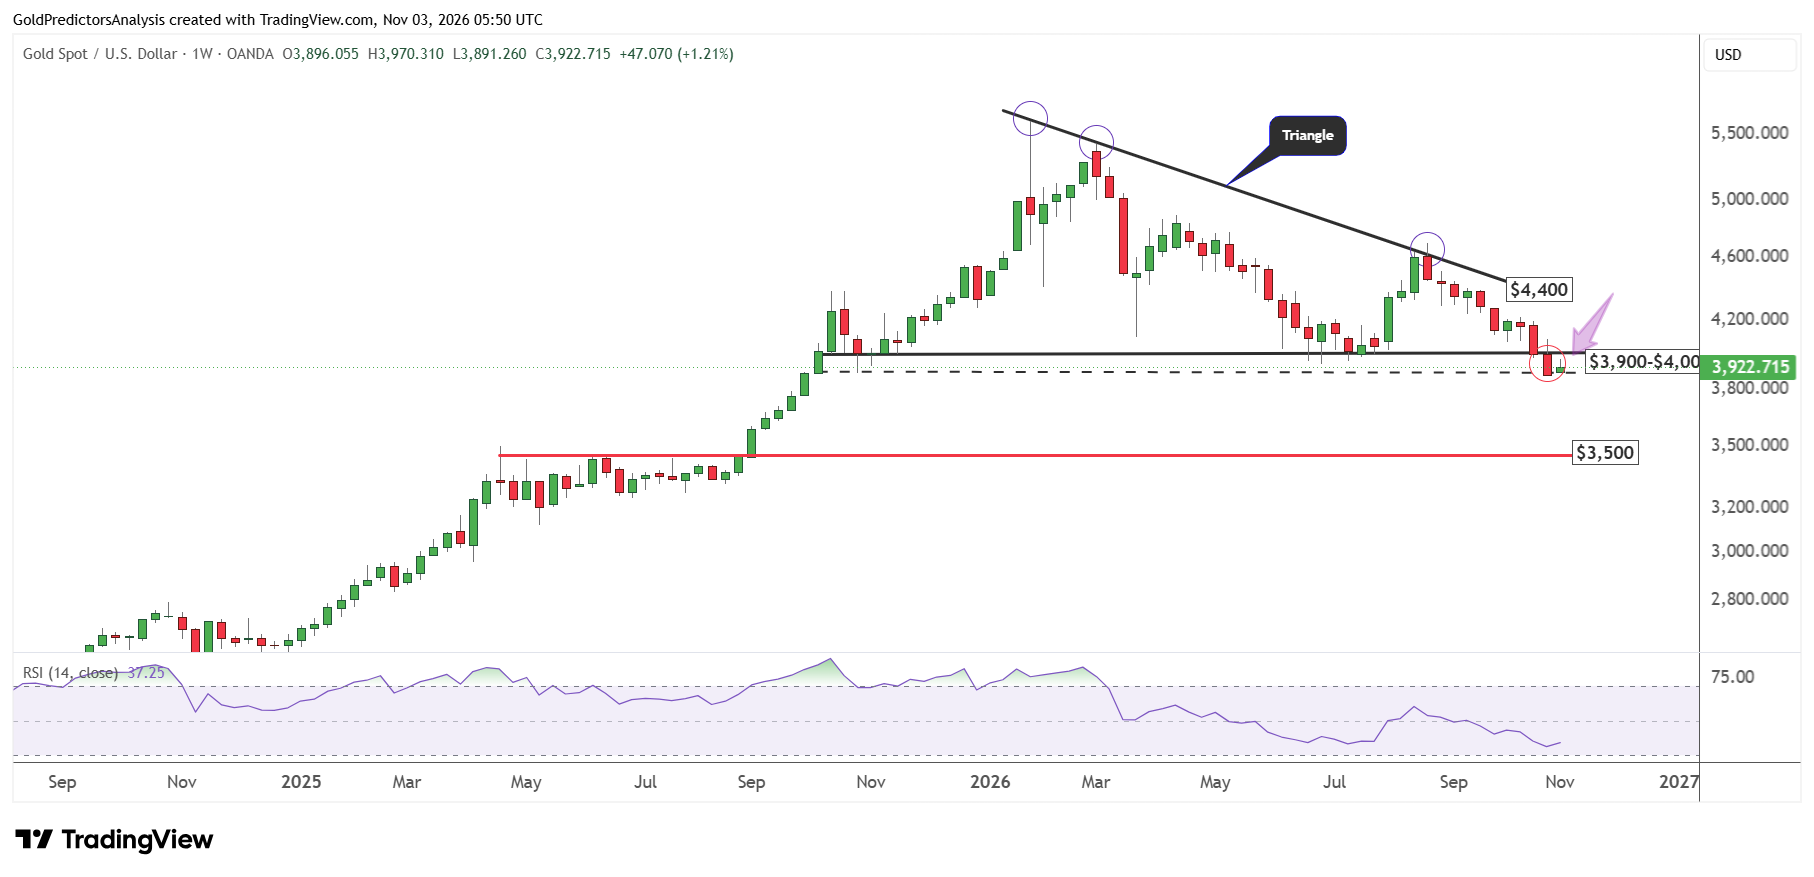
But if the price successfully recovers above the $4,000 region and closes the week above $4,000, it will likely increase the possibility of rebound toward the $4,250 and $4,400 regions. The price action during the past few weeks has been negative which increases the risk of continued weakness during next few days.
Daily Chart: Gold Retests Resistance Near $4,000
The daily chart for spot gold shows that the sell-off on Friday last week broke the ascending trend line that stretches from the lows of May 2025. But the recovery from the low on Friday has pushed the price back toward the breakout area.
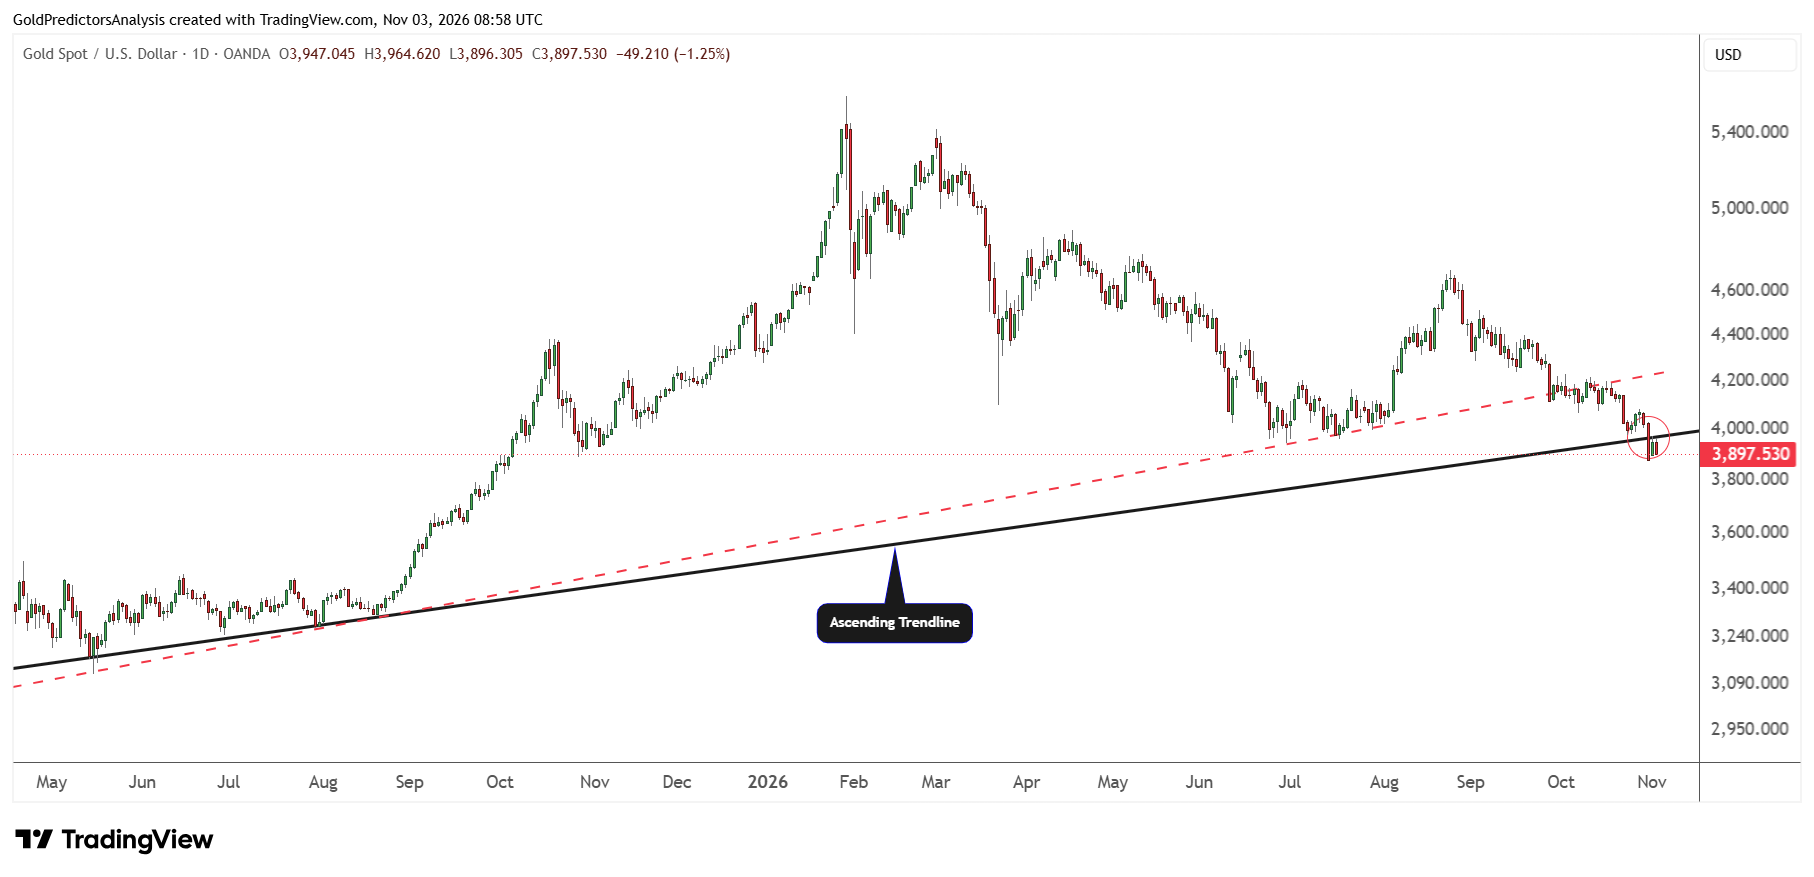
The price is now hovering around the resistance area and looking for next move. A break above this trend line at $4,000 will likely suggest recovery toward $4,250. But a break below $3,880 will likely increase the risk of deeper correction in the short term.
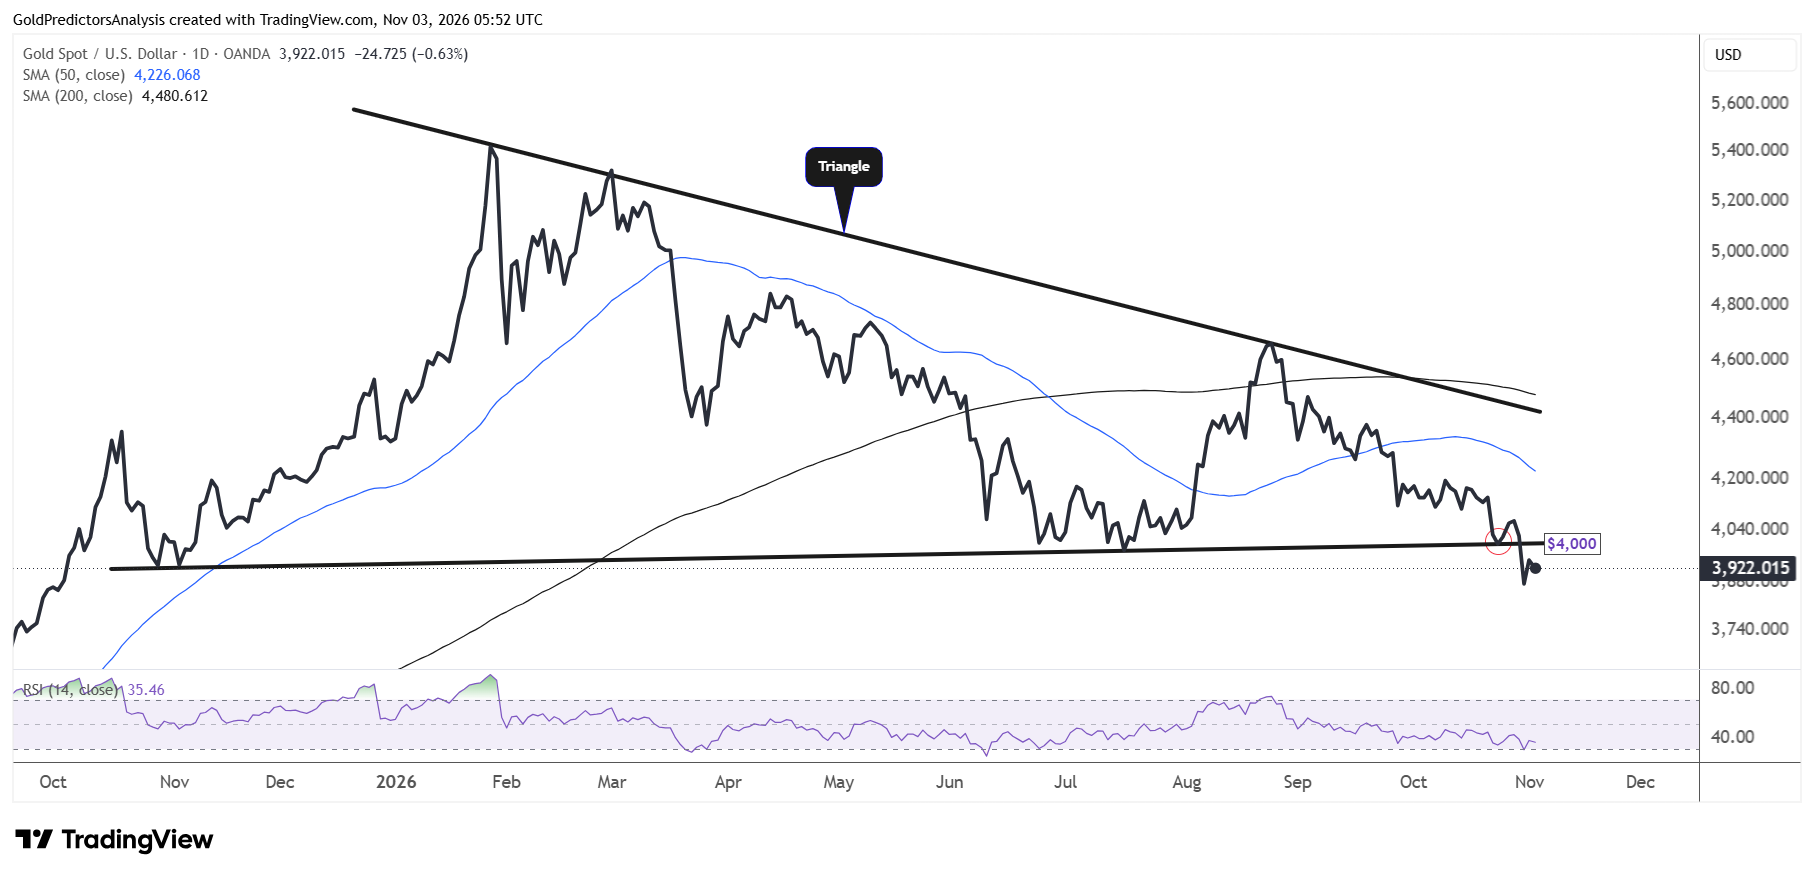
Line Chart: Triangle Breakdown Keeps Gold Under Pressure
The line chart shows a clear break from the $4,000 level which has been the key support of the triangle. The breakdown from the triangle suggests negative price action. But the RSI has reached near oversold territory which suggests a rebound in the short term.
The price must remain below the $4,250 level to remain bearish in the short term. But a break above $4,250 will likely open the way for further upside towards the $4,400 area.
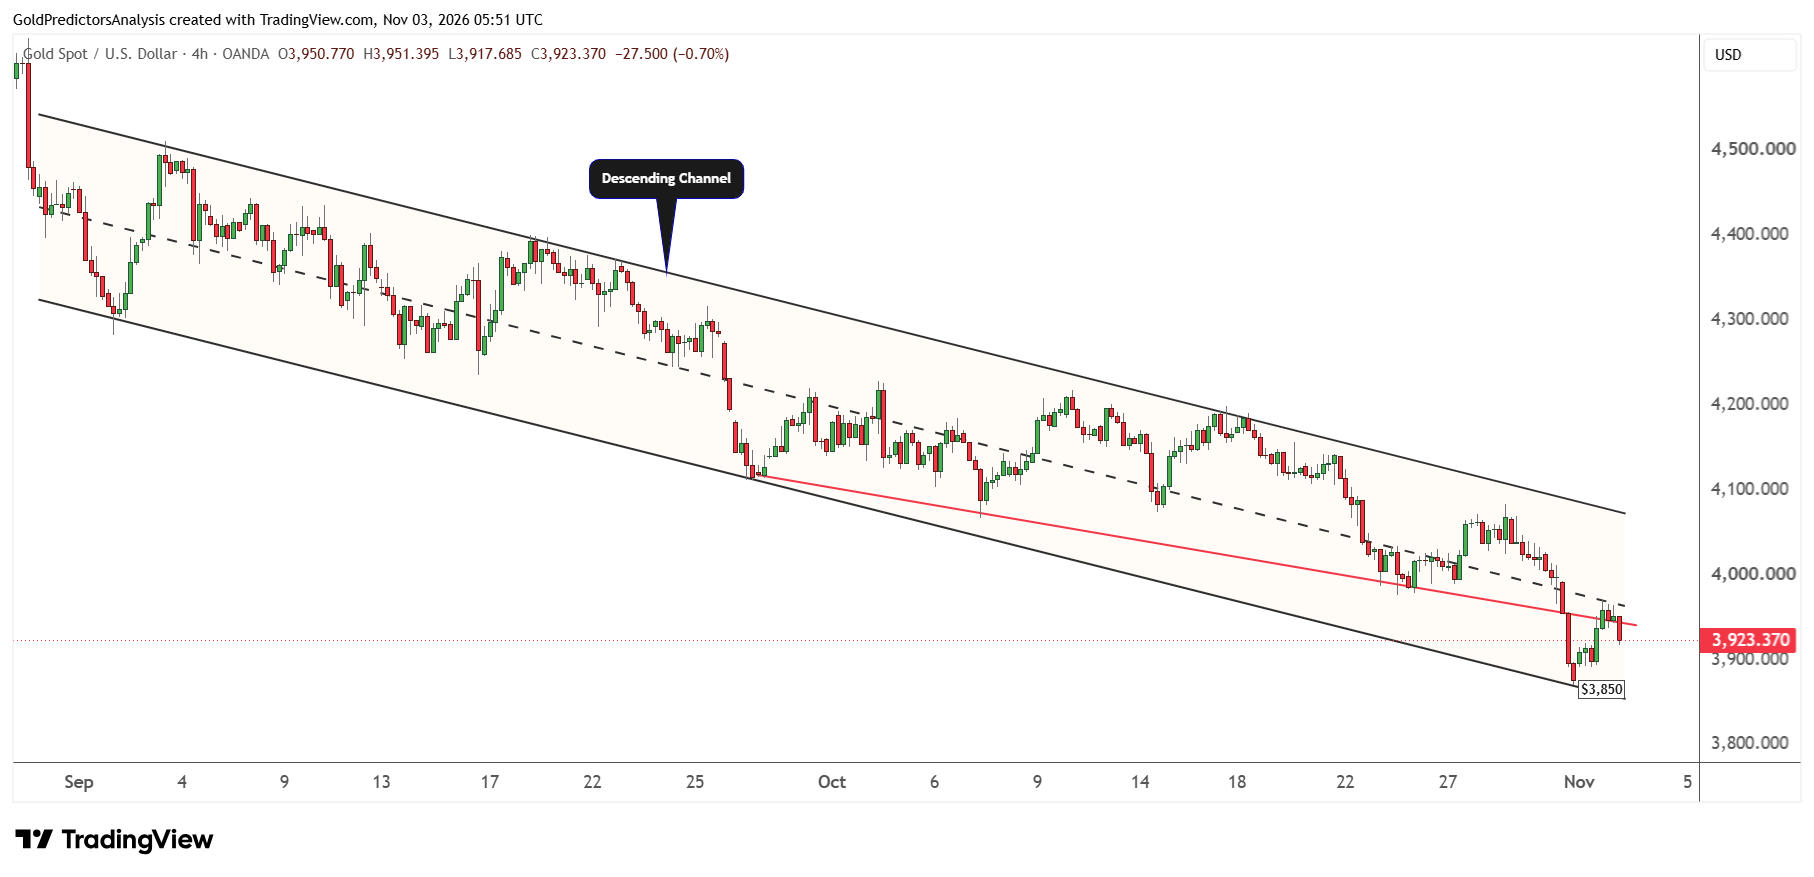
4-Hour Chart: Gold Faces Resistance at $3,970
The 4-hour chart for spot gold shows that the price has reached the lower boundary of the descending channel pattern that stretches from the high of September 2026. The rebound from the lower boundary of this channel at $3,870 has hit resistance near the midline of the channel.
If the price clears the $3,970 level, it may rally toward the key resistance of $4,000. But the continued weakness below $3,900 may push the price toward the $3,800 area in the short term.
What to Watch Next
Gold prices remain under pressure as the market expects the risk of a rate hike in December. Oil prices corrected on Monday but the recent attacks in Iran may fuel a rebound in energy prices and create the risk of inflation.
The outcome of election may also shape the next move in gold. If Republicans retain both chambers of Congress, expectations of larger deficits may lift the US dollar higher. The strong US dollar may keep gold under pressure. But a divided Congress offers some support to gold if policy disputes introduce weakness in the dollar.
A weekly close above $4,000 is required to suggest further recovery to $4,250. But a break below $3,800 may create deeper correction in gold to $3,500. In my view, the recent rebound in gold remains fragile as long as the price remains below $4,000.