Gold took a rest on Friday and traded inside day with a high of 2,762 and a low of 2,733. However, at the time of this writing it continues to trade near the lows of the day and may end the day lower. The day’s range is largely contained within the lower half of yesterday’s trading range, which can be considered bearish.
Also, notice the developing bearish shooting star candlestick pattern, although not at the high of a trend. It reflects bearish behavior for the day and the potential for a continuation lower.
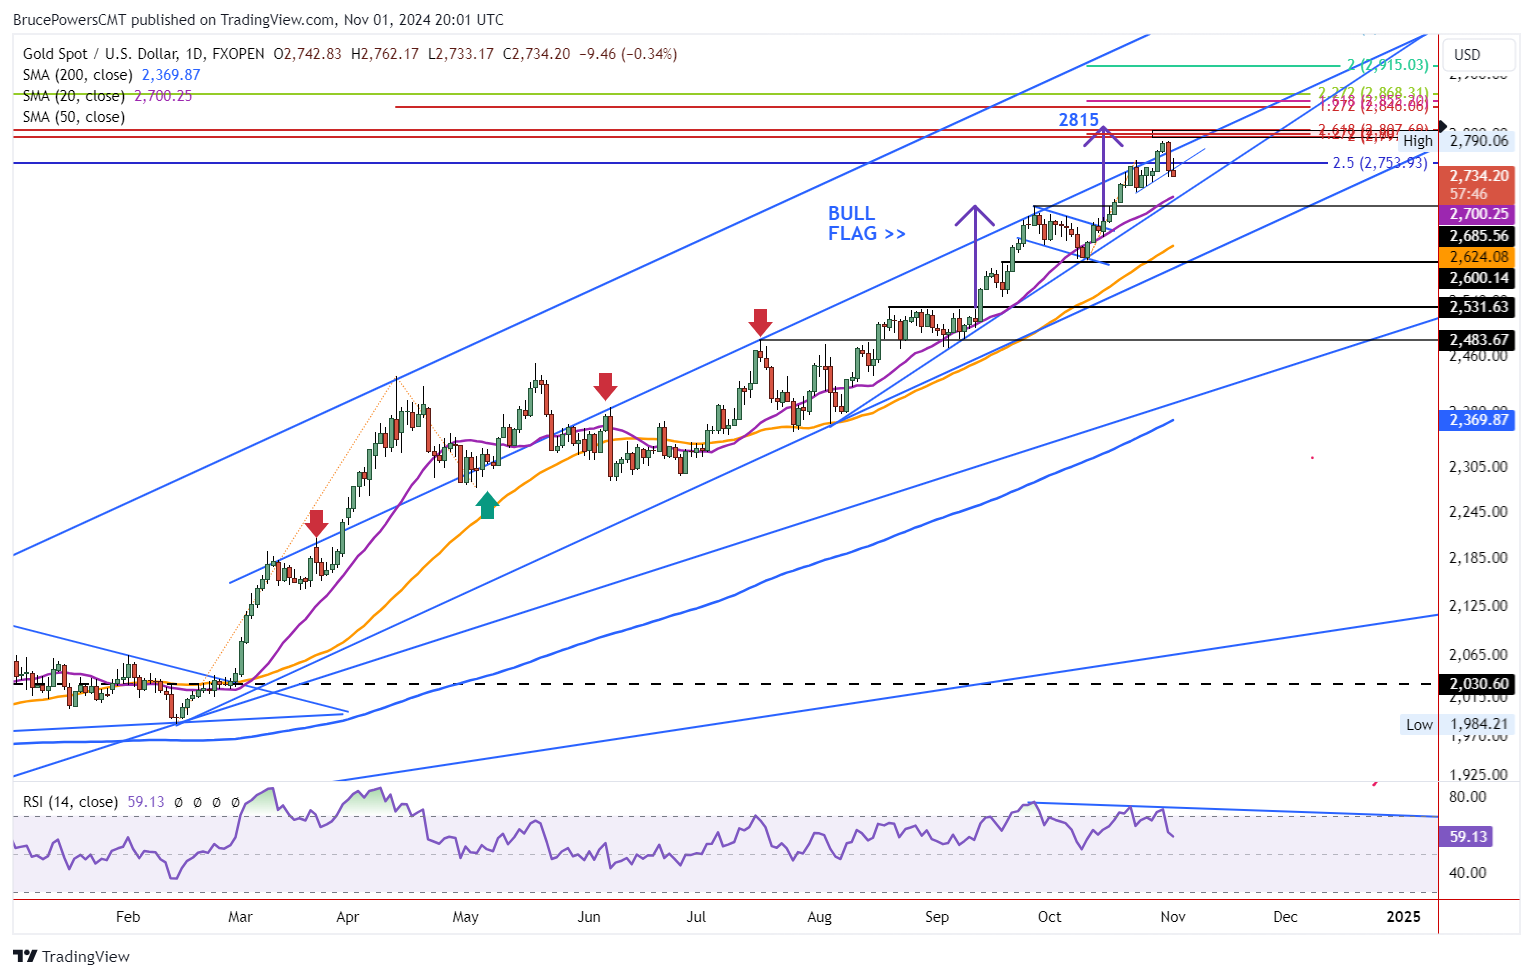

Breakdown in Process
Yesterday, gold dropped below a short trendline that marks trend support for a tight consolidation pattern from the past couple of weeks. That put it at risk of moving into a bearish correction, especially since the day’s close was in the lower third of the day’s price range. Today’s bearish candle is additional evidence for a possible bearish continuation.
Subsequently, a decline below yesterday’s low of 2,732 will likely lead to a test of lower support areas. The first being a range from 2,700 to 2,686, consisting of the 20-Day MA, and a prior trend high and bull flag high, respectively. Moreover, an internal uptrend line is pointing to a similar price area. If it fails to stop the descent, the 50-Day MA at 2,624, along with the bottom of the flag at 2.60, become likely targets.
Weekly Chart Ending Bearish
Of greater concern is what is shown on the weekly chart (not included). Gold is set to complete a bearish doji shooting star candlestick pattern today. And it is set to close weak, in the lower third of the week’s trading range. A decisive drop below this week’s low of 2,725 will trigger a breakdown of the weekly pattern and therefore a bearish weekly reversal.
It would be confirmed on a daily close below the low. The next lower potential weekly support level would be last week’s low of 2,709. Also, keep an eye on the three-week low at 2,638 if gold continues to fall. Gold is very overbought on the weekly relative strength index (RSI) and shows a minor bearish divergence in the daily time frame.
Gold Price Forecast
Every new Gold analysis as it publishes, today's technical signal and key levels, live price — on one page.
See all Gold forecastsFor a look at all of today’s economic events, check out our economic calendar.