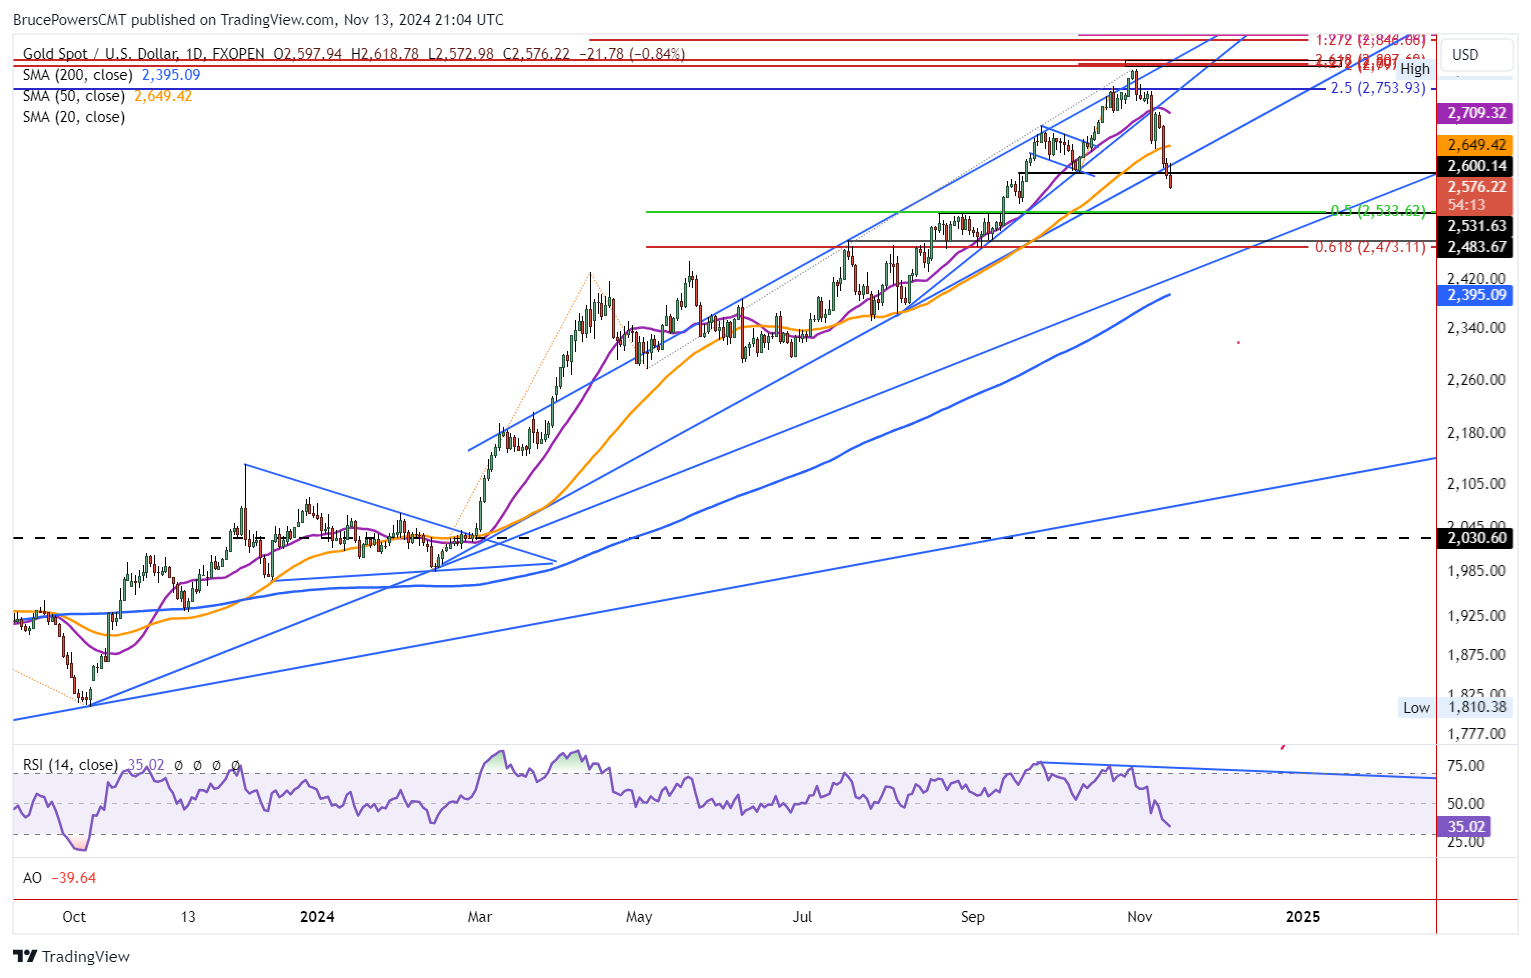
Selling again dominated trading in gold on Wednesday as it fell to a new trend low of 2,575. Also, it continues to trade near the lows of the day at the time of this writing and may fall further before the end of the day. The bearish correction saw gold drop through the 50-Day MA on Monday, an uptrend line and monthly low at 2,602 on Tuesday, and reach a new low today. Downward momentum has been steady with lower prices likely. A daily close below the prior trend low of 2,590 will further confirm the bear trend.

Targets 50% Retracement at 2,534
Indications are that gold is heading towards a test of support around the 50% retracement at 2,534 and prior resistance at 2,532. The lower price was also the highest traded price for August. Also, 2,532 begins a price range down to approximately 2,484. Support might be seen anywhere within that range. Subsequently, the next lower target looks to be a range from 2,484 to 2,473. The first price level is a prior trend high from July, followed by the 61.8% Fibonacci retracement at 2,473.
Monthly Bearish Reversal Triggered
Following a break below the October low yesterday, natural gas confirmed the breakdown by ending the day below the monthly low. The monthly trend of higher monthly highs and higher lows has persisted for eight months until now. This is a bearish sign on the larger time frame indicating further selling pressure for the precious metal.
Downtrend Progresses
Notice that resistance today was seen at a high of 2,619, a clear test of resistance at the internal trendline. The line was previously representing support but since the drop below the line this week, it now represents potential resistance. And it acted as an area of resistance today as gold turned back down once it was hit. In a downtrend, once support is broken and then subsequently successfully tested as resistance, the decline is ready to proceed.
That is what we see today. Since the close for today will likely occur in the lower quarter of the day’s price range and below yesterday’s low of 2,590, sellers remain clearly in charge. So, the next lower target zone is looking more likely to be reached before this correction is over.
Gold Price Forecast
Every new Gold analysis as it publishes, today's technical signal and key levels, live price — on one page.
See all Gold forecastsFor a look at all of today’s economic events, check out our economic calendar.